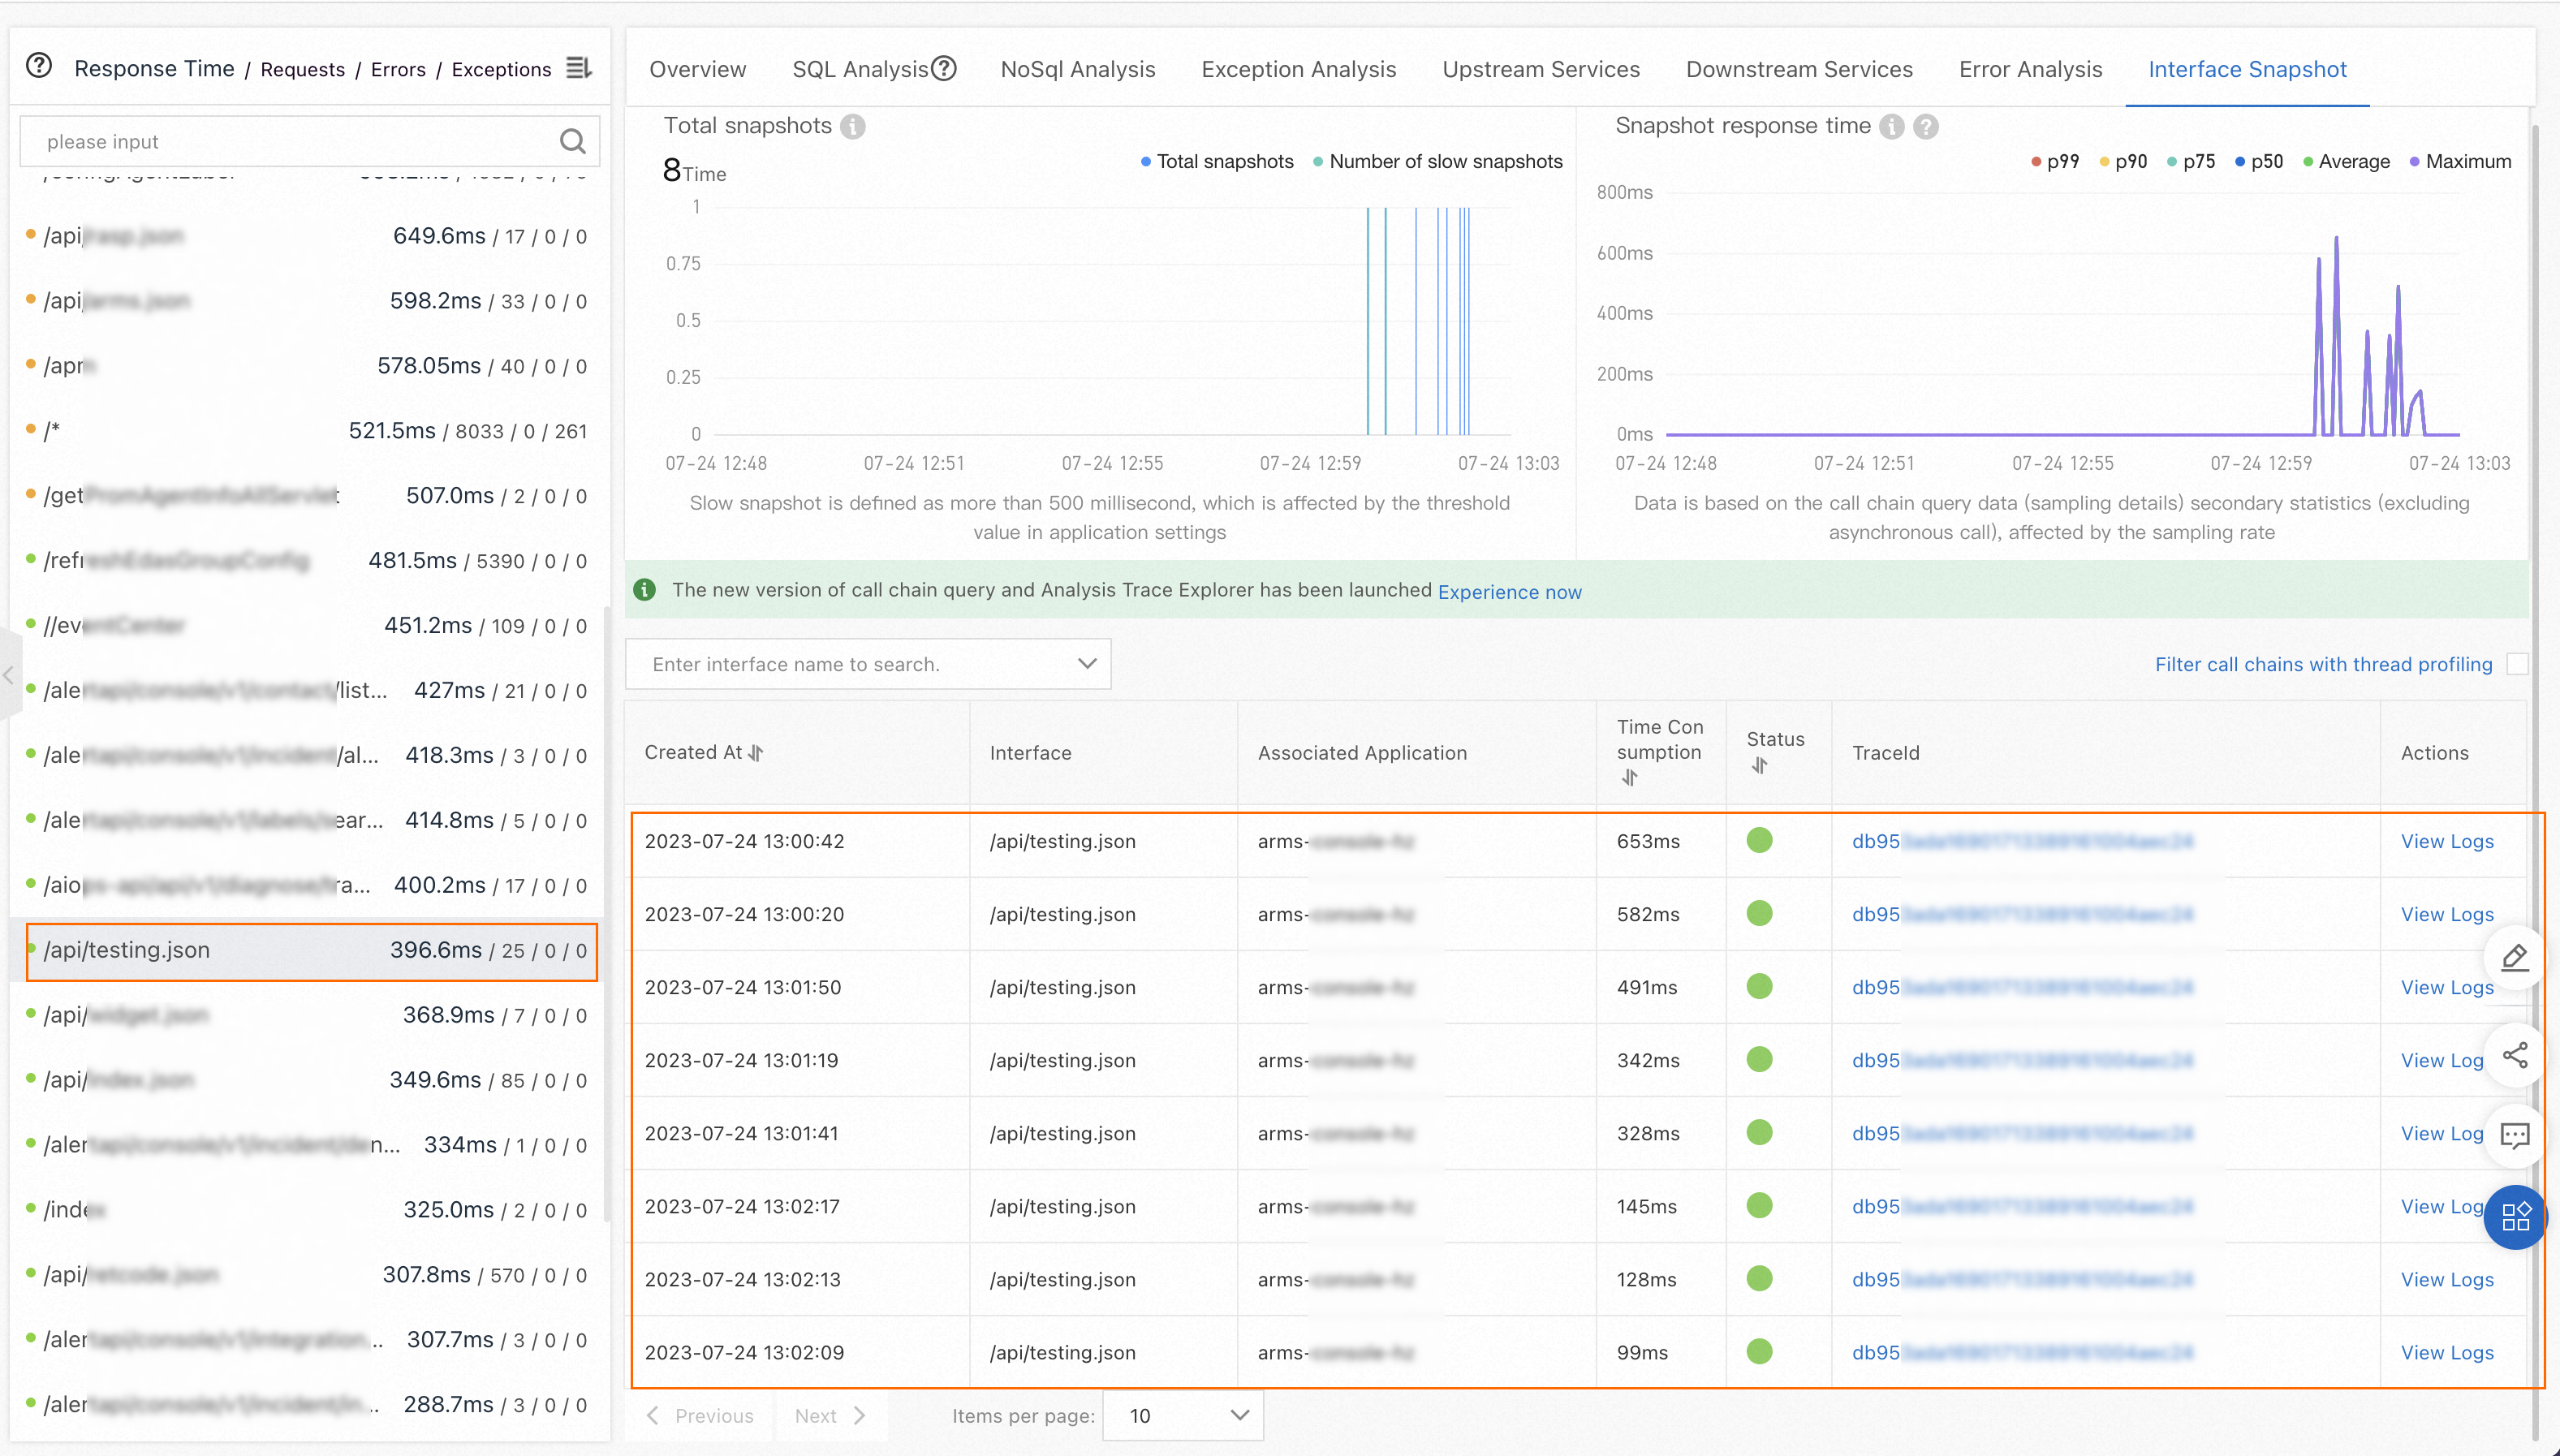
ARMS samples trace data to balance storage costs against observability. Sampling reduces the volume of stored traces while preserving visibility into errors and anomalies. By default, not every request produces a stored trace, which is why only a small number of traces may be generated even after you initiate multiple requests.
Cause
The default sampling rate is 10% -- only 1 in 10 requests generates a stored trace.
Certain trace types bypass the sampling rate and are always collected:
| Trace type | ARMS agents V3.x | ARMS agents V4.x |
|---|---|---|
| Error calls | Always collected | Always collected |
| Abnormal calls | Not collected | Always collected |
| Slow calls | Not collected | Not collected |
Solution
Increase the sampling rate in the ARMS console:
Open the Configuration page for your application.
Click the Custom Configurations tab.
In the Sampling Settings section, increase the sampling rate to capture a higher percentage of traces.
