You can create a Prometheus instance to monitor a cloud service in Prometheus Service of Application Real-Time Monitoring Service (ARMS), and then use the alert management feature of ARMS to manage alerts based on tags. This topic describes how to use the service tag key to dispatch alerts about the CPU utilization of an Elastic Compute Service (ECS) instance.
Background information
Alibaba Cloud allows you to add tags to resources. This helps you manage resources in a flexible manner. You can use tags to manage resources and allocate costs. You can add tags based on your business requirements. For example, the env:prod tag indicates that an application is deployed in a production environment, and the service:iam tag indicates that an application provides identity and access management (IAM) services. These tags allow you to manage resources in various dimensions. For example, you can use tags to query applications in the production environment or query the resource usage of IAM services.
How it works
- After you create a Prometheus instance for a cloud service, you can import tags as Prometheus metrics by using the cloud_monitor_instance_tag parameter.
- You can configure an annotation for an alert rule. The key of the annotation is _aliyun_arms_enrich_desc, and the value of the annotation is an executable PromQL statement. After an alert event is generated, ARMS executes the PromQL statement and adds the query results (tags) to the alert event.
- When you configure an annotation for an alert rule, you can use the cloud_monitor_instance_tag parameter to specify a PromQL statement. After the statement is executed, tags are added to an alert event.
Procedure
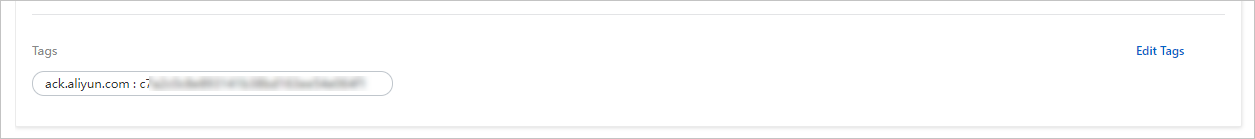
- Add a tag to an ECS instance
- Click Confirm.
- Click Confirm.
- Connect the ECS instance to Prometheus Service. For more information, see Create a Prometheus instance to monitor Alibaba Cloud services.
- Create an alert rule in Prometheus Service.
- On the Create Prometheus Alert Rule page, set Alert Name to ECS CPU Utilization Greater Than 75%, set Check Type to Custom PromQL, and set Custom PromQL Statements to
arms_cms_ecs_cpu_total > 75.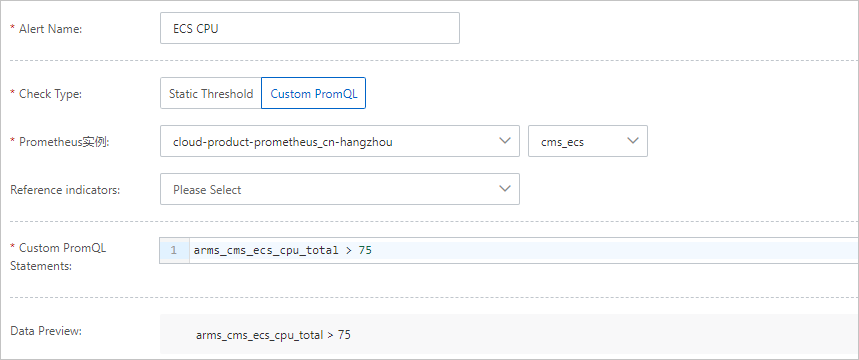
- On the Create Prometheus Alert Rule page, set Alert Name to ECS CPU Utilization Greater Than 75%, set Check Type to Custom PromQL, and set Custom PromQL Statements to
- Add a tag to an alert event. On the Create Prometheus Alert Rule page, click the arrow next to Advanced Settings and add an annotation.
Annotations are used to add tags to alert events. Prometheus Service does not support tag keys that contain periods (.). In this example, the label_replace parameter is used to rename the tag to clusterId.
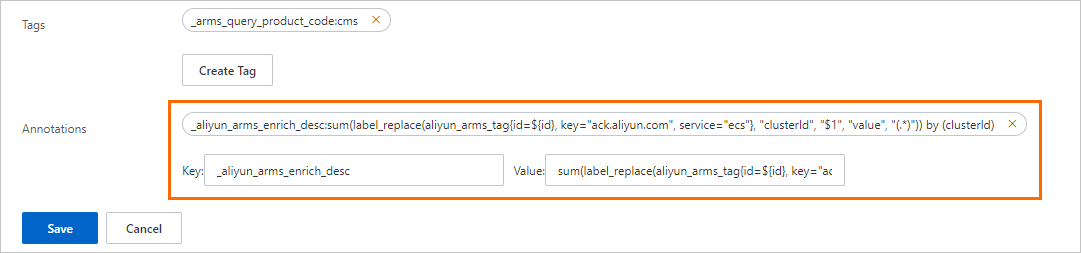 Add an annotation based on the following information:
- Key: _aliyun_arms_enrich_desc.
- Value: Specify an executable PromQL statement. You can use
${xxx}to reference the tags of alert events. In this example, the statementsum(label_replace(aliyun_arms_tag{id=${id}, key="ack.aliyun.com", service="ecs"}, "clusterId", "$1", "value", "(.*)")) by (clusterId)is used. In the statement,${id}is used to reference the ID of the ECS instance.
Important- The value of an annotation must be an executable PromQL statement.
- The query results of a PromQL statement can contain only one time series.
- All tags that are returned after a PromQL statement is executed are added to an alert event.
- Configure a notification policy. On the Notification Policies page, create a match rule and specify the condition as
clusterId: tag value. This way, alert events that meet the condition are matched. For more information, see Create and manage a notification policy.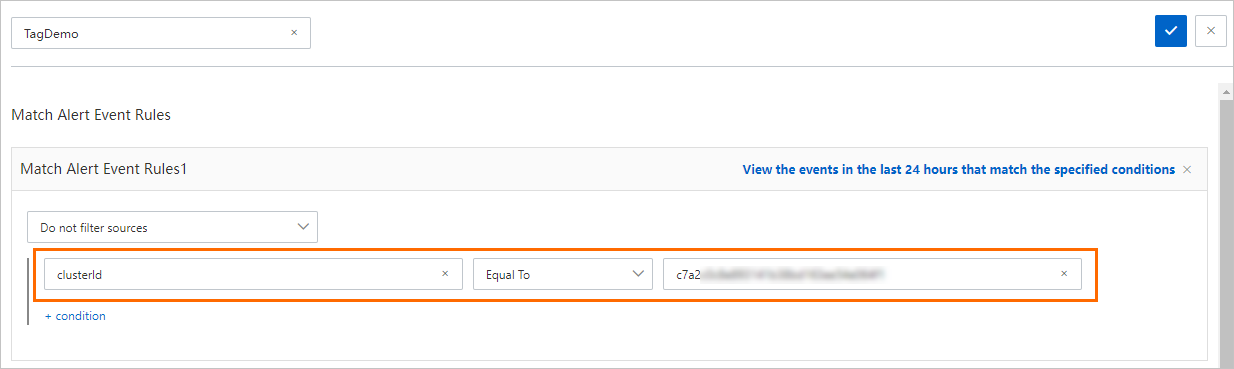
- On the Alert Sending History page, view the alerts that are sent. For more information, see View historical alerts.