When you manage alerts across multiple systems, switching between consoles to check unresolved alerts wastes time and increases the risk of missed incidents. The Prometheus AlertManager Datasource plug-in connects Grafana to the ARMS alert API through the standard Alertmanager-compatible /api/v2/alerts endpoint. After setup, you can view, filter, and monitor active, silenced, and inhibited alerts from ARMS directly in Grafana dashboards.
How it works
ARMS exposes its alert data through the Alertmanager /api/v2/alerts endpoint at https://alerts.aliyuncs.com. The Prometheus AlertManager Datasource plug-in queries this endpoint and returns alert data that Grafana renders in dashboard panels.
ARMS alert events  -->  /api/v2/alerts endpoint  -->  Grafana plug-in  -->  Dashboard panels
                       (https://alerts.aliyuncs.com)
Install the plug-in and configure the data source
This procedure walks you through four tasks: installing the plug-in, getting a JWT token for authentication, configuring the data source, and creating a dashboard panel.
Before you begin, make sure that you have:
Grafana 9.0.x or later
Install the Prometheus AlertManager Datasource plug-in
Log on to the ARMS console. In the left-side navigation pane, choose .
On the Workspace Management page, find the target workspace and click the link in the URL column to open Grafana.
NoteLog on to Grafana with the administrator account and the password that you set when you created the workspace. Alternatively, click Sign in with Alibaba Cloud to use your current Alibaba Cloud account.
In the left-side navigation pane of Grafana, choose .
Search for
Prometheus AlertManagerand install the Prometheus AlertManager Datasource plug-in.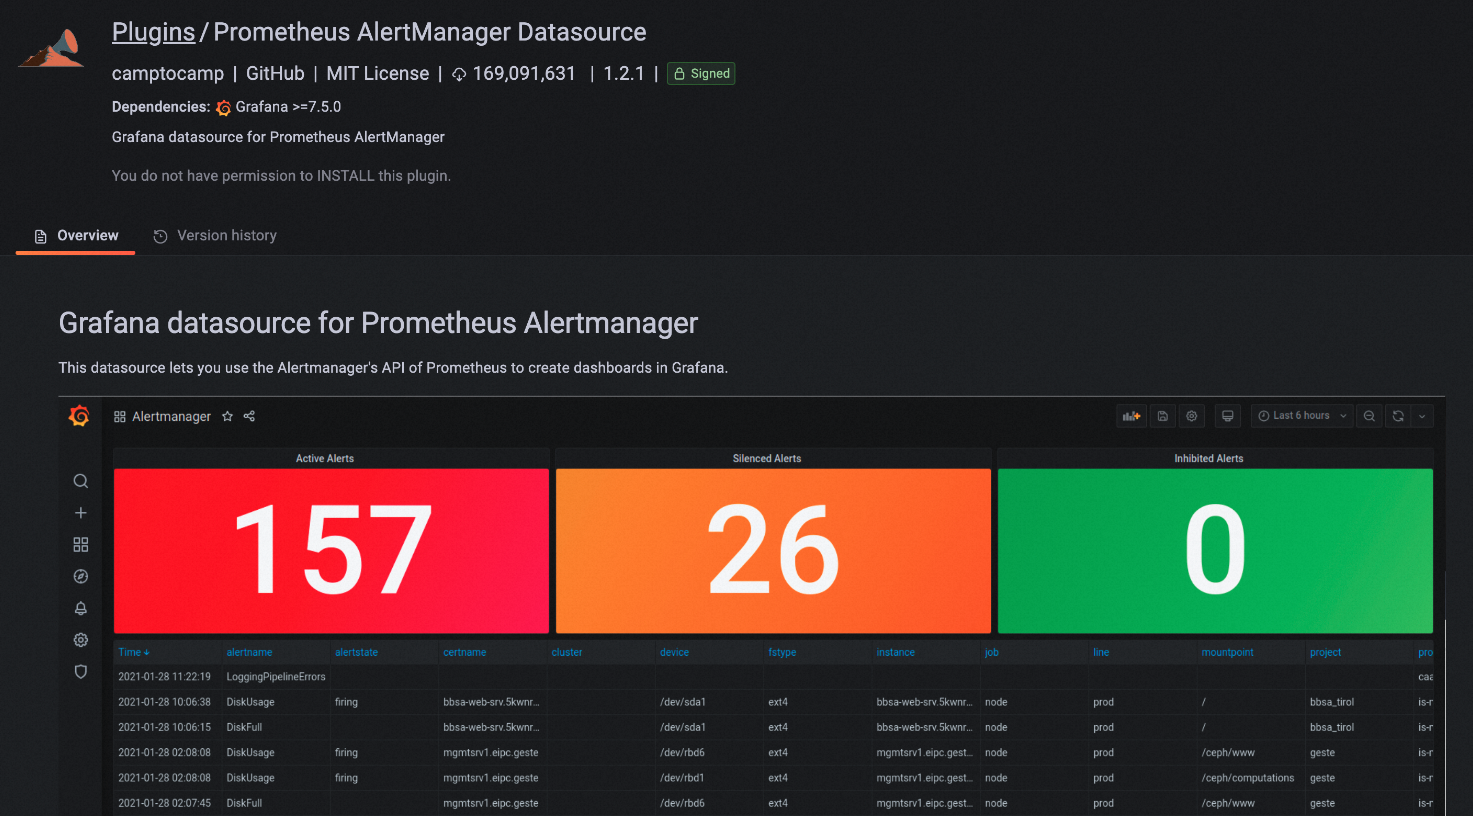
Get the JWT token
The plug-in authenticates to the ARMS alert API with a JSON Web Token (JWT). You can get this token from the ARMS console.
Log on to the ARMS console. In the left-side navigation pane, choose .
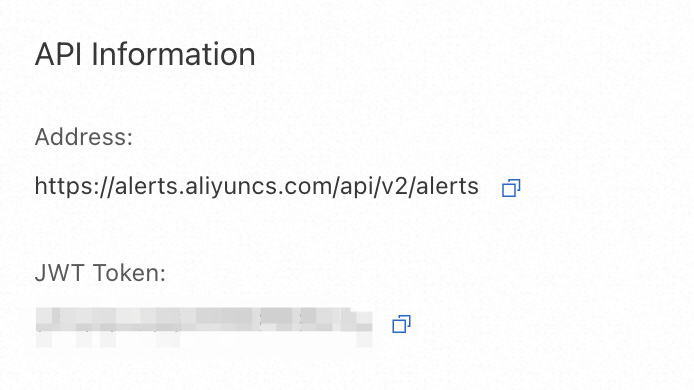
On the Alert Event Analysis page, click Obtain API Information.
In the API Information dialog box, copy the JWT token.
Configure the data source
In the left-side navigation pane of Grafana, choose .
Click Add data source and select Prometheus AlertManager.
On the Settings tab, configure the following parameters:
NoteA 403 error may appear during this step. This does not affect plug-in functionality and can be ignored.
Parameter Value Description URL https://alerts.aliyuncs.comARMS Alertmanager-compatible API endpoint. Header AuthorizationHTTP header for authentication. Click Add header to add this field. Value Bearer <your-JWT-token>JWT token obtained in the previous section, prefixed with Bearer. Example:Bearer eywokxidngkTkd****.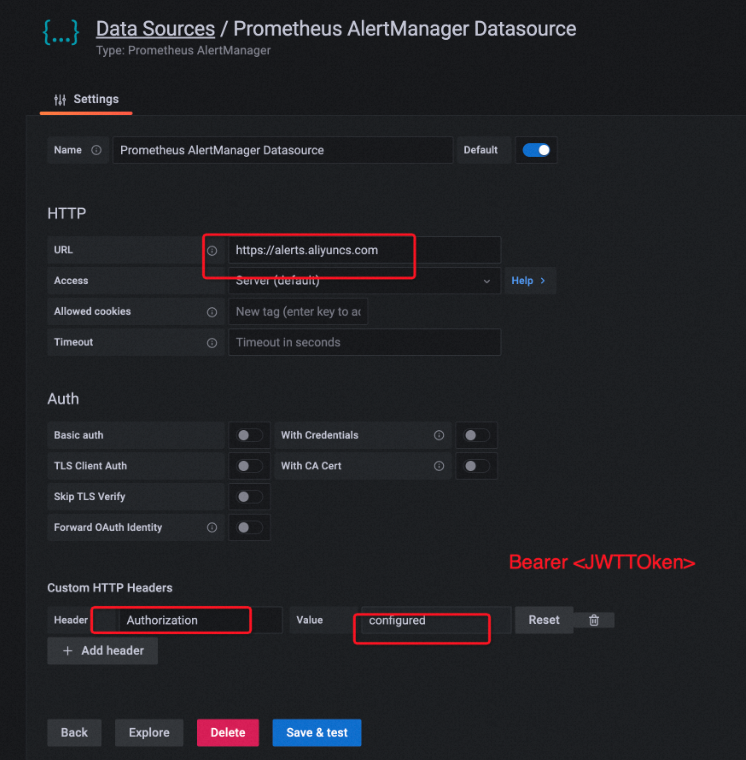
Click Save & test.
Create a dashboard panel
In the left-side navigation pane of Grafana, choose .
Click Add a new panel.
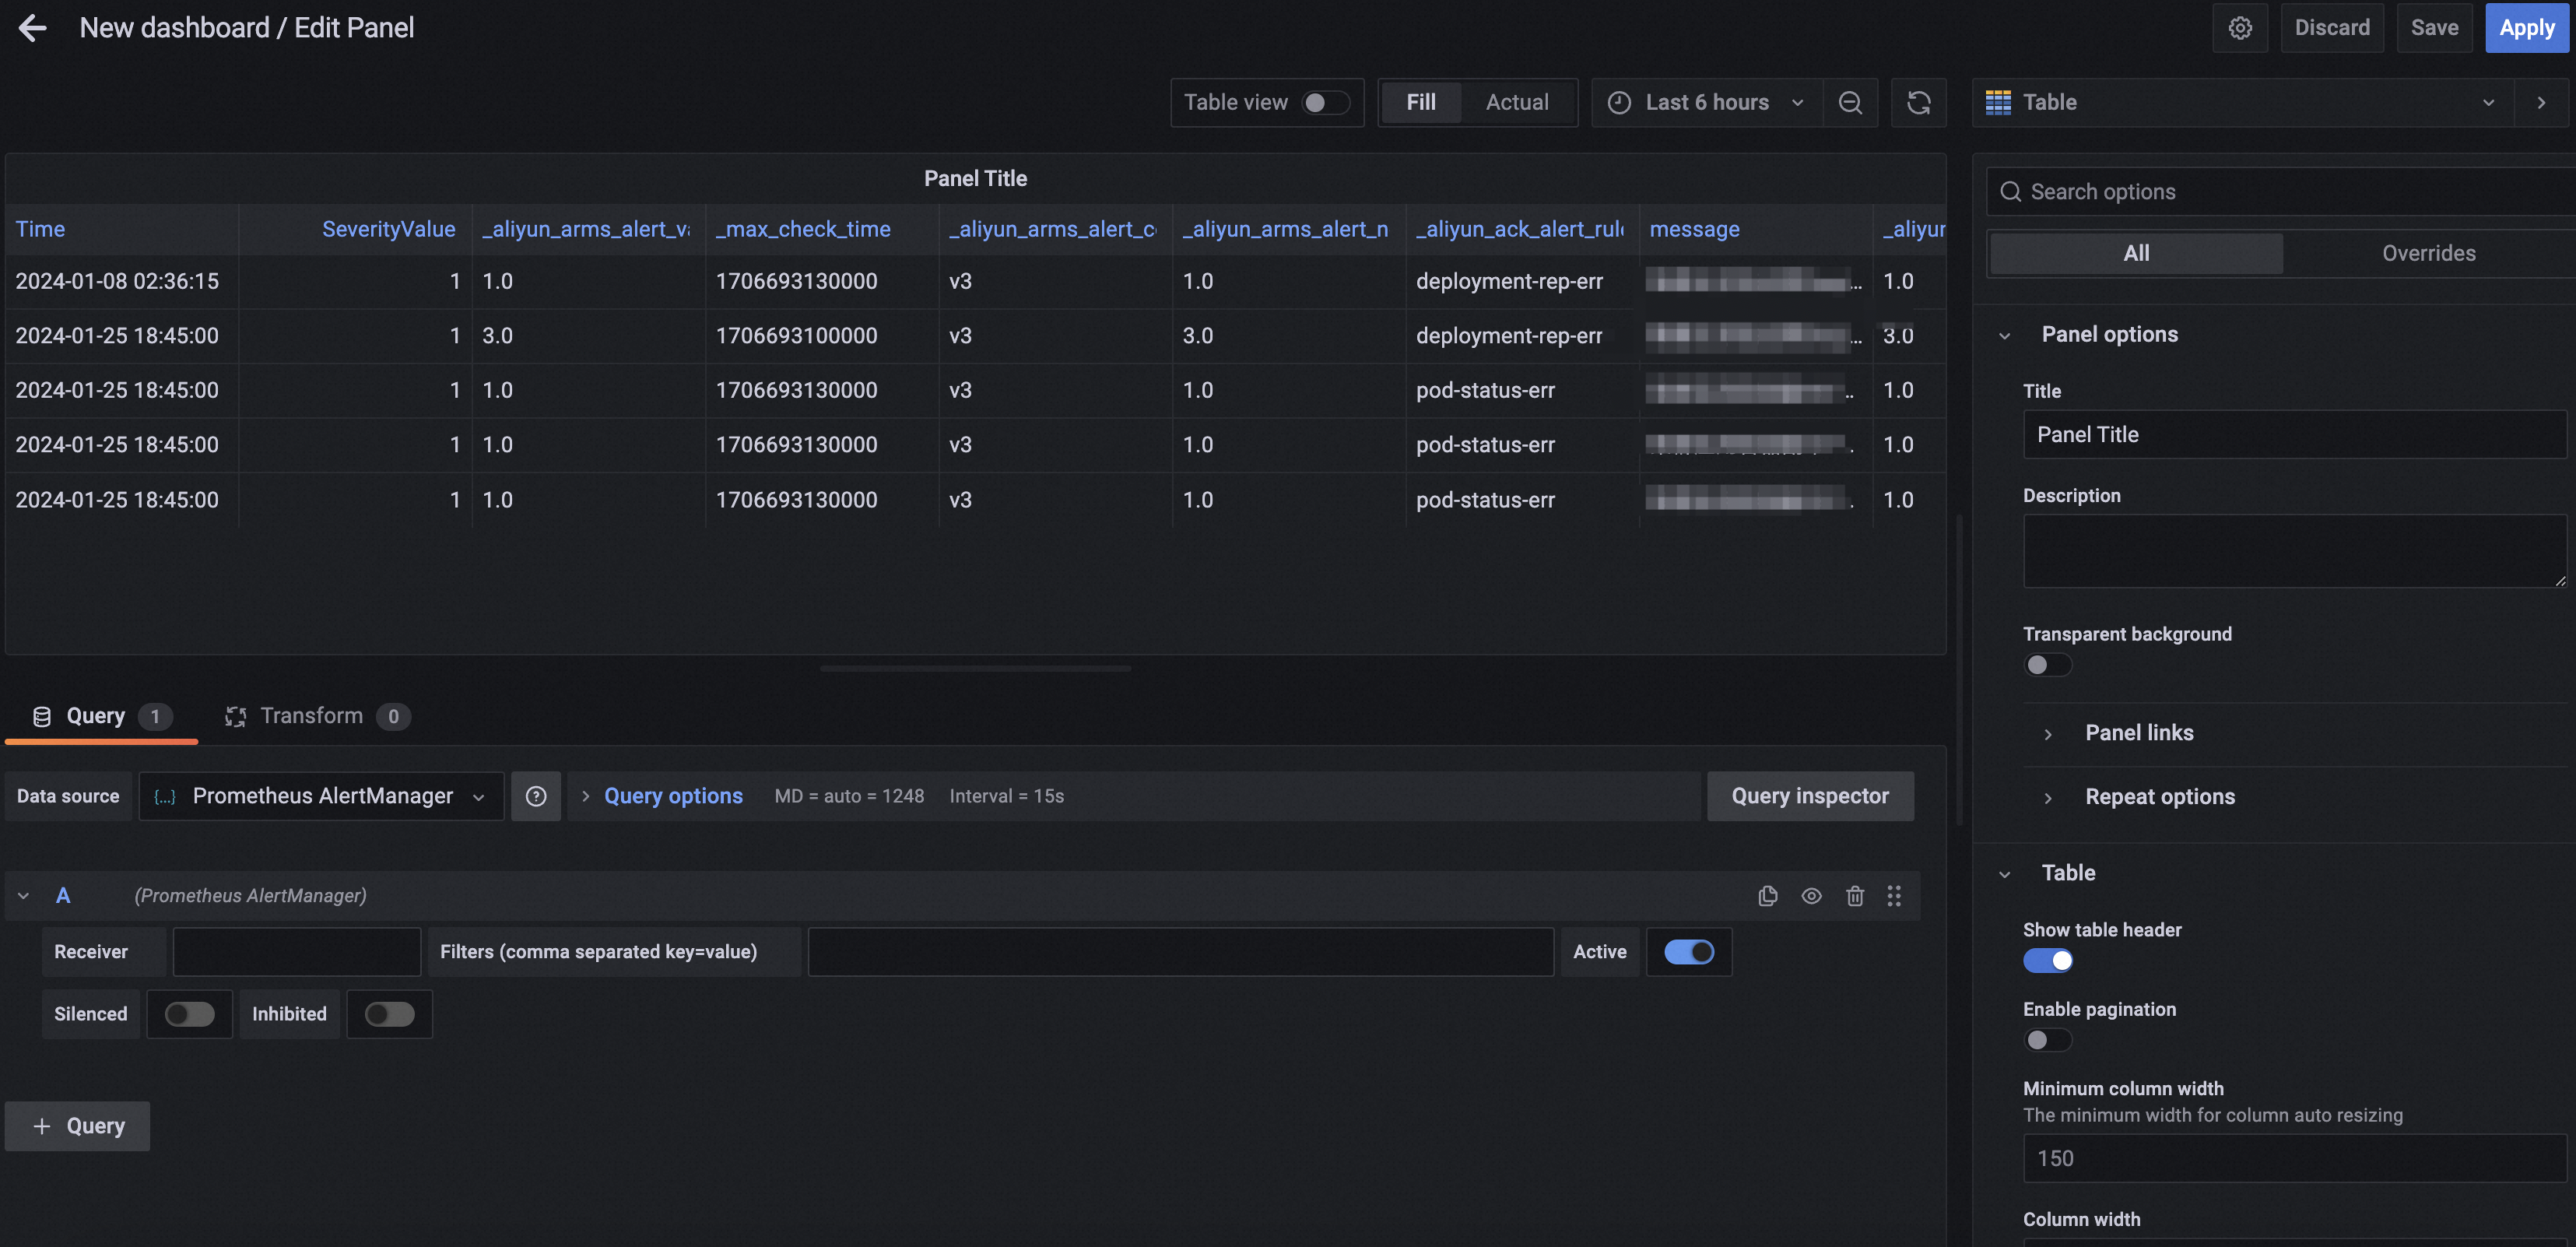
On the Edit Panel page, configure the panel:
Set Visualization to Table on the right side.
Set Data source to Prometheus AlertManager.
Click Active to load active alerts into the table.
API reference
The ARMS alert endpoint implements the Alertmanager API v2 specification:
Endpoint:
https://alerts.aliyuncs.com/api/v2/alertsSpecification: Alertmanager API v2
For advanced query options and panel configuration, see the Prometheus AlertManager Datasource plug-in documentation on GitHub.