The Global Replicator feature of ApsaraMQ for RocketMQ allows you to collect statistics on inbound messages, outbound messages, and processed messages in data synchronization tasks. You can also configure alert rules in CloudMonitor to monitor the metrics of data synchronization tasks. If a specified threshold is reached, CloudMonitor sends an alert notification to the alert contacts.
Background information
The Global Replicator feature of ApsaraMQ for RocketMQ is implemented based on EventBridge. When you add topic mappings to and enable consumer progress synchronization for a Global Replicator task, an event stream is automatically created in EventBridge in the region where the task resides.
You can view the details of various metrics related to the created event stream, including metrics that indicate the number of inbound events, the number of outbound events, the downstream response time of the event stream, and the number of processed events. You can configure alert rules to monitor the metrics of the event stream. When the configured thresholds in the rules are reached, the system automatically sends notifications to inform you of the anomalies.
View metrics
Log on to the EventBridge console. In the left-side navigation pane, click Event Streams.
In the top navigation bar, select the region where the event stream that you want to manage resides. Then, find the event stream and click its name.
In the left-side navigation pane of the page that appears, click Metric Monitoring.
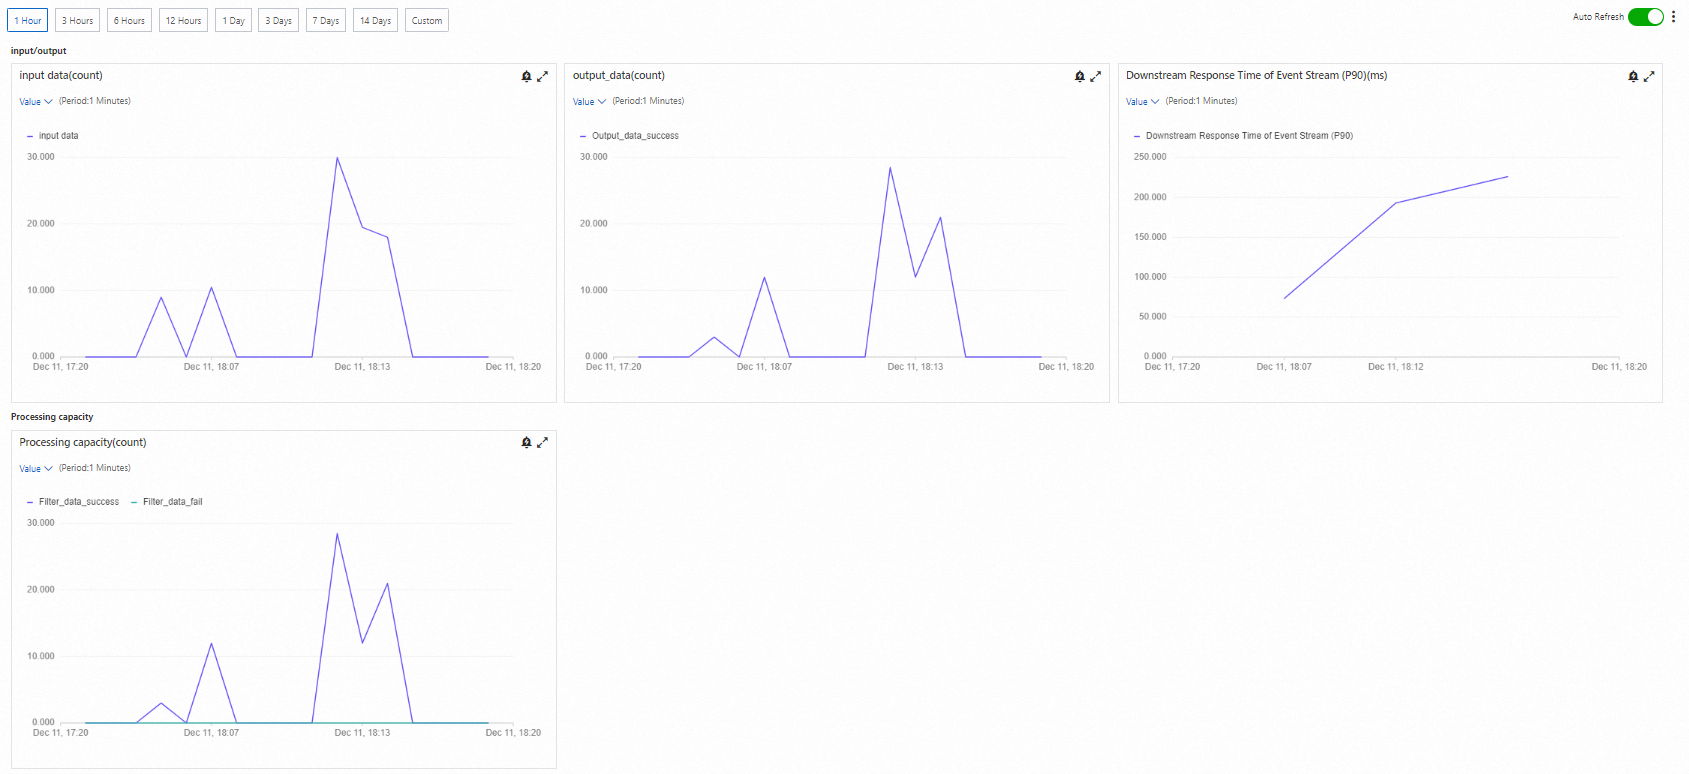
On the Metric Monitoring page, view the following monitoring metrics:
input/output
input data(count): the number of inbound events to the event stream per unit time.
output_data(count): the number of outbound events from the event stream per unit time.
Output_data_success: the number of events that are forwarded to the downstream system.
Output_data_fail: the number of events that failed to be forwarded to the downstream system.
Downstream Response Time of Event Stream: the response time required by the event target after an event is sent to the event target.
Processing capacity
Processing capacity(count): the number of events processed per unit time. This metric is used to measure the real-time processing capability of the system.
Filter_data_success: the number of matched events based on the specified conditions.
Filter_data_fail: the number of matched events based on the specified filter conditions.
 Note
NoteBy default, the EventBridge console displays metric data within the past hour. You can select a time range in the upper part of the page based on your business requirements.
You can click the
 icon to the right of a metric to zoom in the chart and view the details of the monitoring metric.
Create an alert rule
Log on to the EventBridge console. In the left-side navigation pane, click Event Streams.
In the top navigation bar, select the region where the event stream that you want to manage resides. Then, find the event stream and click its name.
In the left-side navigation pane of the page that appears, click Metric Monitoring.
In the upper-right corner of the Metric Monitoring page, click the
 icon and then click Configure Alert Rules. On the Alert Rules page in the CloudMonitor console, click Create Alert Rule.
 In the Create Alert Rule panel, configure the parameters and click Confirm. The following table describes the parameters.
Parameter
Description
Example
Product
The product for which you want to configure an alert rule. Select EventStreaming.
EventStreaming
Resource Range
The resource range. Select All Resources.
All Resources
Rule Description
Click Add Rule and select a metric type from the drop-down list.
In the Configure Rule Description panel, enter a rule name in the Alert Rule field and configure the Metric Type parameter. Valid values of the Metric Type parameter:
Simple Metric: Select a metric and configure the threshold and alert level for the metric.
Combined Metrics: Select an alert level and specify alert expressions.
NoteIf you configure multiple alert rules, you must configure the Relationship Between Metrics parameter. Valid values:
Generate alerts if all metrics meet the conditions (&&): Alerts are triggered only if the conditions specified for all configured alert rules are met.
Generate alerts if one of the conditions is met (||): Alerts are triggered if the conditions specified for one of the configured alert rules are met.
Expression: Select an alert level and then configure an alert expression.
Dynamic Threshold: For more information about dynamic thresholds, see Overview and Create dynamic threshold-triggered alert rules.
Click OK.
NoteFor information about how to specify complex alert rule expressions, see Alert rule expressions.
Rule Name: demo
Metric Type: Simple Metric
Metric: eventStreaming input events
Alert Level: Warning(Warn)
Threshold: 1000 count
Mute For
The interval at which you want CloudMonitor to resend alert notifications if the alert is not cleared. Valid values: 1 Minutes, 5 Minutes, 15 Minutes, 30 Minutes, 60 Minutes, 3 Hours, 6 Hours, 12 Hours, and 24 Hours.
If a threshold value is exceeded, CloudMonitor sends an alert notification. If the threshold value is exceeded again within the mute period, CloudMonitor does not resend an alert notification. If the alert is not cleared when the mute period elapses, CloudMonitor resends an alert notification.
15 Minutes
Effective Period
The period during which the alert rule is effective. CloudMonitor sends alert notifications based on the alert rule only within the effective period.
NoteIf an alert rule is not effective, no alert notification is sent. However, the alert record is still displayed on the Alert History tab.
Start At: 00:00
End At: 23:59
Cycle: Monday to Sunday
Tag
The tags that you want to add to the alert rule. A tag consists of a tag key and a tag value.
NoteYou can add up to six tags to an alert rule.
Tag Key: key
Tag Value: value
Alert Contact Group
The contact group to which alert notifications are sent.
The alert notifications of the application group are sent to the contacts that belong to the specified contact group. An alert contact group includes one or more alert contacts.
For information about how to create an alert contact and an alert contact group, see Create an alert contact or alert contact group.
test
Alert Callback
The callback URL that can be accessed over the Internet. CloudMonitor sends a POST request to push an alert notification to the specified callback URL. Only HTTP callbacks are supported. For information about how to configure an alert callback, see Use the alert callback feature to send notifications about threshold-triggered alerts.
To test the connectivity of an alert callback URL, perform the following steps:
Click Test next to the callback URL.
In the Webhook test panel, you can check and troubleshoot the connectivity of the alert callback URL based on the returned status code and test result details.
NoteTo obtain the details of the test result, configure the Test Template Type and Language parameters and click Test.
In the message that appears, click Close.
NoteThe parameter is in the Advanced Settings section.
http://alert.aliyun.com:8080/callback
Push Channel
Valid values:
Auto Scaling: If you turn on Auto Scaling, the specified scaling rule is triggered when an alert is generated. For information about how to create a scaling group and configure a scaling rule, see Manage scaling groups and Configure scaling rules.
Log Service: If you turn on Log Service, the alert information is written to the specified Logstore in Simple Log Service when an alert is generated. For information about how to create a project and a Logstore, see Getting Started.
Simple Message Queue (formerly MNS) - Topic: If you turn on Simple Message Queue (formerly MNS) - Topic, the alert information is written to the specified topic in Simple Message Queue (formerly MNS) when an alert is generated. For information about how to create a topic, see Create a topic.
Function Compute: If you turn on Function Compute, an alert notification is sent to Function Compute for format processing when an alert is generated. For information about how to create a service and a function, see Quickly create a function.
Auto Scaling
Method to handle alarms when no monitoring data is found
The method that is used to handle alerts when no monitoring data is found. Valid values:
Do not do anything (default)
Send alert notifications
Treated as normal
NoteYou can configure this parameter in the Advanced Settings section.
Do not do anything