This topic describes how to use log management to generate per-second metrics.
Background
The charts from Cloud Monitor display minute-level averages and cannot show per-second TPS data. For ApsaraMQ for RabbitMQ, TPS is the number of AMQP method requests clients initiate per second.
The TPS calculation includes the following AMQP methods:
-
ConnectionOpen, ChannelOpen
-
QueueDeclare, QueueDelete, QueueBind, QueueUnbind
-
ExchangeDeclare, ExchangeDelete
-
ExchangeBind, ExchangeUnBind
-
SendMessage, BasicConsume, BasicGet, BasicAck, BasicReject, BasicNack, BasicRecover
For more information about the request methods, see Request methods.
Procedure
-
Create a Metricstore to store the cleansed metric data.
-
On the Project details page in the Simple Log Service console, click . The page then displays The current Project has no Metricstore in an empty state.
-
In the Create Metricstore panel, configure the Metricstore's basic information. Key parameters include Name (the Metricstore name) and data retention period (30 days by default).
-
-
Create a data transformation job.
-
In the logstore, enter a query statement. This example queries instance error codes.
* | SELECT Code, count(*) as num, microtime / 1000 / 1000 as timeSecond group by Code, timeSecond limit 1000000The statement format is:
Search statement | Analytic statement. The search statement filters the data, and the analytic statement is a standard SQL query. Writing data to a Metricstore requires extracting three components from the query results: the required labels, the metric values for each label, and the timestamp. In this example,Codeis the label for the error code,numis the metric value for each code, andtimeSecondis the timestamp in seconds.The query returns a table with three columns: Code (error code), num (count), and timeSecond (per-second timestamp).
-
In the query results, click the Graph tab, and then click Save as Scheduled SQL Job. On the Compute Settings tab, configure the parameters, and then click Next. For SQL Type, select Search & Analysis. For Write Mode, select Import New Data. Configure the Write Column Mapping based on the fields in your SQL query.
NoteThe destination store must be the Metricstore that you created in the previous step.
-
On the Scheduling Settings tab, set the scheduling interval, and then click OK. You can set the scheduling interval to hourly or a custom interval. The default SQL Timeout is 600 seconds, and the default Execution Delay is 60 seconds.
-
-
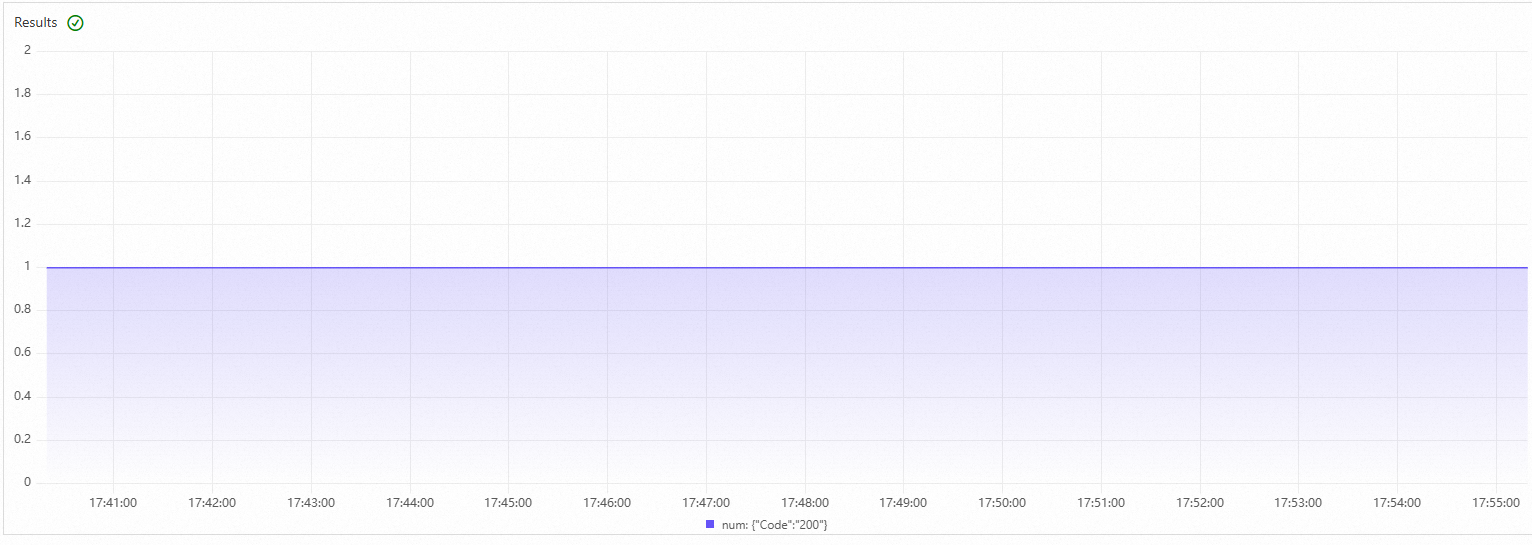
Query the metric value distribution in the Metricstore. In the left-side navigation pane, select the destination Metricstore, go to the query page, and run a query.
A sample query result is as follows:
-
Optional: Connect the data in the Metricstore to a visualization dashboard. You can use Grafana or the visualization features of Simple Log Service.
-
To connect to a Grafana dashboard, see Connect time-series data to Grafana.
-
To use the visualization dashboard feature of Simple Log Service, see Visualization.
-
The preceding tutorial uses instance error code data as an example. You can also cleanse other types of data, such as the message send and receive rate for each channel on each RemoteAddress, the per-second activity of each queue, the total number of messages sent and received per second, and the per-second call count of each API.