When message accumulation, data skew, or throttling occurs on an ApsaraMQ for Kafka instance, use consumer details to identify the root cause. Consumer details show per-partition offsets, connected clients, and accumulated message counts for each topic-group pair -- the data points you need to pinpoint stuck or slow consumers before they affect your application.
Before you begin
Limit each consumer group to three or fewer topic subscriptions to reduce the risk of message accumulation.
If your consumers use
assignmode (manual partition assignment), commit offsets promptly. Uncommitted offsets cause consumed messages to appear as accumulated in the console, even though the client has already processed them.If a large number of messages are accumulated, compare the consumption rate against the production rate. If the consumption rate is lower, increase consumption capacity. See Scale up consumers.
View consumer groups that subscribe to a topic
Start from the Topics page to see which consumer groups subscribe to a specific topic and drill into per-partition details.
Log on to the ApsaraMQ for Kafka console. In the Resource Distribution section of the Overview page, select the region where the instance resides.
On the Instances page, click the instance name.
In the left-side navigation pane, click Topics.
On the Topics page, click the topic name.
On the Topic Details page, click the Subscriptions tab. All consumer groups that subscribe to this topic are listed in the Online groups that subscribe to the topic section.
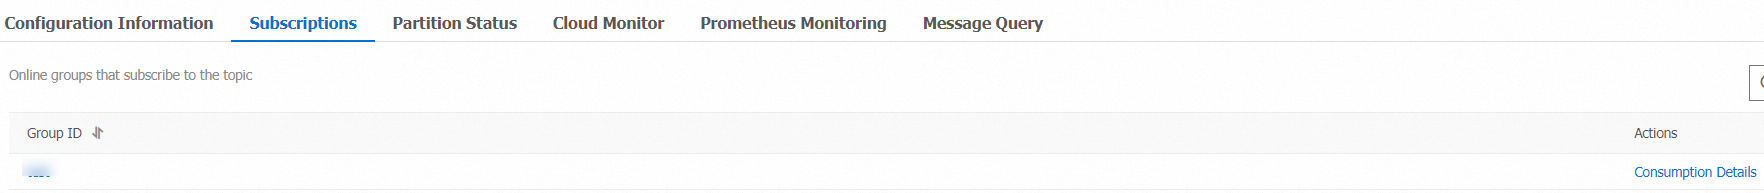
Find the group and click Consumer Details in the Actions column. The Consumer Details page displays per-partition metrics for this group. See Consumer detail fields for field descriptions.

View topics that a consumer group subscribes to
Start from the Groups page to see all topics a consumer group subscribes to and the accumulated message count for each topic.
On the Instances page, click the instance name.
In the left-side navigation pane, click Groups.
On the Groups page, click the group ID.
On the Group Details page, click the Consumer Status tab. All topics that this group subscribes to are listed, along with the accumulated message count for each topic.
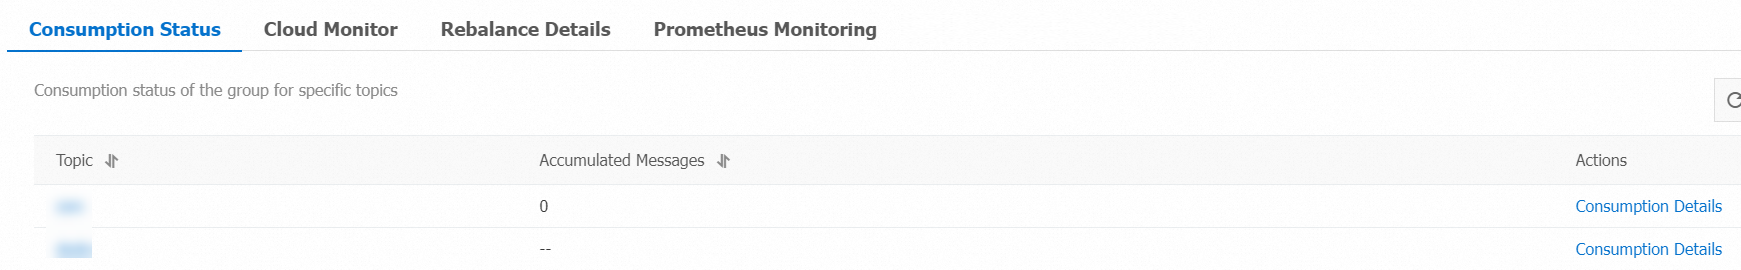
Find the topic and click Consumer Details in the Actions column. The Consumer Details page displays per-partition metrics for this group-topic pair. See Consumer detail fields for field descriptions.
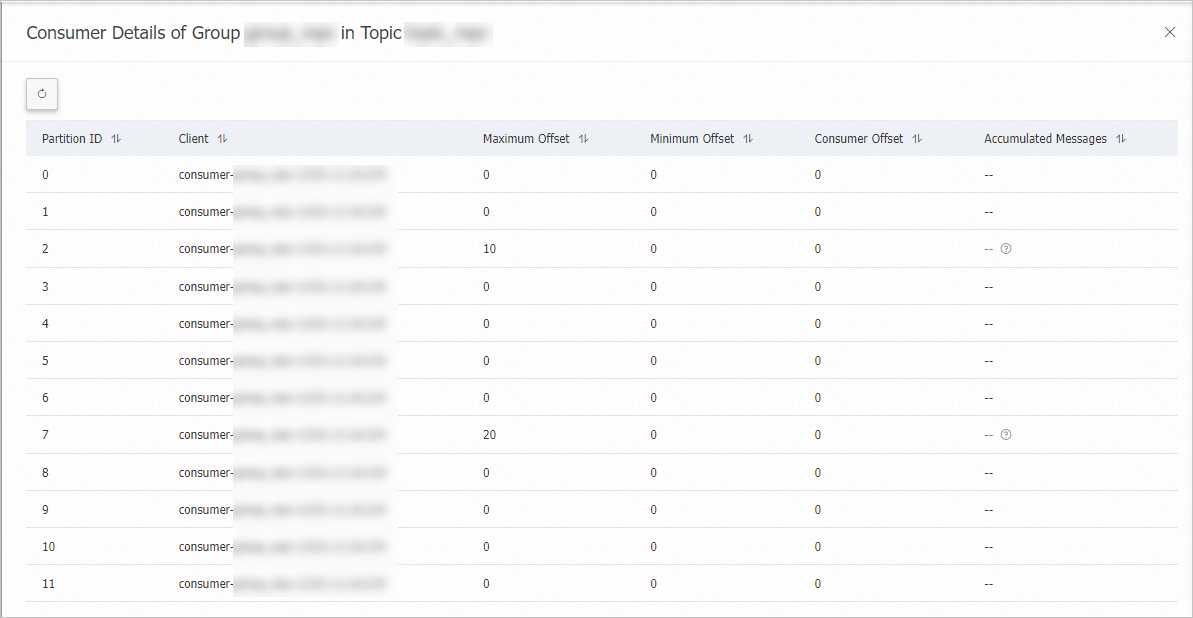
Consumer detail fields
| Field | Description |
|---|---|
| Partition ID | The ID of the partition. |
| Client | The connected consumer's identifier, in the format <Client ID>_/<IP address>. Disconnected consumers do not appear in this column. |
| Maximum Offset | The highest offset available for consumption in this partition. |
| Consumer Offset | The offset up to which the consumer group has committed consumption in this partition. |
| Messages Accumulated | The number of unconsumed messages in this partition, calculated as Maximum Offset minus Consumer Offset. A sustained increase in this value typically indicates that consumers are blocked or that the consumption rate is lower than the production rate. For remediation options, see Reset consumer offsets. |
Interpret message accumulation
Not all message accumulation indicates a problem. Use the following patterns to determine whether action is required:
| What you see | What it means | Action |
|---|---|---|
| Accumulated messages fluctuate within a stable range, and the latest consumption time is close to the current time. | Normal operation. The consumer group is actively pulling new messages. | No action required. |
| Accumulated messages steadily increase, and the consumer offset stays unchanged. | The consumer thread is blocked. The client has stopped consuming messages and is no longer committing offsets. | Investigate the consumer application for blocked threads or deadlocks. |
| Accumulated messages steadily increase, but consumer offsets are still being committed. | The consumer group is processing messages, but the consumption rate is lower than the production rate. | Increase consumption capacity. See Scale up consumers. |
Scale up consumers
If message accumulation occurs because the consumption rate is lower than the production rate, increase consumption capacity with one of the following approaches:
Add more consumers. Add consumer instances within a process (one thread per consumer) or deploy additional consumer processes. Keep the total number of consumers at or below the number of partitions -- consumers beyond that count remain idle.
Increase consumption threads per consumer. For implementation details, see Increase consumption rate.
FAQ
Why does the console show accumulated messages even though my application is consuming normally?
This typically happens when your application uses assign mode for manual partition assignment. In assign mode, you manage offsets yourself. If offsets are not committed back to the broker, the console reports messages as accumulated even though the client has already processed them. Commit offsets promptly to resolve the discrepancy.
Does message accumulation always indicate a problem?
No. If the accumulated message count fluctuates within a predictable range and the latest consumption time is close to the current time, the consumer group is healthy and actively pulling messages.
Accumulation signals a problem only when the count grows steadily over time. Two common causes: consumer threads are blocked (offsets stop advancing), or the consumption rate cannot keep up with the production rate (offsets advance but the gap grows).
Related information
GetConsumerProgress -- Retrieve consumer details programmatically.
Reset consumer offsets -- Skip accumulated messages by resetting the consumer offset to a specific position.
What do I do if messages are accumulated? -- End-to-end troubleshooting guide for message accumulation.