Why does my instance not report monitoring data?
ApsaraMQ for Kafka clusters deployed before November 2018 do not report monitoring and alert data. The console displays monitoring controls, but the underlying cluster does not send data to the monitoring system.
To fix this, upgrade your instance. After the upgrade, the cluster begins reporting monitoring and alert data. For steps, see Upgrade the versions of instances.
Why does the alert status show "No data"?
The most likely cause is an outdated minor version. Older minor versions may not report certain metrics to CloudMonitor, which prevents alert rules from evaluating.
If the minor version is already up to date and the Status still shows No data, contact Alibaba Cloud technical support.
Verify and update the minor version
Log on to the ApsaraMQ for Kafka console.
In the Resource Distribution section of the Overview page, select the region where your instance resides.
On the Instances page, click the name of the instance.
On the Instance Details page, click the Instance Information tab.
In the Basic Information section, check whether Minor Version Update is available next to the Minor Version field.
If an update is available, click Minor Version Update.
In the panel that appears:
Read the Read Before Upgrade section.
Enter your name in the Emergency Contact field.
Enter your phone number in the Emergency Contact Number field.
Enter the upgrade time in the Started At field.
Click OK.
After the minor version update completes, the Status column in the Alert Rules Associated with Resource panel changes from No data to a valid state such as OK or Alert.
Why can't a RAM user view monitoring data?
The RAM user does not have the required CloudMonitor permissions. Attach the AliyunCloudMonitorReadOnlyAccess system policy to the RAM user through the RAM console.
Log on to the RAM console with your Alibaba Cloud account.
Attach the
AliyunCloudMonitorReadOnlyAccesspolicy to the target RAM user.
After the policy is attached, the RAM user can view monitoring data. For detailed steps, see Grant permissions to RAM users.
Can I log on to an ApsaraMQ for Kafka instance?
No. ApsaraMQ for Kafka is a fully managed service. The ApsaraMQ for Kafka team operates and maintains the underlying infrastructure on your behalf, so direct instance access is neither required nor supported.
To observe cluster health, use the monitoring and alerting feature in the console. It provides the cluster information you need without instance-level access.
How do I monitor open-source Apache Kafka?
For open-source Apache Kafka monitoring, see the following resources:
Why do message accumulation alerts persist after deleting a Group?
Deleting a Group does not remove the consumer offsets stored on the server. The alerting system monitors these offsets, so alerts continue as long as the offsets exist.
This happens for two reasons:
Offsets persist after deletion. In server-side versions earlier than 2.2.0 (based on Apache Kafka 0.10.2), the Kafka API does not support deleting consumer offsets. Deleting a Group only removes it from the console. The underlying offset data remains on the server.
Consumer threads are still active. Even after a Group is deleted, consumer threads may continue running if they were not explicitly stopped. These threads keep committing offsets, which triggers accumulation alerts.
Before you begin
Stop all consumer threads in the Group before attempting any of the following solutions. An active consumer thread is one that subscribes to messages by using the subscribe method. If any thread is still committing offsets, the alerts persist regardless of other actions.
Reset consumer offsets (recommended)
This approach works on all server-side versions and is the fastest way to stop the alerts.
Make sure the Group exists in the console. If you already deleted it, recreate it.
Disconnect all consumer threads.
In the ApsaraMQ for Kafka console, reset the consumer offset to 0 for the partitions where you want to stop tracking message accumulation. For steps, see Reset consumer offsets.
The alerting system stops tracking accumulation for those partitions after the reset.
Delete the Group directly (server-side version 2.2.0 or later)
If your instance runs server-side version 2.2.0 or later and the Group has no active consumer threads, delete the Group directly. The server removes both the Group and its consumer offsets.
If alerts continue after deletion, verify that no consumer threads are still committing offsets.
Wait for offsets to expire (server-side versions earlier than 2.2.0)
On older server-side versions, consumer offsets are automatically cleared after the configured consumer offset retention period expires, provided that no consumer thread updates them. To check or adjust the retention period, see Modify message configurations.
Upgrade the server-side version (server-side versions earlier than 2.2.0)
If the Group has no active consumer threads, upgrade the server-side version to 2.2.0 or later. After the upgrade, recreate the Group and delete it to remove the offsets. For steps, see Upgrade instance versions.
Disable message accumulation alerts
If none of the preceding solutions resolve the issue, disable the alert rule for message accumulation in CloudMonitor. For details, see CloudMonitor.
In server-side versions 2.2.0 and later, consumer offsets are not deleted as long as the Group has at least one active consumer thread, even if the offsets exceed the consumer offset retention period. For more information, see Why are consumer offsets not deleted after they expire?
Related topics
Why does the alert show a different accumulation number than the console?
The alert system and the console calculate message accumulation differently. A small discrepancy is expected and does not indicate a problem.
Both use the same per-partition formula:
Accumulated messages = Maximum offset - Consumer offsetThe total is the sum across all partitions. The discrepancy comes from when each method fetches the offsets.
How each method calculates accumulation
Console (Group Details page)
The Group Details page fetches the consumer offset and maximum offset for each partition in separate, back-to-back remote procedure call (RPC) requests. Because the time gap between these two requests is small, the result closely reflects actual accumulation at that moment.
Alert system
The alert system monitors all consumer groups and topics on an instance simultaneously. To reduce overhead, it batches offset requests: one RPC request fetches consumer offsets for all consumer groups, then another fetches maximum offsets for all partitions across all subscribed topics. This reduces the total number of RPC requests from m x n x number of brokers to just number of brokers, where m is the number of consumer groups and n is the number of topics.
The tradeoff is a timing gap. Producers keep sending messages between the two batch requests, so the maximum offsets increase while the consumer offsets stay fixed. This inflates the calculated accumulation.
Example: Suppose a partition has a consumer offset of 1,000 and a maximum offset of 1,050 when the first batch request runs. By the time the second batch request fetches the maximum offset 200 ms later, producers have written 30 more messages, pushing the maximum offset to 1,080. The alert reports 80 accumulated messages (1,080 - 1,000), while the console would report closer to 50 (1,050 - 1,000).
When expired messages cause larger discrepancies
If the consumption rate is very slow and disk usage is high, the instance may delete messages before consumers process them. In this situation, consumer offsets for some partitions fall below the minimum offset of the partition.
ApsaraMQ for Kafka and open-source Apache Kafka handle expired-message partitions differently:
| Behavior | Apache Kafka | ApsaraMQ for Kafka |
|---|---|---|
| Alert calculation | Ignores partitions where consumer offset < minimum offset | Includes these partitions in the alert total |
| Console display | N/A | Excludes these partitions from the Group Details total |
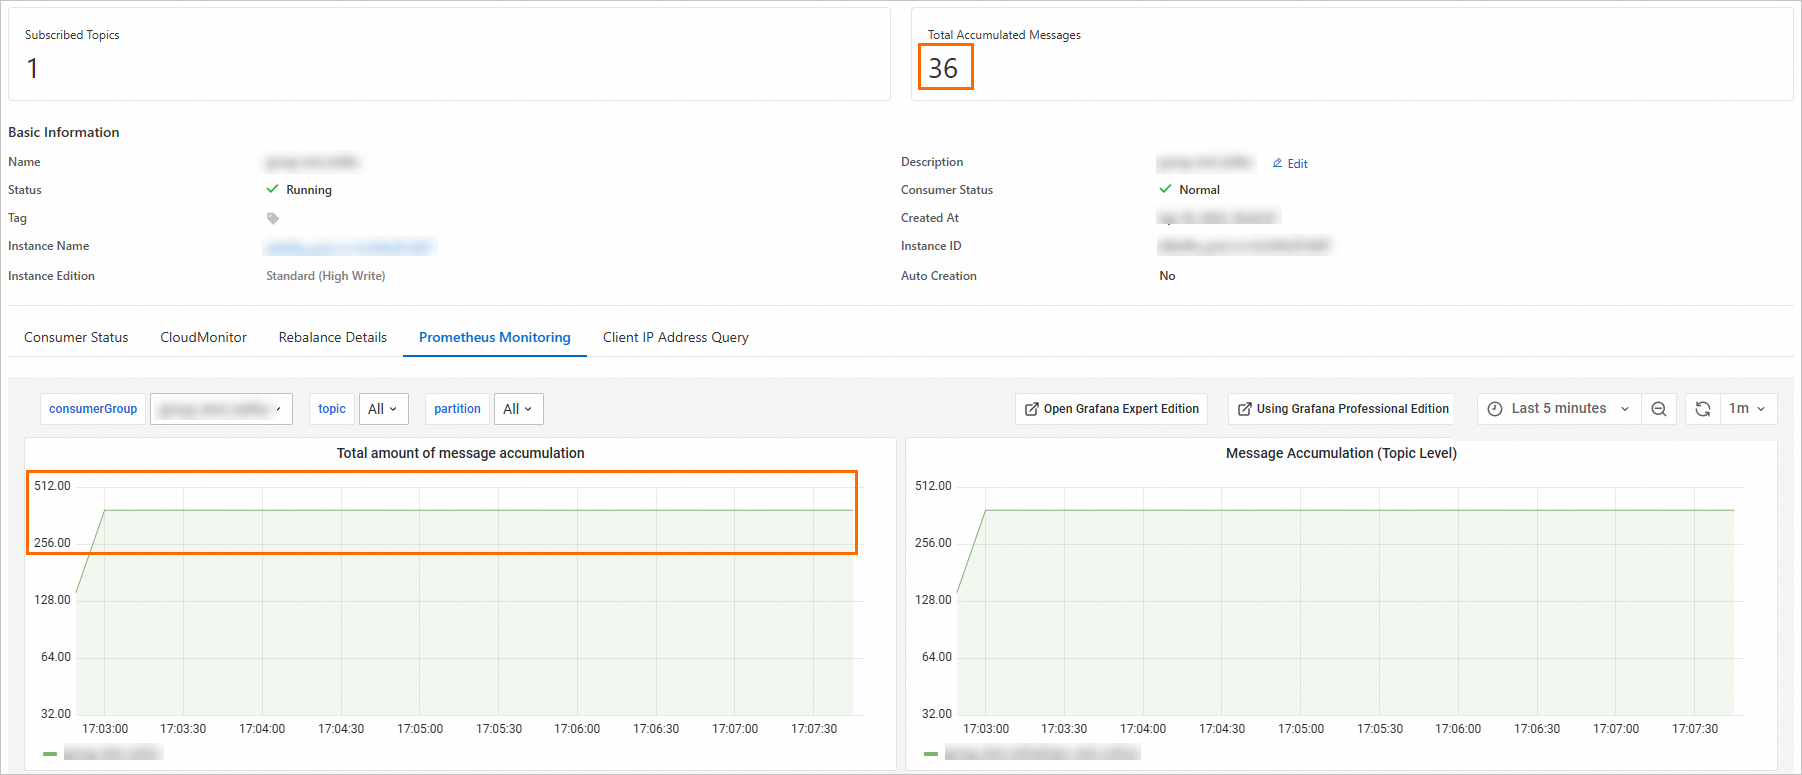
Because the console excludes these abnormal partitions but the alert includes them, the alert value is larger than what the console shows. The following screenshots demonstrate this behavior.
Console and alert show different totals:
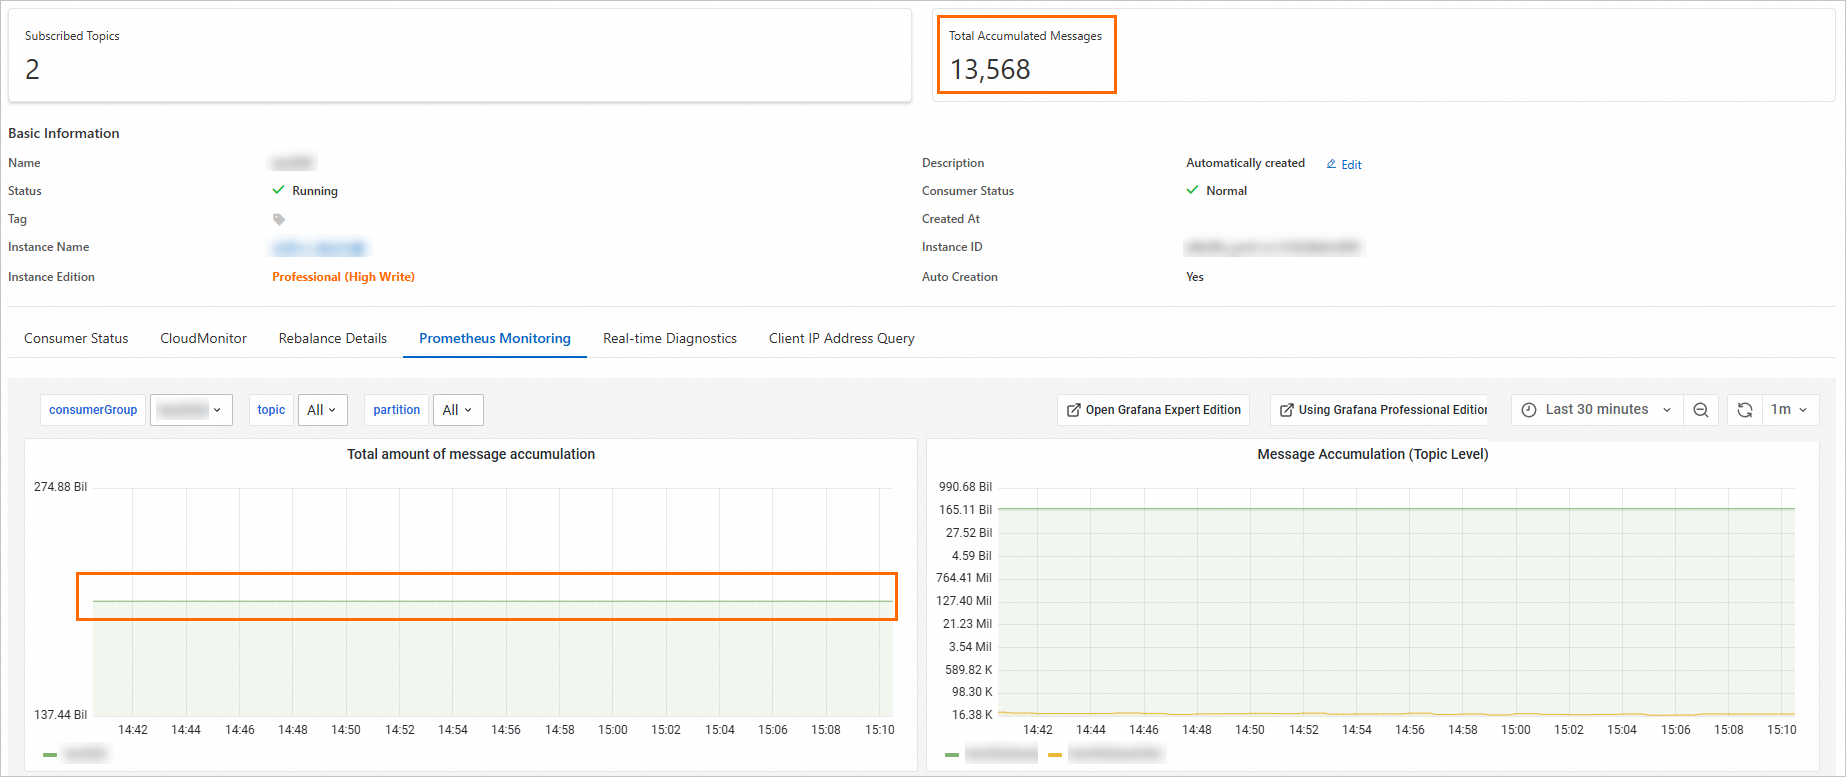
Console total excludes abnormal topics:
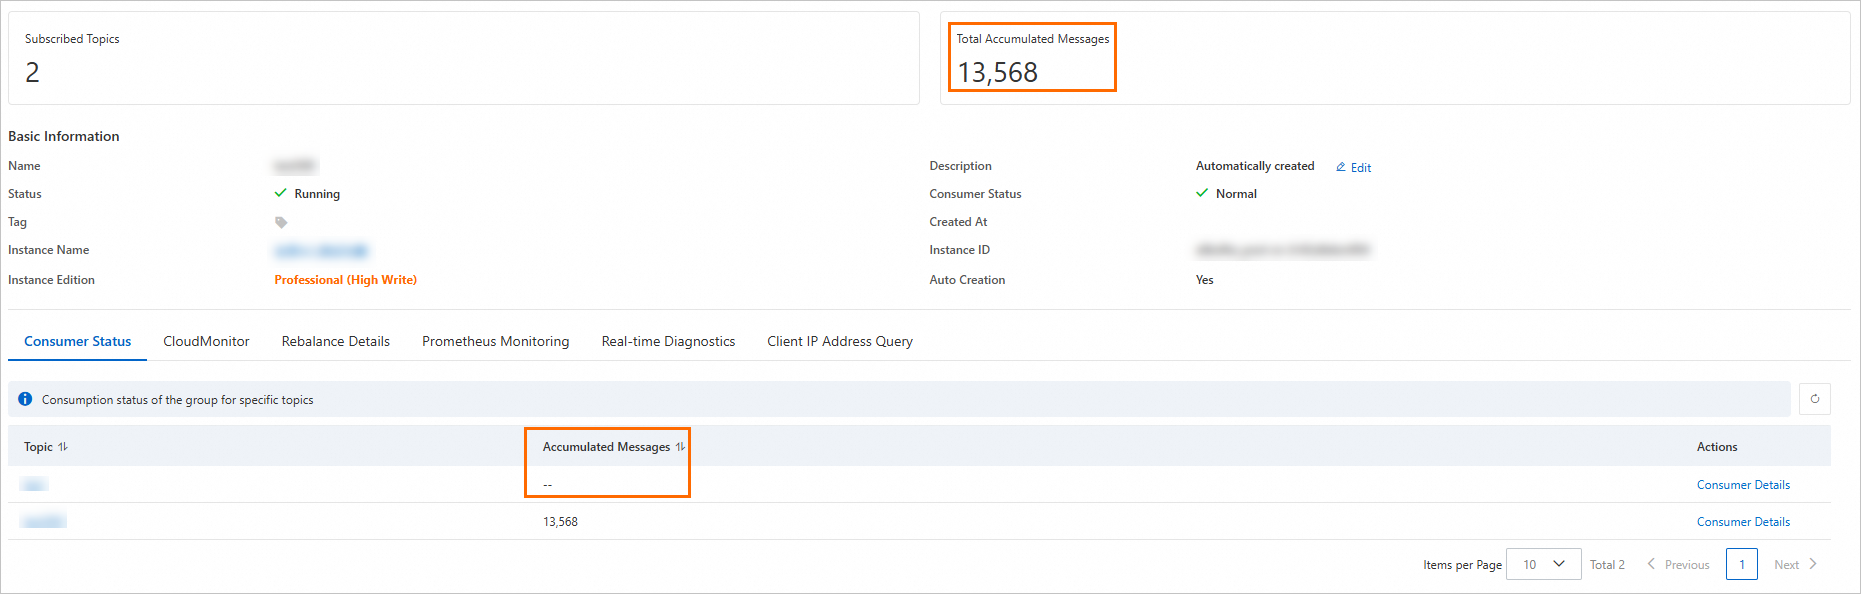
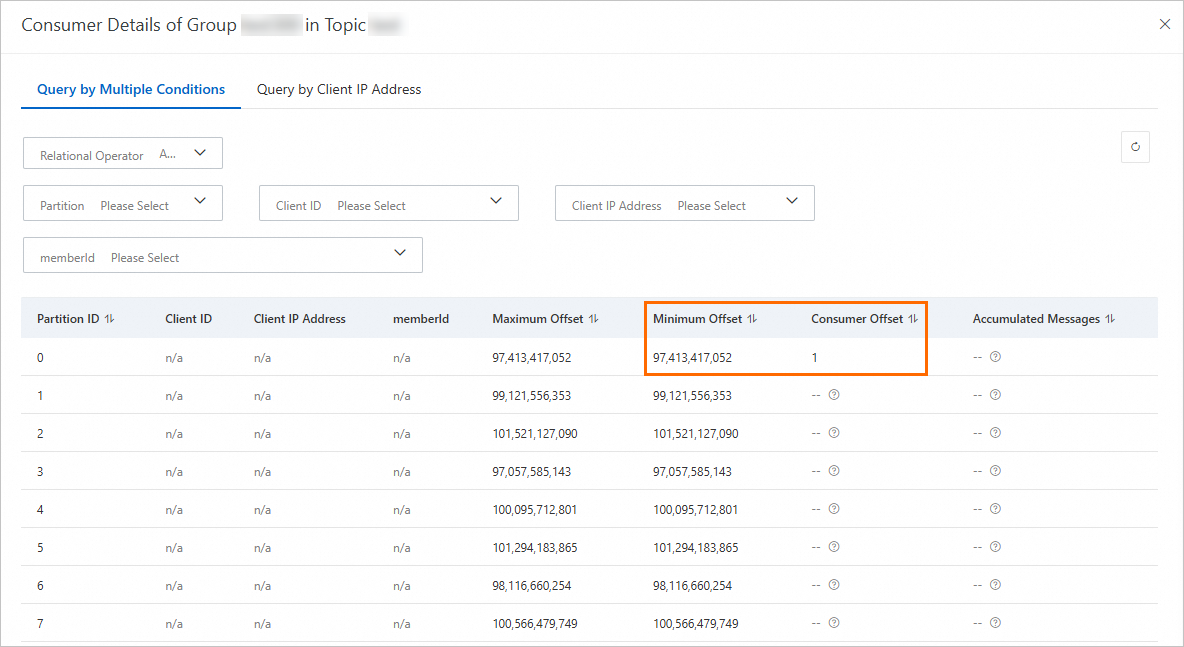
Console total excludes partitions where the consumer offset is below the minimum offset:
Which number to trust
For point-in-time accuracy, use the Group Details page in the console. It fetches offsets per partition with minimal timing gap.
For trend monitoring across many consumer groups, use the alert value. It is optimized for scale, not precision.
A small discrepancy between the two is normal. Investigate only if the gap is consistently large or growing.
Suppress unwanted accumulation alerts
Ignore alerts for specific topics: Reset consumer offsets to 0 for the consumer group in the ApsaraMQ for Kafka console. The alert system stops reporting accumulation for those topics.
Disable accumulation alerts entirely: Submit a ticket to temporarily turn off the message accumulation alert feature.
Metrics FAQ
Which metrics should I monitor?
Focus on the following metrics based on your instance type.
Reserved instances
| Metric | What it tracks | Why it matters |
|---|---|---|
instance_disk_capacity(%) | Disk usage across the instance | High disk usage can cause message production failures. Monitor this to avoid running out of storage. |
InstanceInternetRxUtilizationByNode(%) | Inbound internet bandwidth utilization per node | Sustained high values indicate a node is approaching its bandwidth limit, which can cause message delays. |
InstanceInternetTxUtilizationByNode(%) | Outbound internet bandwidth utilization per node | Sustained high values indicate a node is approaching its bandwidth limit, which can slow consumer throughput. |
Proportion of Production Traffic in Instance Type(%) | Producer throughput relative to the instance spec limit | Values approaching 100% mean production throughput is near the ceiling for the instance specification. |
Proportion of Consumption Traffic in Instance Type(%) | Consumer throughput relative to the instance spec limit | Values approaching 100% mean consumption throughput is near the ceiling for the instance specification. |
Proportion of Partitions in Instance Type(%) | Partition count relative to the instance spec limit | Values approaching 100% mean you need to upgrade the instance specification or reduce partitions. |
Serverless instances
| Metric | What it tracks | Why it matters |
|---|---|---|
InstanceMessageInputRatioV3(%) | Message input rate as a percentage of capacity | Tracks how close instance-wide message production is to the capacity limit. |
InstanceMessageOutputRatioV3(%) | Message output rate as a percentage of capacity | Tracks how close instance-wide message consumption is to the capacity limit. |
InstanceMaxNodeInputRatioV3(%) | Peak input rate on the busiest node | Identifies hot nodes. Monitor this to detect uneven load distribution across nodes. |
InstanceMaxNodeOutputRatioV3(%) | Peak output rate on the busiest node | Identifies hot nodes. Monitor this to detect uneven load distribution across nodes. |
Why are some metric values inaccurate?
Three common causes:
Low traffic volume. The system calculates each metric based on a specific formula. When traffic is low, small fluctuations produce disproportionately large deviations in the result.
Outdated client version. Older Kafka client libraries omit parameters that the monitoring system depends on, which skews reported values. Upgrade to the latest client version to fix this.
Data compression. Producers compress data to meet specific transmission or storage requirements. This can result in deviations in monitoring data.
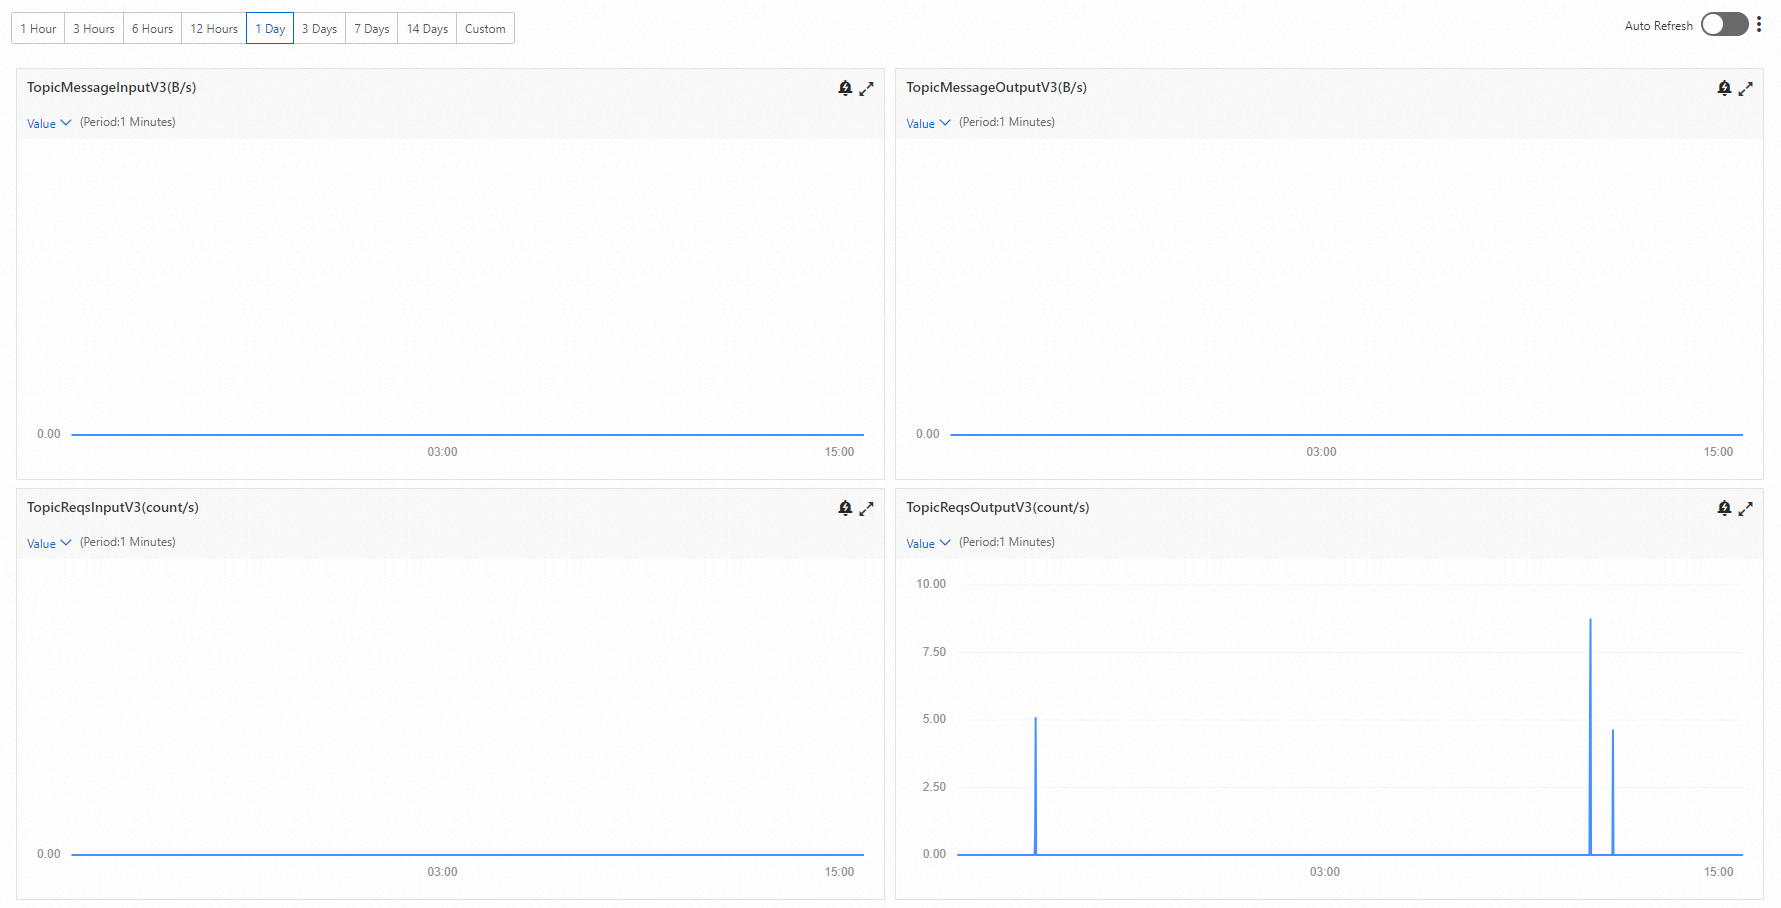
Why is message output zero when request output is greater than zero?
This is normal, not an error. It happens when consumers are active but no new messages have been published to the broker.
Kafka consumers continuously poll the broker for new messages, even when none are available. Each poll registers as a consumption request, so InstanceReqsOutput and TopicReqsOutput increment with every attempt. Because no messages are actually delivered, InstanceMessageOutput and TopicMessageOutput stay at zero.
Example: Suppose no producer is publishing messages while a consumer group polls the broker 50 times. TopicReqsOutput shows 50, but TopicMessageOutput shows 0. As soon as a producer starts publishing again, both metrics begin incrementing together.