This topic describes the causes and solutions to the issue that the CPU utilization of an ApsaraDB RDS for SQL Server instance is high or even reaches 100%.
Take note of the following items:
Before you perform high-risk operations, such as modifying the configurations or data of Alibaba Cloud instances, we recommend that you check the disaster recovery and fault tolerance capabilities of the instances to ensure the security of your data.
Before you modify the configurations or data of an instance, such as an Elastic Compute Service (ECS) instance or an RDS instance, we recommend that you create snapshots or enable backup for the instance. For example, you can enable the log backup feature for an RDS instance.
If you granted permissions on sensitive information or submitted sensitive information in the Alibaba Cloud Management Console, we recommend that you modify the sensitive information at the earliest opportunity. Sensitive information includes usernames and passwords.
Improper DOP for an RDS instance
Troubleshooting
When multiple threads are used to process tasks in parallel, the amount of data that is processed by each thread is different, and CXPACKET waits may occur. A large number of CXPACKET waits cause high CPU utilization. You can use Activity Monitor in SQL Server Management Studio (SSMS) or execute the following SQL statements several times to check whether a large number of CXPACKET waits exist.
In SQL Server, CXPACKET waits occur in parallel processing scenarios. A CXPACKET wait indicates that specific threads complete processing and wait for other threads to complete processing to integrate the processing results. If the accumulated CXPACKET wait time is excessively high, the CPU performance of an RDS instance is affected.
WITH [Waits] AS (
SELECT [wait_type],
       [wait_time_ms] / 1000.0 AS [WaitS],
       ([wait_time_ms] - [signal_wait_time_ms]) / 1000.0 AS [ResourceS],
       [signal_wait_time_ms] / 1000.0 AS [SignalS],
       [waiting_tasks_count] AS [WaitCount],
       100.0 * [wait_time_ms] / SUM ([wait_time_ms]) OVER() AS [Percentage],
                                    ROW_NUMBER() OVER(
                                                      ORDER BY [wait_time_ms] DESC) AS [RowNum]
FROM sys.dm_os_wait_stats
WHERE [wait_type] NOT IN ( N'BROKER_EVENTHANDLER',
                            N'BROKER_RECEIVE_WAITFOR',
                             N'BROKER_TASK_STOP',
                              N'BROKER_TO_FLUSH',
                               N'BROKER_TRANSMITTER',
                                N'CHECKPOINT_QUEUE',
                                 N'CHKPT',
                                  N'CLR_AUTO_EVENT',
                                   N'CLR_MANUAL_EVENT',
                                    N'CLR_SEMAPHORE', -- Maybe uncomment these four if you have mirroring issues N'DBMIRROR_DBM_EVENT', N'DBMIRROR_EVENTS_QUEUE', N'DBMIRROR_WORKER_QUEUE', N'DBMIRRORING_CMD', N'DIRTY_PAGE_POLL', N'DISPATCHER_QUEUE_SEMAPHORE', N'EXECSYNC', N'FSAGENT', N'FT_IFTS_SCHEDULER_IDLE_WAIT', N'FT_IFTSHC_MUTEX', -- Maybe uncomment these six if you have AG issues N'HADR_CLUSAPI_CALL', N'HADR_FILESTREAM_IOMGR_IOCOMPLETION', N'HADR_LOGCAPTURE_WAIT', N'HADR_NOTIFICATION_DEQUEUE', N'HADR_TIMER_TASK', N'HADR_WORK_QUEUE', N'KSOURCE_WAKEUP', N'LAZYWRITER_SLEEP', N'LOGMGR_QUEUE', N'MEMORY_ALLOCATION_EXT', N'ONDEMAND_TASK_QUEUE', N'PREEMPTIVE_XE_GETTARGETSTATE', N'PWAIT_ALL_COMPONENTS_INITIALIZED', N'PWAIT_DIRECTLOGCONSUMER_GETNEXT', N'QDS_PERSIST_TASK_MAIN_LOOP_SLEEP', N'QDS_ASYNC_QUEUE', N'QDS_CLEANUP_STALE_QUERIES_TASK_MAIN_LOOP_SLEEP', N'QDS_SHUTDOWN_QUEUE', N'REDO_THREAD_PENDING_WORK', N'REQUEST_FOR_DEADLOCK_SEARCH', N'RESOURCE_QUEUE', N'SERVER_IDLE_CHECK', N'SLEEP_BPOOL_FLUSH', N'SLEEP_DBSTARTUP', N'SLEEP_DCOMSTARTUP', N'SLEEP_MASTERDBREADY', N'SLEEP_MASTERMDREADY', N'SLEEP_MASTERUPGRADED', N'SLEEP_MSDBSTARTUP', N'SLEEP_SYSTEMTASK', N'SLEEP_TASK', N'SLEEP_TEMPDBSTARTUP', N'SNI_HTTP_ACCEPT', N'SP_SERVER_DIAGNOSTICS_SLEEP', N'SQLTRACE_BUFFER_FLUSH', N'SQLTRACE_INCREMENTAL_FLUSH_SLEEP', N'SQLTRACE_WAIT_ENTRIES', N'WAIT_FOR_RESULTS', N'WAITFOR', N'WAITFOR_TASKSHUTDOWN', N'WAIT_XTP_RECOVERY', N'WAIT_XTP_HOST_WAIT', N'WAIT_XTP_OFFLINE_CKPT_NEW_LOG', N'WAIT_XTP_CKPT_CLOSE', N'XE_DISPATCHER_JOIN', N'XE_DISPATCHER_WAIT', N'XE_TIMER_EVENT') AND [waiting_tasks_count] > 0 )

  SELECT MAX ([W1].[wait_type]) AS [WaitType],
             CAST (MAX ([W1].[WaitS]) AS DECIMAL (16, 2)) AS [Wait_S],
                  CAST (MAX ([W1].[ResourceS]) AS DECIMAL (16, 2)) AS [Resource_S],
                       CAST (MAX ([W1].[SignalS]) AS DECIMAL (16, 2)) AS [Signal_S],
                            MAX ([W1].[WaitCount]) AS [WaitCount],
                                CAST (MAX ([W1].[Percentage]) AS DECIMAL (5, 2)) AS [Percentage],
                                     CAST ((MAX ([W1].[WaitS]) / MAX ([W1].[WaitCount])) AS DECIMAL (16, 4)) AS [AvgWait_S],
                                          CAST ((MAX ([W1].[ResourceS]) / MAX ([W1].[WaitCount])) AS DECIMAL (16, 4)) AS [AvgRes_S],
                                               CAST ((MAX ([W1].[SignalS]) / MAX ([W1].[WaitCount])) AS DECIMAL (16, 4)) AS [AvgSig_S]
  FROM [Waits] AS [W1]
  INNER JOIN [Waits] AS [W2] ON [W2].[RowNum] <= [W1].[RowNum]
GROUP BY [W1].[RowNum]
HAVING SUM ([W2].[Percentage]) - MAX([W1].[Percentage]) < 95;
Solutions
SQL statement-specific DOP
Execute the following SQL statement to identify the SQL statements that consume CPU resources of the RDS instance:
SELECT TOP 50 [Avg. MultiCore/CPU time(sec)] = qs.total_worker_time / 1000000 / qs.execution_count, [Total MultiCore/CPU time(sec)] = qs.total_worker_time / 1000000, [Avg. Elapsed Time(sec)] = qs.total_elapsed_time / 1000000 / qs.execution_count, [Total Elapsed Time(sec)] = qs.total_elapsed_time / 1000000, qs.execution_count, [Avg. I/O] = (total_logical_reads + total_logical_writes) / qs.execution_count, [Total I/O] = total_logical_reads + total_logical_writes, Query = SUBSTRING(qt.[text], (qs.statement_start_offset / 2) + 1, ((CASE qs.statement_end_offset WHEN -1 THEN DATALENGTH(qt.[text]) ELSE qs.statement_end_offset END - qs.statement_start_offset) / 2) + 1), Batch = qt.[text], [DB] = DB_NAME(qt.[dbid]), qs.last_execution_time, qp.query_plan FROM sys.dm_exec_query_stats AS qs CROSS APPLY sys.dm_exec_sql_text(qs.[sql_handle]) AS qt CROSS APPLY sys.dm_exec_query_plan(qs.plan_handle) AS qp where qs.execution_count > 5 --more than 5 occurences ORDER BY [Total MultiCore/CPU time(sec)] DESC;NoteIf the RDS instance runs SQL Server 2008 R2, you can view the SQL statements that consume CPU resources in the slow query logs of the RDS instance in the ApsaraDB RDS console.
To view the slow query logs, perform the following steps: Go to the instance details page. In the left-side navigation pane, click Logs. On the Slow Log Summary tab, view the logs.
After you identify the SQL statement that has a high degree of parallelism (DOP), you can view the execution plan of the SQL statement and add a hint such as
OPTION (MAXDOP 1)at the end of the SQL statement to limit the DOP and improve resource management. Example:SELECT column1,column2 FROM table1 o INNER JOIN table2 d ON (o.d_id = d.d_id) OPTION (maxdop 1);
RDS instance-specific DOP
Execute the following SQL statement to view the value of the maximum degree of parallelism parameter of the RDS instance:
SELECT * FROM SYS.CONFIGURATIONS
WHERE NAME LIKE '%MAX%';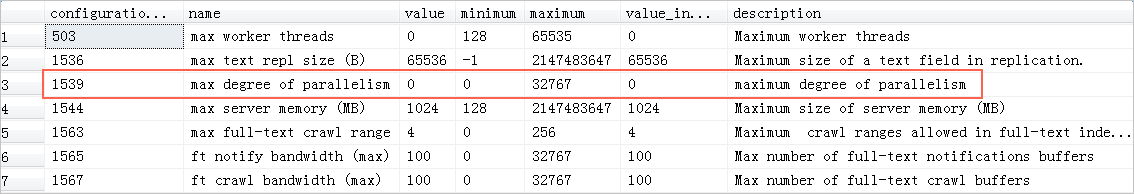
Execute the following SQL statement to configure the parameter. The configuration takes effect on all queries executed on the RDS instance.
sp_rds_configure 'max degree of parallelism',1;NoteIf the RDS instance runs SQL Server 2008 R2, you can modify the parameter in the ApsaraDB RDS console. For more information, see Reconfigure the parameters of an ApsaraDB RDS for SQL Server instance by using the ApsaraDB RDS console.
Heavy application loads
Symptom
The loads on an RDS instance are heavy. However, no slow queries occur or slow queries are not the root cause of heavy loads. The curves of queries per second (QPS) and CPU utilization match. This problem is common in optimized online transaction systems, such as order systems, and popular web applications that have high read rates.
Characteristics
The QPS is high. Query operations are simple. The query efficiency is high. Queries are difficult to be optimized.
Solutions
We recommend that you optimize the application architecture or upgrade the instance type.
Upgrade the instance type of your RDS instance to increase CPU resources. For more information, see Change the specifications of an ApsaraDB RDS for SQL Server instance.
Optimize queries to reduce execution costs and improve application scalability. You can optimize logic I/O operations and minimize the number of rows that a query needs to read in a table.
Large number of read and write operations
Symptom
Slow SQL queries occur. The QPS and CPU utilization curves do not match. Some SQL statements that consume multiple CPU resources involve large number of I/O operations.
Characteristics
The QPS is low. The query efficiency is low. A large amount of data needs to be scanned during queries. Queries can be optimized.
Solutions
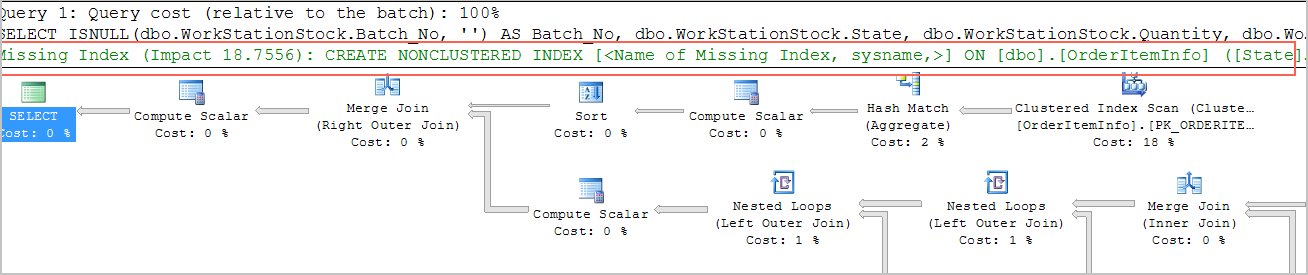
Check whether indexes are created for the large tables that are involved in a query. Check the execution plan of the query and optimize the full table scan. You can view suggestions on missing indexes in the execution plan.
Use CloudDBA to check performance issues. For more information, see View the storage information of an ApsaraDB RDS for SQL Server instance.
More suggestions
You can perform the following operations to prevent the CPU utilization from reaching 100%:
Configure alert rules for CPU utilization to help you monitor CPU utilization and plan workloads.
During application design and development, optimize SQL statements based on general rules to reduce the logical I/O of queries and improve application scalability.
Before a new feature or module is released, use production data to perform stress testing in a production environment.
Use CloudDBA to check the performance of RDS instances to identify issues at the earliest opportunity.