All Products
Search
Document Center

ApsaraDB for OceanBase:Real-time diagnostics

Last Updated:Feb 22, 2024

This topic describes how to use the real-time diagnostics feature. On the real-time diagnostics page in the ApsaraDB for OceanBase console, you can view the information about SQL diagnostics and session analysis.

View the real-time diagnostic information

  1. Log on to the ApsaraDB for OceanBase console.

  2. In the left-side navigation pane, click Autonomy Service.

  3. In the Instance Details section, click the name of the target cluster instance.

  4. On the Real-time Diagnostics page, you can view the diagnostic information on the following two tabs.

    1. SQL Diagnostics: displays the statistics of suspicious and slow SQL statements in tenants, and lists the suspicious, top, slow, and high-risk SQL statements in each tenant.

    2. Session Management: displays the session statistics and deadlocks of tenants.

SQL diagnostics

On the SQL Diagnostics tab, you can view the following information.

Statistics

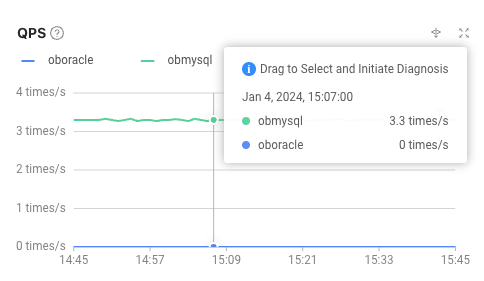
In the statistics section, you can filter the statistics by time to view the numbers of suspicious SQL statements and slow SQL statements in the current cluster and in each tenant. You can also click the name of a tenant to view the diagnostic details of the tenant within the corresponding period in the tenant diagnostic information section.

1

Performance monitoring

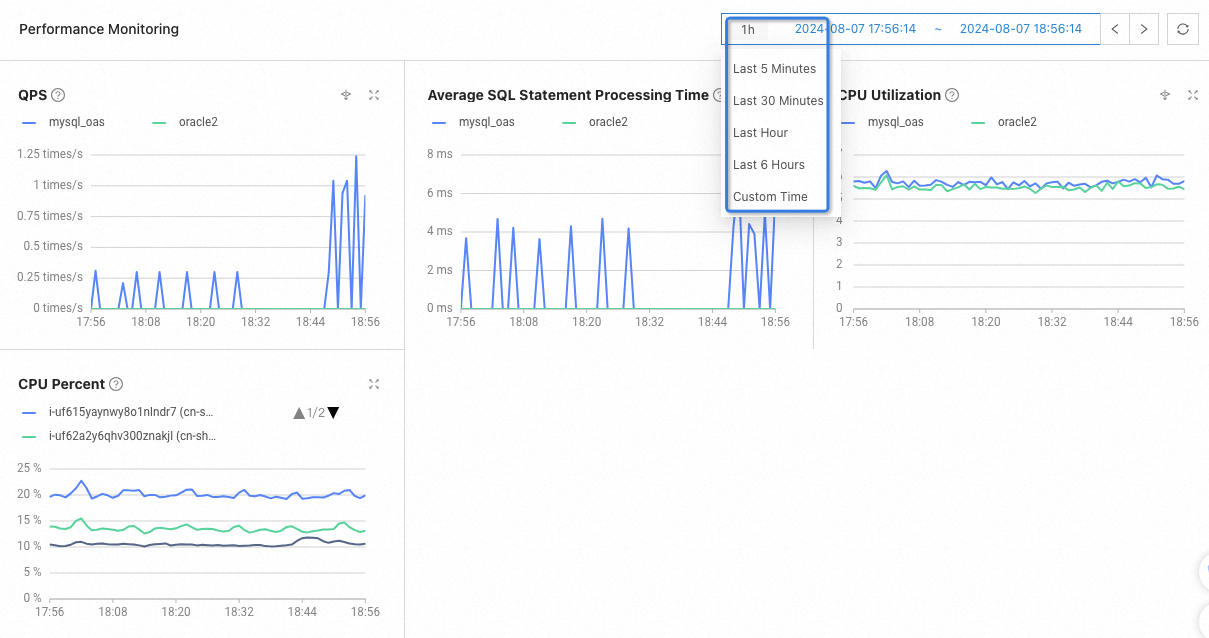
In the performance monitoring section, you can filter the statistics by time to view the SQL performance information about the cluster.

View request analysis

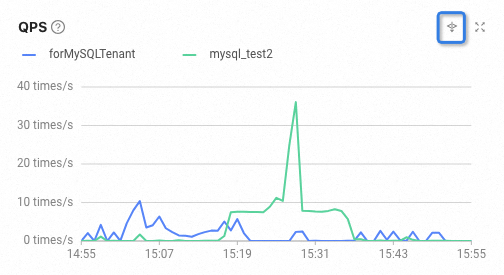
You can click View Request Analysis for a tenant to view the distribution of SQL execution time and the request execution information.请求分析..png

View performance monitoring data

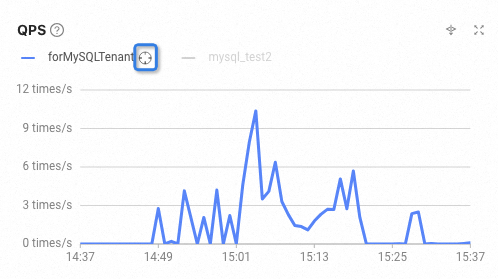
You can click View Performance Monitoring for a tenant to view its monitoring data.性能监控..png

Tenant diagnostic information

You can select a tenant from the Tenant drop-down list and view the diagnostic information about the suspicious, top, slow, and high-risk SQL statements of the tenant. You can also perform the following operations:

  • Filter the SQL statement list by Database, Node, Keyword, Duration, or advanced conditions specified by Advanced Search.

  • Click the image.png icon for a column to sort the list by the column.

  • Click Column Management to select the columns to be displayed in the list.

  • Click Export in the upper-right corner to download the list.

  • Click the text of an SQL statement to go to its diagnostic details page. On this page, you can view the following information of the SQL statement: SQL Text, Optimization Suggestions, SQL Diagnostic Details, SQL Sampling Details, SQL Execution History, Physical Execution Plan, SQL Index, and Advanced Settings.

  • Enable Aggregate IN queries. This feature aggregates the results of IN queries without affecting statistics. You can hover over the SQL ID of an SQL statement identified by Aggregate to view the SQL IDs of other aggregated SQL statements.

    image.png

Suspicious SQL statements

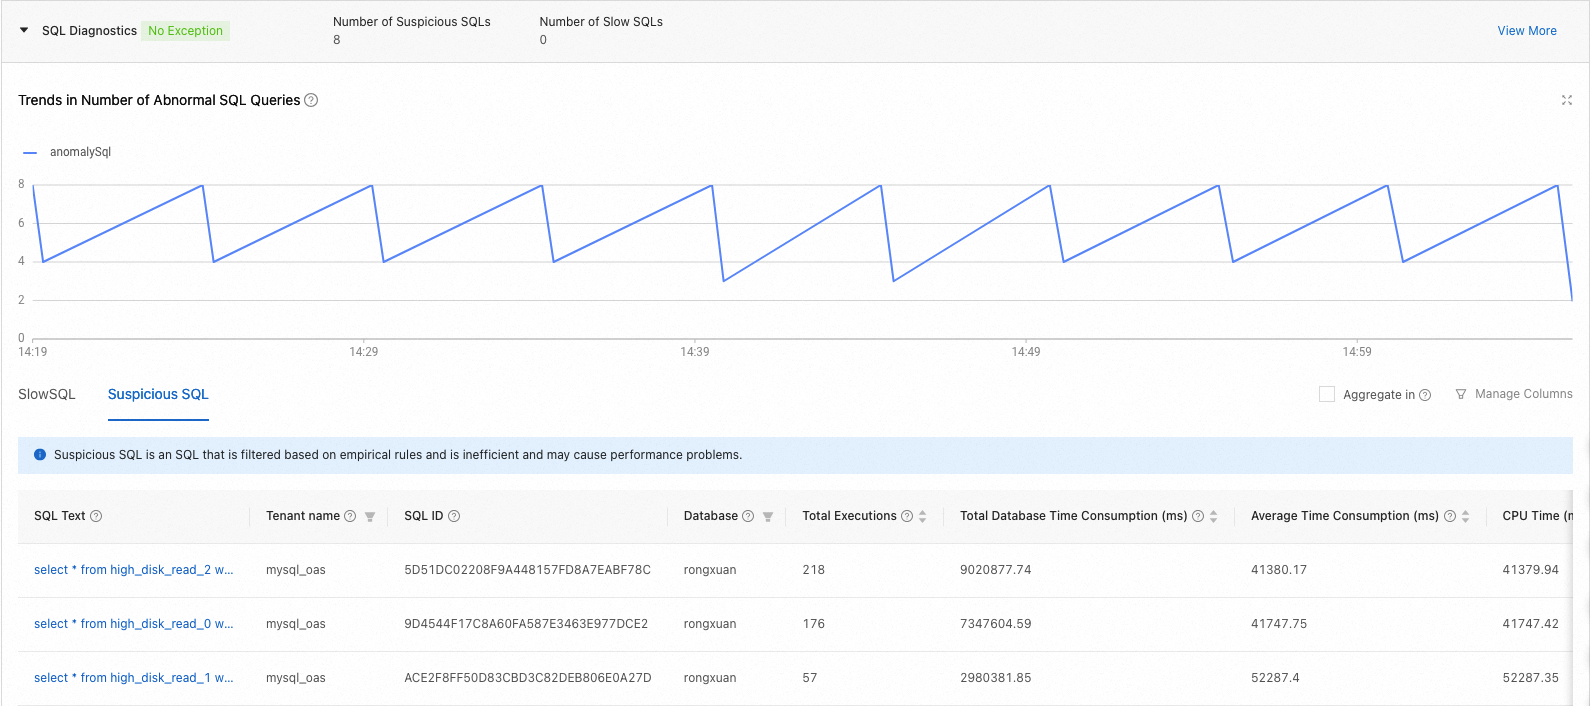
Suspicious SQL statements are SQL statements that may cause performance issues. Such statements are identified and determined by the platform based on rules and algorithms. The following table describes the general suspicious SQL diagnostic results and troubleshooting suggestions.

Diagnostic result

Troubleshooting suggestion

Hint with no effect

It indicates an abnormal SQL statement that requires the database administrator (DBA) to determine whether to fix the execution plan by using an outline.

Full table scan with an unused index

Check the data distribution and contact the DBA.

Full table scan without available index

We recommend that you create appropriate indexes.

Poor performance despite the use of indexes

Check whether the performance is acceptable in your business scenarios. If not, improve the business logic or optimize the indexes.

Performance degradation

Check data distribution changes, request surges, and execution plan changes.

Plan change accompanied by performance degradation

Check with the DBA. You can use an outline to fix the execution plan to verify whether the SQL statement is abnormal.

Execution spikes

Check the business volume. A spike in the number of executions of an SQL statement may cause the overall performance to decrease.

High CPU load

Check your business scenarios, data distribution changes, request increases, and execution plan changes.

Row lock contention

Check the accounts that are involved in row lock contention.

Too many partitions are accessed by the DML statement

Rewrite the SQL statement so that it supports partition pruning.

The Suspicious SQL tab displays the SQL text, databases, and diagnostic results.

image.png

Top SQL statements

Top SQL statements are SQL statements with the longest response time and are sorted in descending order.

Note

You can diagnose the top SQL statements of a specified tenant or all tenants in a cluster in real time. When the CPU utilization of an OBServer node is excessively high, you can use this feature to sort the SQL statements on the OBServer node to determine those to be optimized. In this scenario, database filtering is not supported, but you can perform the following operations.

image.png

  • Filter top SQL statements by full table scan, multi-partition scan, and the number of remote executions.

  • Click the plus sign (+) next to the text of an SQL statement to view the last error and all errors that occurred.

    image.png

  • Click View Optimization Suggestions in the upper-right corner to go to the optimization center and view optimization suggestions.

  • Click TopSQL Comparison in the upper-right corner to compare the status and performance of the same SQL statement in different periods or on different nodes.

    • Comparison of different periods: Select a period for comparison with the baseline period. You can define the period for comparison and the baseline period. Click Comparative Analysis to view the comparison of details and the comparison of performance trends.SQL执行对比-时段

    • Comparison on different nodes: You can compare the execution of an SQL statement on the baseline node with that of the same SQL statement on other nodes. You can select multiple nodes for comparison. The system obtains the average SQL execution result on these nodes for comparison with the baseline node. After you select or define a period for analysis, click Comparative Analysis to view the comparison of details and comparison of response time trends.不同节点对比

      Note
      • Two SQL statements with the same SQL ID in the same database can be considered the same.

      • Comparison on different nodes is performed only when the same SQL statement is executed on the nodes. If the baseline node and the nodes for comparison did not execute the same SQL statement, no comparison result is displayed.

Slow SQL statements

Slow SQL statements are SQL statements whose execution time exceeds the specified threshold. You can filter slow SQL statements by full table scan, multi-partition scan, and the number of remote executions.

11

High-risk SQL statements

High-risk SQL statements are SQL statements that may cause damage to system performance, security, and data.

The following table describes the types of high-risk SQL statements that can be identified.

Operation

Example

Risk type

Description

Add or delete a column.

  • alter table test drop column id

  • alter table test add new_id int not null comment 'New ID'

Schema change - Add/Delete column

-

Drop a table or database.

  • drop table test

  • drop database test

Drop table/database

-

Truncate a table.

truncate table test

Truncate table

-

Update data without conditions.

update test set new_id =1

Update without conditions

-

Update data with permanently true conditions.

update test set new_id =1 where 1 = 1

Update with permanently true conditions

-

Delete data without conditions.

delete from test

Delete without conditions

-

Delete data with permanently true conditions.

delete from test where 1=1

Delete with permanently true conditions

-

Too many rows are returned.

max_return_rows >= 50000

Too many rows returned

The max_return_rows parameter specifies the maximum number of returned rows allowed for an SQL statement. If the number of returned rows exceeds this value, the SQL statement is considered at high risk.

Too many rows are affected.

max_affected_rows > 50000

Too many rows affected

The max_affected_rows parameter specifies the maximum number of affected rows allowed for an SQL statement. If the number of affected rows exceeds this value, the SQL statement is considered at high risk.

Too many partitions are involved.

max_partition_cnt >2000

Too many partitions involved

The max_partition_cnt parameter specifies the maximum number of involved partitions allowed in an SQL statement. If the number of involved partitions exceeds this value, the SQL statement is considered at high risk.

Too many IN conditions are used.

where id in (1,2,3,4,5.....)

Too many IN conditions

The High-risk SQL tab displays the SQL text, databases, and diagnostic results.

image.png

View the SQL diagnostic details

On the SQL Diagnostics tab, you can click an SQL statement to go to its details page. On this page, you can view the following information.

SQL text

In the SQL text section, you can view the complete SQL text and select Show Schema to synchronize or view the schema of the corresponding table.

image.png

Optimization suggestions

In the Optimization Suggestions section, you can view all errors of the SQL statement within the diagnostics time range and corresponding optimization suggestions. You can take actions based on the optimization suggestions provided by the system. Two types of optimization suggestions are provided:

  • Plan recommendation: The system analyzes the execution plans for the SQL statement within the last week and recommends the one that outperforms others (local plans or distributed plans) in terms of CPU time. If an execution plan is recommended, we recommend that you analyze the differences between the recommended execution plan and the existing execution plan. If the recommended execution plan does not contain DDL operations for changes, you can bind it. After you bind the recommended execution plan, check the optimization effects. If the execution is not optimized, perform a rollback.

    Plan recommendation rules: A candidate plan is recommended based on the CPU time of the latest plan. When the CPU time of the latest plan is short, a candidate plan is recommended only when its CPU time is significantly shorter than that of the latest plan. When the CPU time of the latest plan is long, a candidate plan is recommended only when its CPU time is slightly shorter than that of the latest plan.

    CPU time of the latest plan

    CPU time of the candidate plan

    [0, 1) ms

    The CPU time of the candidate plan is 1/10 of that of the latest plan.

    [1, 10) ms

    The CPU time of the candidate plan is 1/5 of that of the latest plan.

    [10, 100) ms

    The CPU time of the candidate plan is 1/2 of that of the latest plan.

    [100, 1000) ms

    The CPU time of the candidate plan is 2/3 of that of the latest plan.

    [1000, ∞) ms

    The CPU time of the candidate plan is 5/6 of that of the latest plan.

  • Index recommendation, which is performed based on the following rules:

    • The equality query columns are arranged in the front and combined in any order.

    • If range queries are performed, the range query column with the best selectivity is arranged after the equality query columns.

    • If no range query is performed, the sorting column is arranged after the equality query columns when the sorting elimination condition is met.

    • Other columns in the predicate are arranged after the index. In this case, the index is a half-width index.

    • Other columns in the SELECT statement are arranged after the index to construct a covering index.

    • If the covering index contains eight or fewer columns, the covering index is recommended. Otherwise, the half-width index is recommended.

    • An index is recommended only when the CPU time exceeds 10 ms or the response time exceeds 20 ms.

优化建议..png

Note

This section is not displayed if no optimization suggestion is provided.

SQL sampling details

Note

The sampling details of SQL statements are displayed only on the details page of slow SQL statements.

You can view the sampling details of the current SQL statement. You can click Column Management to specify the columns to be displayed and adjust their sequence. Click Export to download the list of SQL sampling details.SQL采样明细..png

Aggregated SQL details

Note

The details of an aggregated SQL statement are displayed only on its details page.

On this page, you can view all related SQL statements. By default, the SQL text, database, and SQL ID columns are displayed. You can also view the error information about these SQL statements.

image.png

SQL diagnostic details

In the SQL Diagnostic Details section, you can view the number of occurrences of the same issue within the diagnostic time range, the request time range, number of executions, CPU time, and last execution time of the current SQL statement, and the diagnostics basis and troubleshooting suggestions for the current SQL statement.1

Note

This section is not displayed when no diagnostic details are available.

SQL execution history

On the SQL Execution History tab, the information about non-aggregated SQL statements and that about aggregated SQL statements are displayed in different layouts.

Execution history of non-aggregated SQL statements

You can view the execution history and statistical charts of an SQL statement in the last 1 hour, 12 hours, one day, or a custom time range.

  • Execution history: You can view the execution history of the current SQL statement. Click Column Management in the upper-right corner, select the information that needs to be frequently viewed, and click Export to download the list of execution history.

    image.png

  • Execution time: You can select a type of execution time on the right to view the statistics.

    image.png

  • Number of executions: You can click the Executions drop-down list and select the data to view.

    image.png

Execution history of aggregated SQL statements

You can view the execution history and statistical charts of an SQL statement in the last 1 hour, 12 hours, one day, or a custom time range.

  • Execution history: You can view the execution history of the current SQL statement. Click Column Management in the upper-right corner, select the information that needs to be frequently viewed, and click Export to download the list of execution history.

    image.png

  • You can view the statistical charts of an aggregated SQL statement in the aggregated SQL dimension or single SQL dimension. In the aggregated SQL dimension, the SQL execution time - CPU time chart and the total executions chart are displayed by default.

    • The aggregated SQL dimension collects the overall data of associated SQL statements.

      Execution time: You can select Total Database Time, Database Time, or Response Time from the drop-down list to view the statistics.

      image.png

      Total executions: You can click the Total Executions drop-down list and select the data to view.

      image.png

    • In the single SQL dimension, the top 10 SQL statements sorted by CPU utilization are displayed by default. You can select more SQL statements from the drop-down list.

      Execution time: You can select Total Database Time, Database Time, or Response Time from the drop-down list to view the statistics. You can also search for SQL statements by SQL ID and view the information about a specific SQL statement.

      image.png

      Total executions: You can click the Total Executions drop-down list and select the data to view. You can also search for SQL statements by SQL ID and view the information about a specific SQL statement.

      image.png

You can select Executions per Second, Total Response Time, or Response Time from the Total Executions drop-down list to view the statistics.

Physical execution plans

On the Physical Execution Plan tab, you can view, bind, and evict execution plans.

  • Click the plan hash text to view the details of the corresponding physical execution plan.

  • Click Custom Time and select Last 1 Hour, Last 12 Hours, or Last 24 Hours from the drop-down list or specify a custom time range for filtering.

  • Click Binding Records in Last 30 Days to view the binding history.

  • Click Evict Execution Plan. This operation clears the plan cache of the SQL statement in the tenant. An execution plan will be generated next time the SQL statement is executed.

  • Click Bind. This operation forces the SQL statement to be executed based on the execution plan. If the execution plan is bound to an SQL statement, Bound is displayed.

222

SQL indexes

On the SQL Index tab, you can view and bind indexes. If an index is bound to an SQL statement, Bound is displayed.SQL索引..png

Advanced settings

On the Advanced Settings tab, you can perform the following operations:

  1. Turn on the Throttling switch.

  2. Specify the maximum number of SQL statements that can be concurrently executed by an OBServer node. The index that is bound and the specified number of concurrently executed statements are mutually exclusive.

  3. Click Update Settings for your settings to take effect in real time.1

Session management

Click the Session Management tab. On this tab, you can view the statistics of active and idle sessions of databases and the session details of tenants. You can also select a tenant and view its session details on the Tenant Sessions, Session Statistics, and Deadlock Detection tabs.

image.png

Tenant sessions

  1. Enter an SQL statement in the search box to search for sessions.

  2. Select View Only Active Sessions to search for active sessions.

  3. Filter sessions by User and Database Name.

  4. Search for sessions by Session ID, Source, and Destination.

  5. Sort sessions by Execution Time.

  6. Click an SQL statement go to its diagnostics page.

  7. Find the target session, click Close Session in the Actions column. You can also select multiple sessions and click Batch Close Sessions. After a session is closed, its status changes to CLOSED.

image.png

Session statistics

  1. On the Session Statistics tab, view or export the number of active sessions and the total number of sessions of the current cluster by user, access source, or database.

    image.png

  2. Click 10-second SQL Analysis in the upper-right corner to analyze the executions of SQL statements in the tenant within 10 seconds. You can view the analysis results by SQL type, user, source, and database.

    image.png

Deadlock detection

  1. If you use deadlock detection for the first time, click Enable Deadlock Detection. After deadlock detection is enabled, OceanBase Database detects and handles deadlock events in real time, which consumes about 2% of the system resources. Choose whether to enable deadlock detection based on your cluster conditions.1

  2. After deadlock detection is enabled, the system starts to detect deadlock events in the tenants of the cluster, and returns the detection results on the Deadlock Details page. The detection results of the last seven days are retained.3

  3. You can click Disable Deadlock Detection in the upper-right corner to disable deadlock detection or click Refresh to refresh deadlock detection details.