On the Audit Manage page, you can view information about the recent operation events related to cluster management, tenant management, database management, and account management in the following columns: Resource Name/ID, Resource Type, Event Source, Event Type, Event Operation, Event Information, Execution Duration, Execution Result, and Result Information.
Background
The operation audit feature tracks key operations related to cluster, tenant, database, and account management performed in the console, and displays the recorded event information on the Audit Manage page. If an exception occurs, you can view the event information for troubleshooting.
Procedure
Log in to the ApsaraDB for OceanBase console. In the left-side navigation pane, click Audit Manage.
Search for and view historical events.
Search for historical events within a period of time: Select a predefined period from the drop-down list, or specify a custom range up to one month. Operation events are retained for two years.
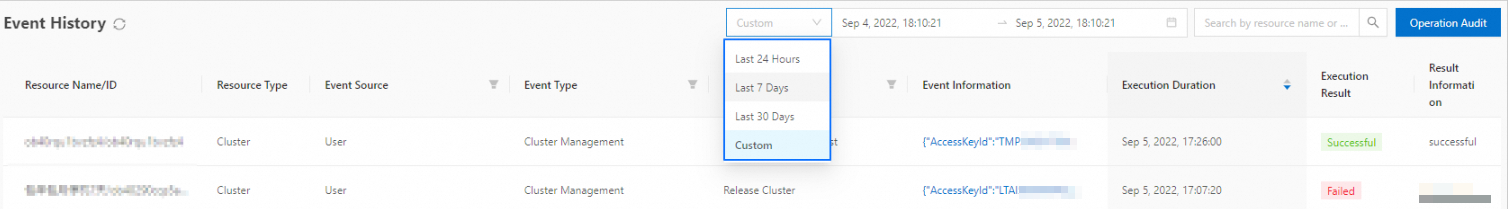
Search for specific resources and events: Enter the resource name and event in the search box and click the Search icon or press the Enter key.

Filter historical events.
Filter by Event Source: Click the filter icon next to Event Source, select one or more sources, and then click OK.
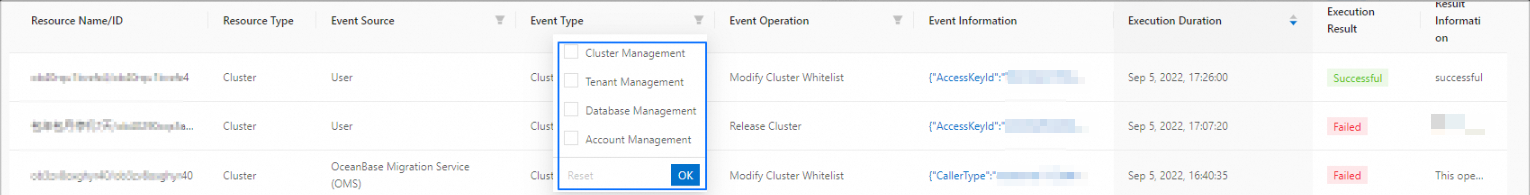
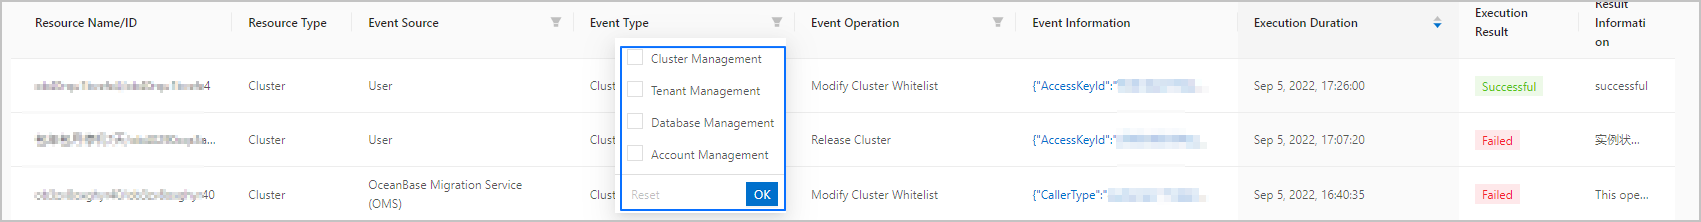
Filter by Event Type: Click the filter icon next to Event Type, select one or more types, and then click OK.
Filter by Event Operation: Click the filter icon next to Event Operation, select one or more operations, and then click OK.
View historical events in chronological order.
To order events by time in ascending order, click the up-pointing triangle next to Execution Duration.

To order events by time in descending order, click the down-pointing triangle next to Execution Duration.

View event information: Click the link in the Event Information column of an event to view the event information.
