When data sources run inside a virtual private cloud (VPC) and cannot be exposed to the Internet, a Grafana workspace has no direct route to query them. A VPC data channel creates a private network path between your Managed Service for Grafana workspace and a target VPC. This lets you visualize VPC-internal data sources, such as a self-managed Prometheus instance, without opening public endpoints.
VPC data channels are available only in Pro Edition and Advanced Edition. If you use the Developer Edition, upgrade first.
This topic applies to Grafana workspaces created before September 1, 2023.
How it works
A VPC may be inaccessible over the Internet for the following reasons:
Security: Exposure to the Internet increases the risk of attacks.
Costs: You must pay for elastic IP addresses (EIPs).
When you install a VPC data channel, the workspace establishes a private connection to a specific VPC through a vSwitch and security group that you specify. You can add VPC data channels if the data sources are not suitable for Internet exposure or multiple VPC data sources need to be displayed in the same Grafana workspace.
The following parameters define the channel:
| Parameter | Description |
|---|---|
| Region | The region where the target VPC resides |
| VPC | The VPC that contains the data source |
| vSwitch | The subnet within the VPC that the channel connects through |
| Security Group | Controls which traffic is allowed between the Grafana workspace and VPC resources |
| Name | A label to identify the data channel |
After you install a channel, set the Network Type parameter of a Grafana data source to the channel name. Grafana then routes queries through the VPC instead of the Internet.
You can select a data source type based on your business requirements. This topic uses a self-managed Prometheus instance as an example.
Prerequisites
Before you begin, make sure that you have:
A Managed Service for Grafana workspace (Pro Edition or Advanced Edition)
A VPC with at least one vSwitch and one security group
A data source running inside the VPC (for example, a self-managed Prometheus instance)
The primary private IP address of the Elastic Compute Service (ECS) instance that hosts the data source
(Optional) Install Prometheus in a VPC
Skip this section if a data source already exists in your VPC.
The following example installs Prometheus on an ECS instance. Replace with any other data source as needed.
Log on to an ECS instance in the VPC.
Download and start Prometheus:
   # Download the Prometheus installation package
   wget https://github.com/prometheus/prometheus/releases/download/v2.8.1/prometheus-2.8.1.linux-amd64.tar.gz

   # Extract the package
   tar -zxvf prometheus-2.8.1.linux-amd64.tar.gz -C /usr/local/

   # Rename the directory
   cd /usr/local
   mv prometheus-2.8.1.linux-amd64/ prometheus
   cd prometheus/

   # Verify the installation
   ./prometheus --version

   # (Optional) Edit prometheus.yml to customize scrape targets

   # Start Prometheus in the background
   ./prometheus &
Open
http://<ECS-public-IP>:9090/graphin a browser and query theupmetric to confirm Prometheus is running.NoteThe
upmetric withjob="prometheus"is a built-in self-monitoring metric that Prometheus exposes by default.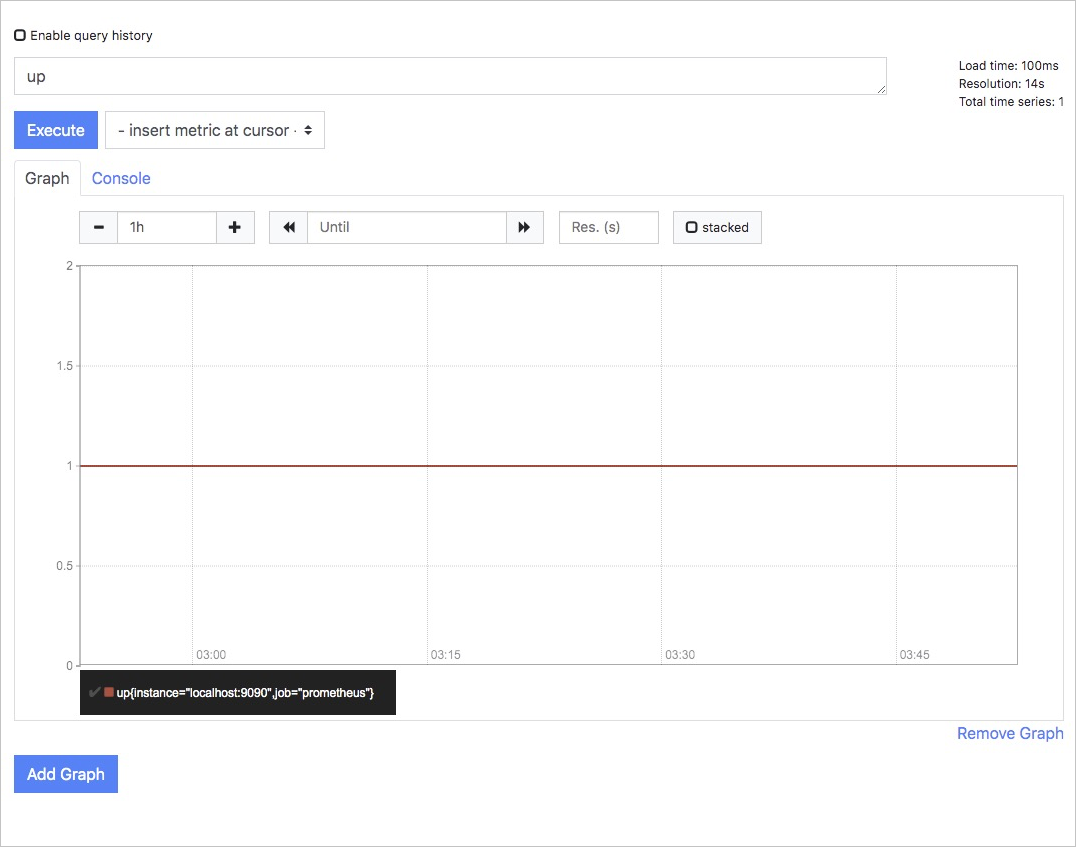
Install the VPC data channel
Log on to the ARMS console. In the left-side navigation pane, choose Managed Service for Grafana > Workspaces.
On the Workspace Management page, click the workspace ID. In the left-side navigation pane, click VPC Data Source Channel Management.
Click Install Data Source Channel. In the dialog box, configure the following parameters and click Install.
Parameter Description Region The region of the target VPC VPC The VPC that contains the data source Name A name for the data channel vSwitch The vSwitch (subnet) to use Security Group The security group that controls access 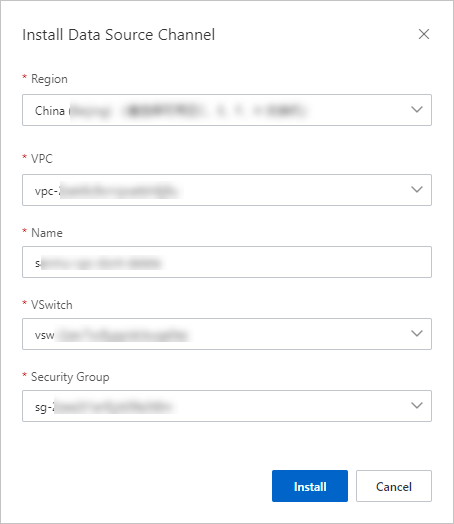
After installation completes, the new channel appears on the VPC Data Source Channel Management page.

Add a data source through the VPC channel
On the VPC Data Source Channel Management page, click Configure Data Source in the Actions column of the target channel. This opens the Grafana configuration page.
On the Data Sources tab, click Add data source and select Prometheus.
NoteSelect the data source type that matches your setup. Prometheus is used here as an example.
On the Settings page, configure the connection: For other Prometheus-specific settings, see the Grafana documentation.
Set Network Type to the VPC data channel you created in the previous section.
Set the URL to
http://<primary-private-IP>:9090, where<primary-private-IP>is the primary private IP address of the ECS instance that hosts the data source.
NoteFind the primary private IP address on the Instance Details page in the ECS console. For details, see View instance information.
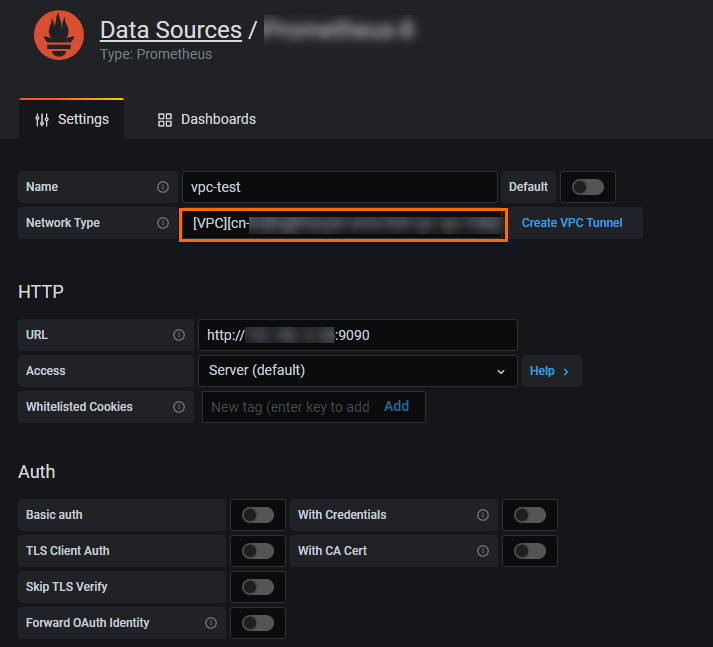
Click Save & test. If the message
Data source is workingappears, the data source is connected through the VPC data channel.
Verify the connection
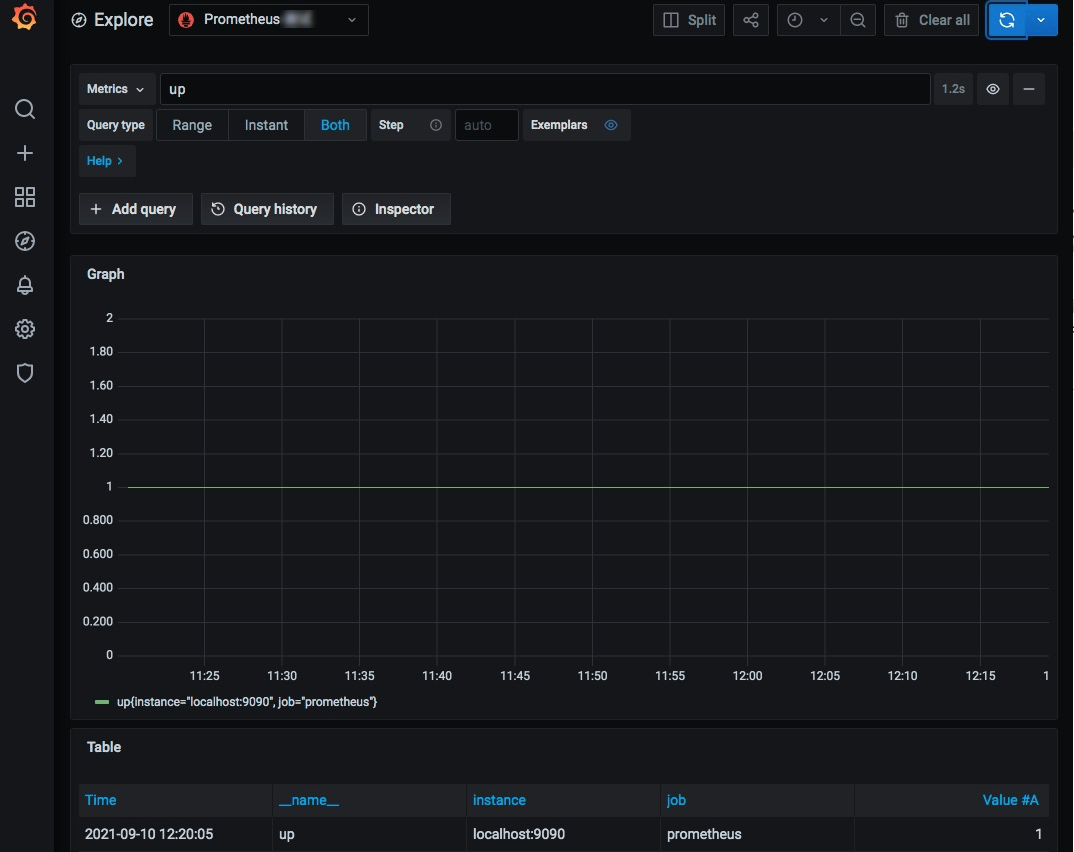
Run a test query on the Grafana Explore page to confirm the VPC data source returns data.
In the left-side navigation pane of the Grafana console, click the
 icon.
icon.From the data source drop-down list at the top of the Explore page, select the data source you added in the previous section.
In the Metrics field, enter
upand click Run query.
If the query results match the Prometheus page from the first section, the VPC data source is connected and working.