The Attack Statistics page of the application security feature displays information about attacks on your Java applications. You can view details such as the time when attacks were generated, the types and URLs of attacks, and handling methods. Use this page to identify trends, inspect individual events, and assess your security posture.
Unlike traditional firewalls that flag any request containing malicious patterns, application security only records real and effective attacks. For example, an HTTP request that exploits a PHP vulnerability is not recorded in a Java application because the exploit cannot run in a Java runtime. This approach reduces noise and ensures that every recorded event represents a genuine threat.
A real and effective attack means the attacker has breached the outer defense and can penetrate the internal environment of the application and execute dangerous actions. Investigate these events promptly and intercept or fix the relevant security vulnerabilities.
Prerequisites
Before you begin, make sure that you have:
An application connected to application security. See Access application security
All application instances restarted after connecting to application security
A Java probe that meets the minimum version requirements:
Environment Minimum version Container applications and EDAS applications v2.7.1.2 Other environments (manual upgrade) v2.7.1.3
Open the Attack Statistics page
Log on to the ARMS console.
In the left-side navigation pane, choose Application Security > Attack Statistics.
In the top navigation bar, select a region.
The page displays attack statistics for all applications by default.
Filter by application (optional)
To narrow the data to a single application, use one of the following methods:
Select an application from the All Applications drop-down list at the top of the page.
In the left-side navigation pane, choose Application Security > Application List, then click the application name.
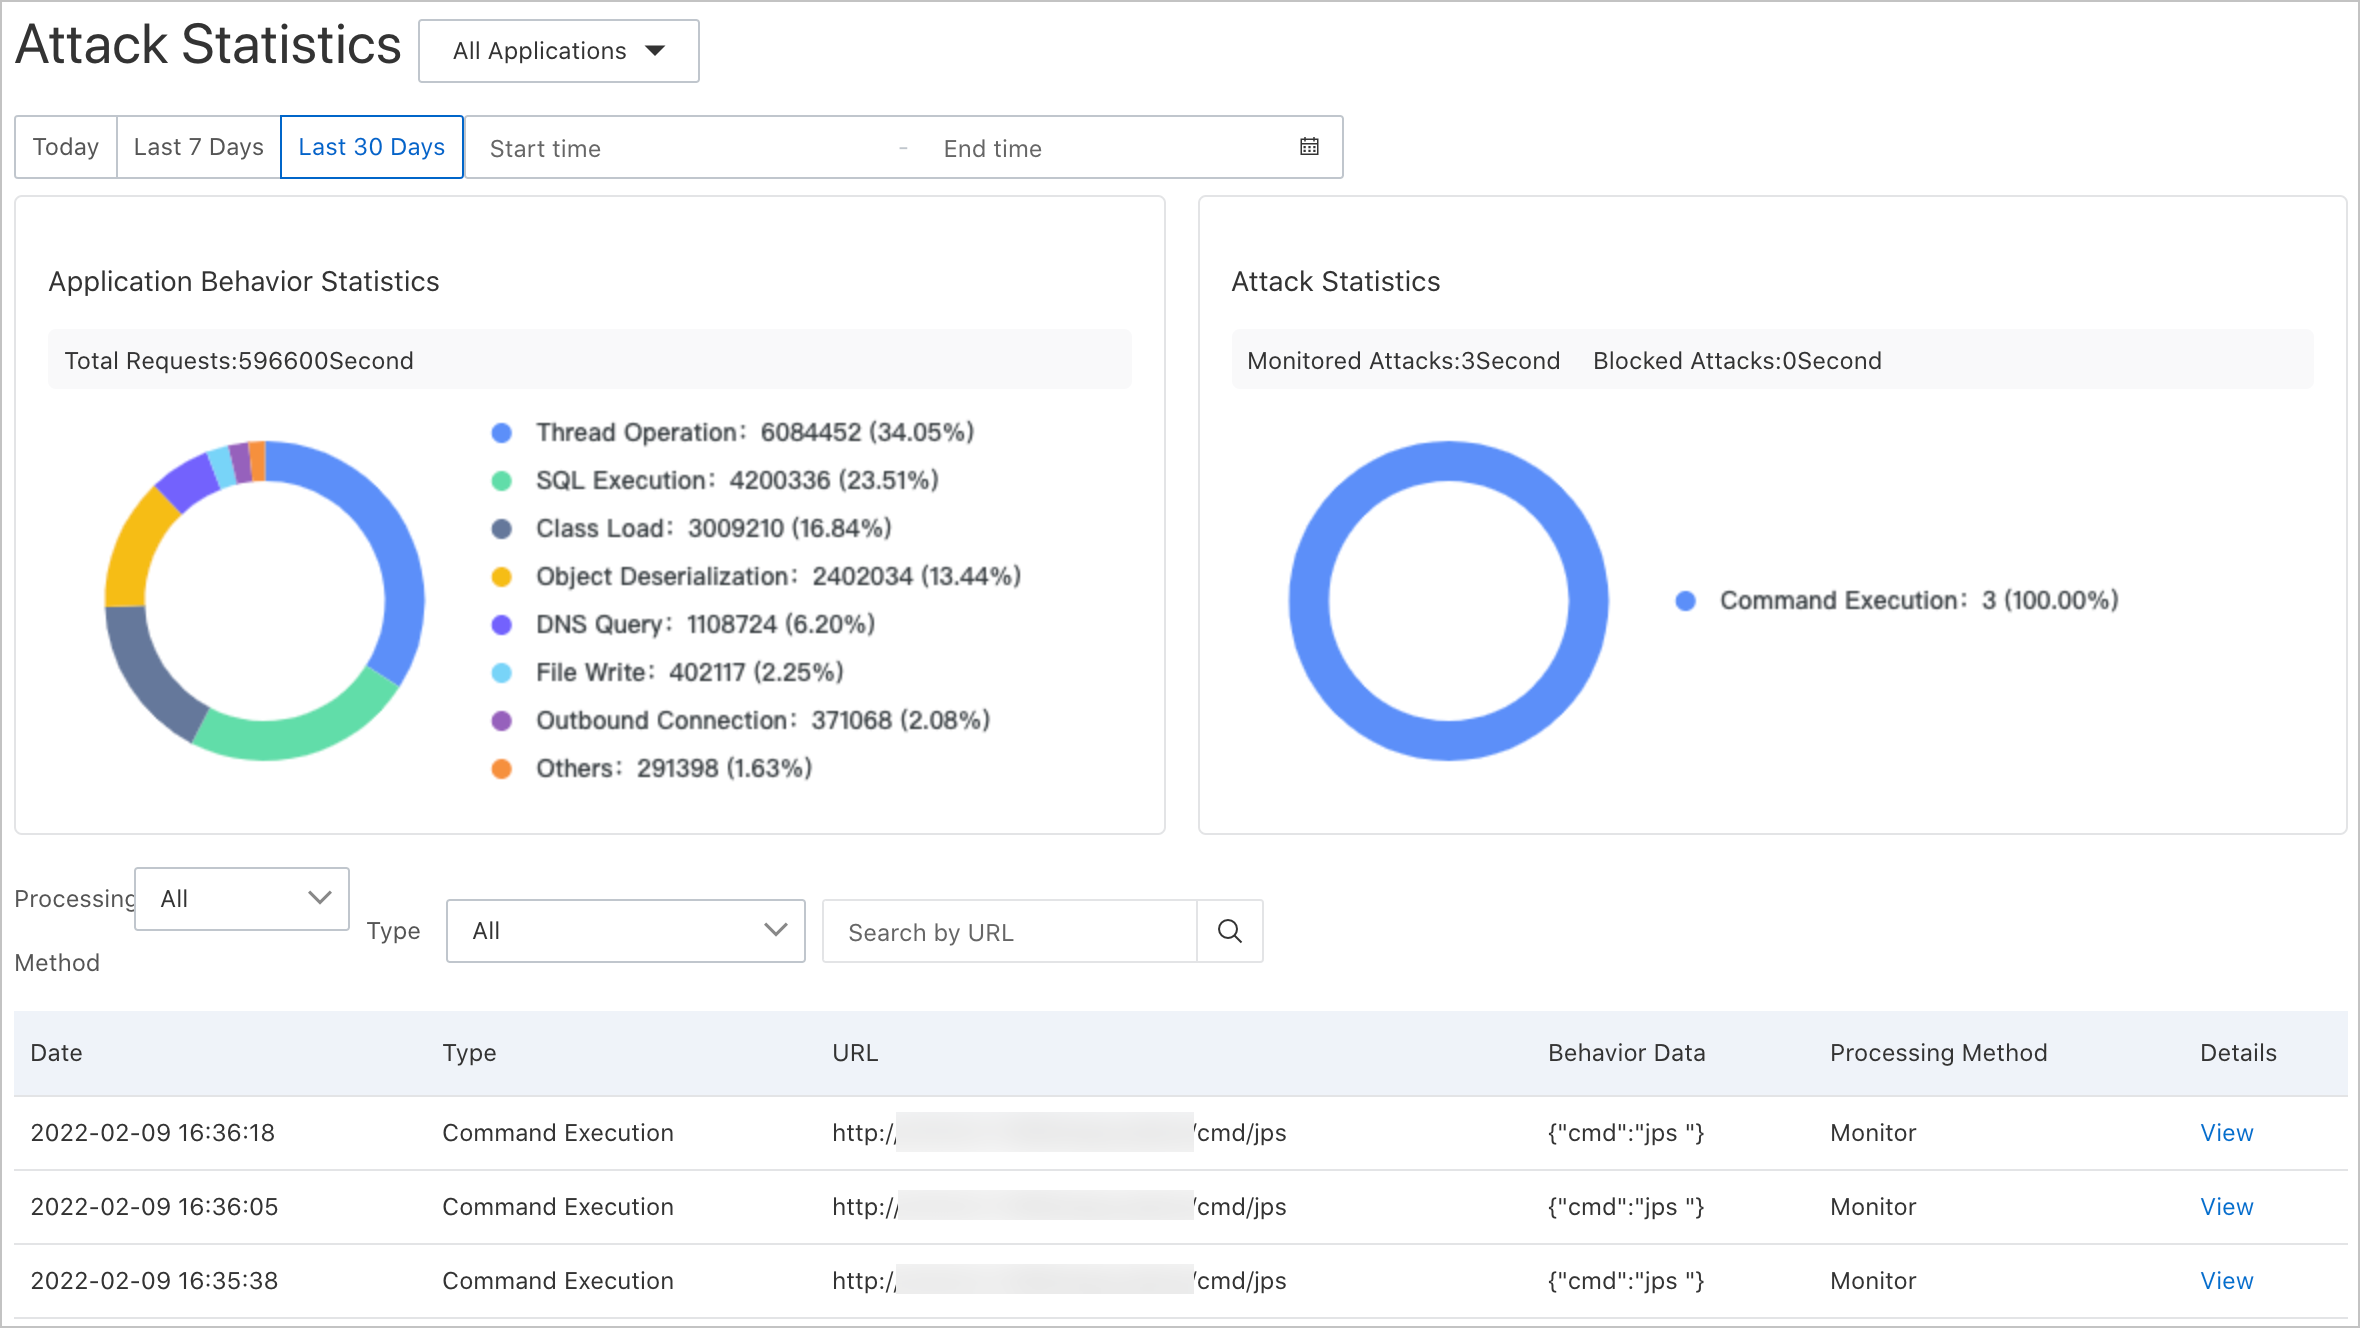
Understand the page sections
The Attack Statistics page has three sections, each focused on a different analytical dimension.
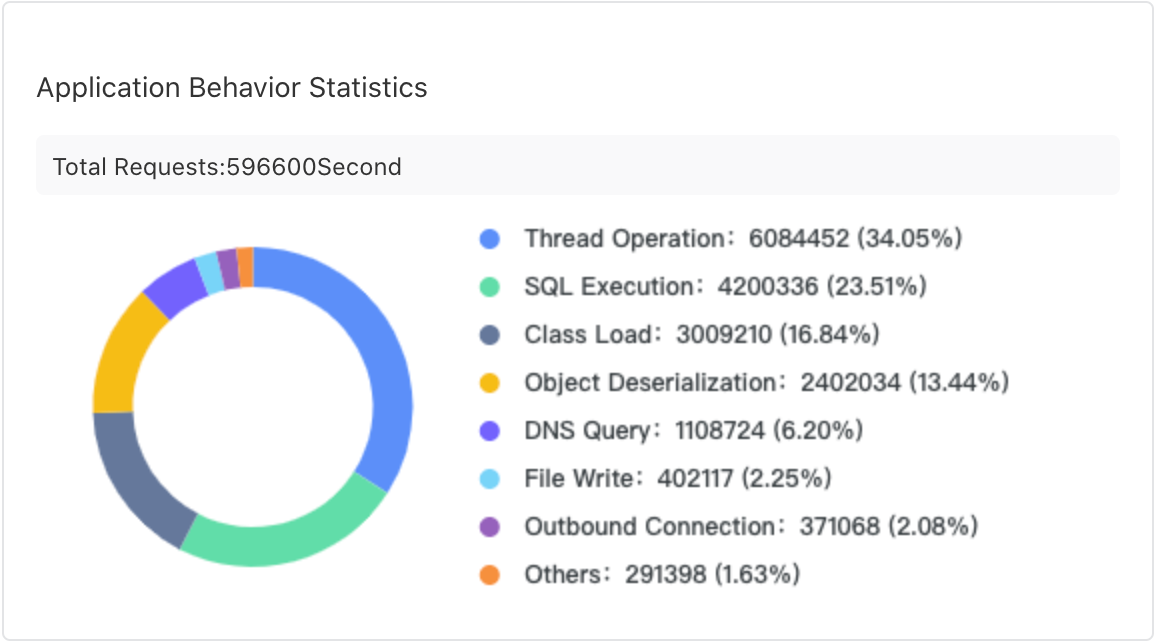
Application Behavior Statistics
Categorizes detected behaviors into normal behaviors and attack behaviors. Use it to gauge the ratio of legitimate traffic to malicious activity and identify changes over time.
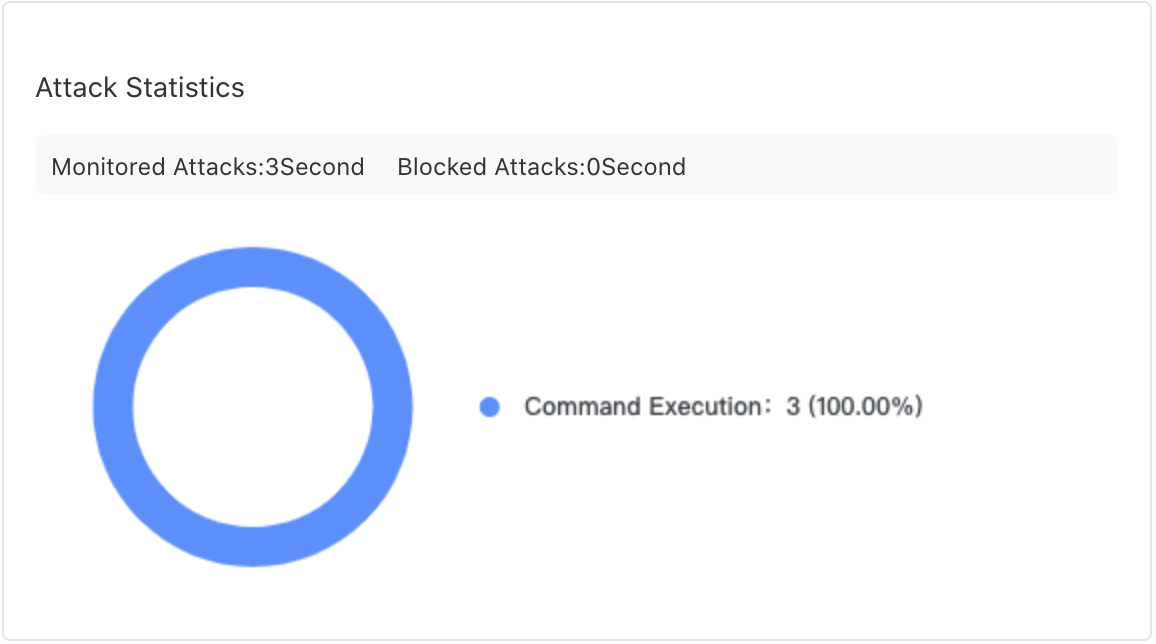
Attack Statistics
Breaks down detected attacks by type. Monitor for spikes in specific attack categories, which may indicate a targeted campaign.
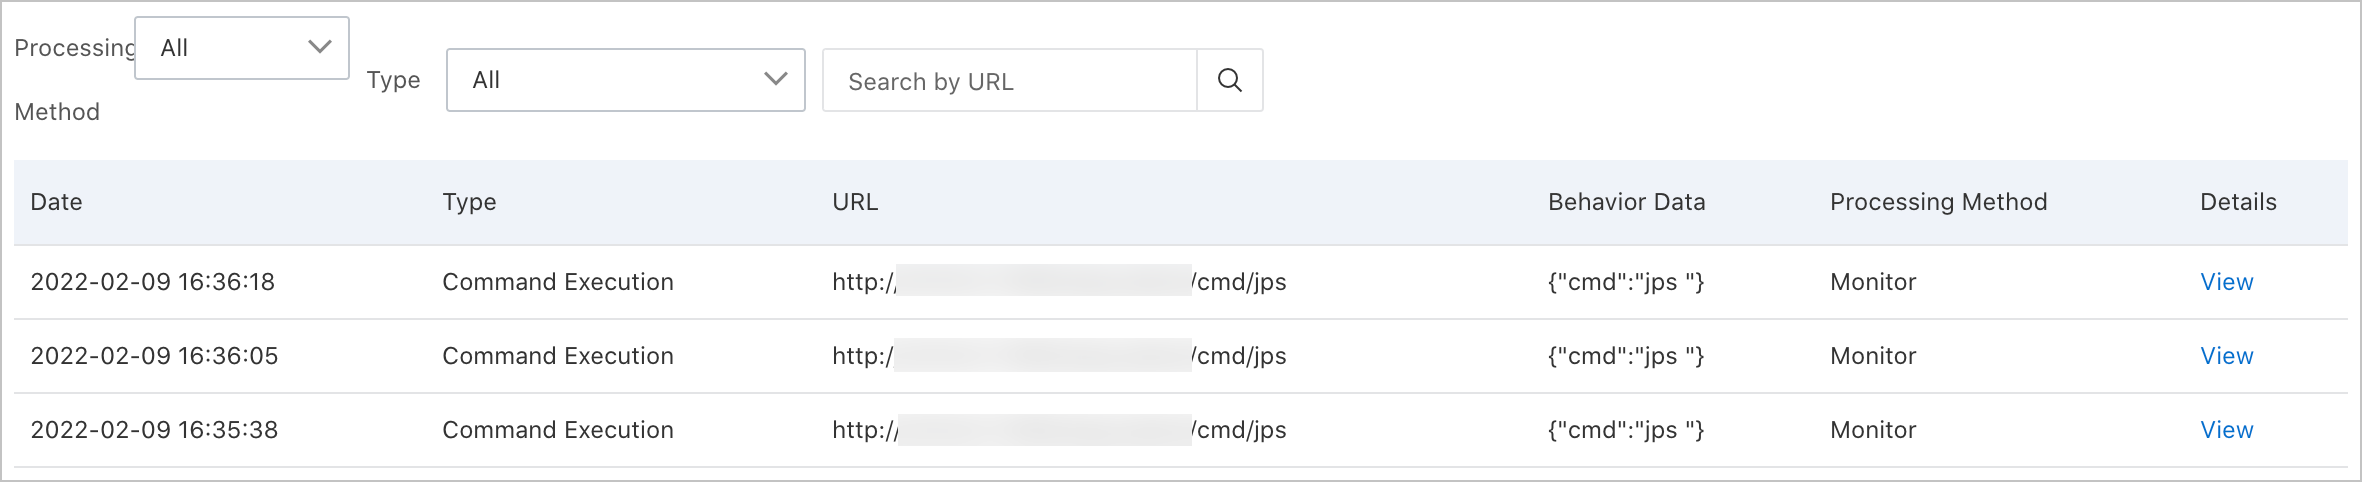
Attack details list
The table at the bottom of the page lists each individual attack event.
| Column | Description |
|---|---|
| Time | Timestamp when the attack was detected |
| Type | Attack category |
| URL | Endpoint targeted by the attack |
| Behavior data | Summary of the detected behavior |
| Handling method | How the attack was handled |
Inspect an attack event
In the attack details list, find the attack event you want to investigate.
Click View in the Details column.
The detail panel shows:
Security vulnerabilities
Attack requests
Server details
Troubleshooting
If the Attack Statistics page shows no data, check the following causes:
| Cause | Resolution |
|---|---|
| Application access is incomplete | After you click Access in the console, restart all application instances. Partial restarts result in incomplete data collection. |
| Java probe version is too low | Upgrade the probe to the minimum version listed in Prerequisites. For automatic upgrade scenarios, restart the application or pod. For manual upgrade steps, see Update the ARMS agent for Java applications. |
| No real attacks have occurred | Application security only records real and effective attacks. If no effective attacks have targeted your application, the page remains empty. This does not indicate a configuration problem. |
Related topics
Access application security -- Connect additional applications to application security.
Update the ARMS agent for Java applications -- Upgrade the Java probe to the latest version.