By default, Alibaba Cloud Managed Service for Prometheus integrates with the Application Monitoring data source of Application Real-Time Monitoring Service (ARMS) to visualize monitoring metrics. You can obtain application monitoring data, view preset application monitoring dashboards, and perform secondary development based on your business requirements.
Prerequisites
The ARMS agent is installed for your application. For more information, see Application Monitoring overview.
Scenarios
You can view application monitoring data obtained in Managed Service for Prometheus in a self-managed Grafana service.
You can use application monitoring data obtained in Managed Service for Prometheus for secondary development.
View an Application Monitoring instance
Log on to the ARMS console. In the left-side navigation pane, choose .
In the top navigation bar, select the region where the Application Monitoring instance resides. If the value of Instance Type is Prometheus Instance for Application Monitoring, the instance is integrated by default.
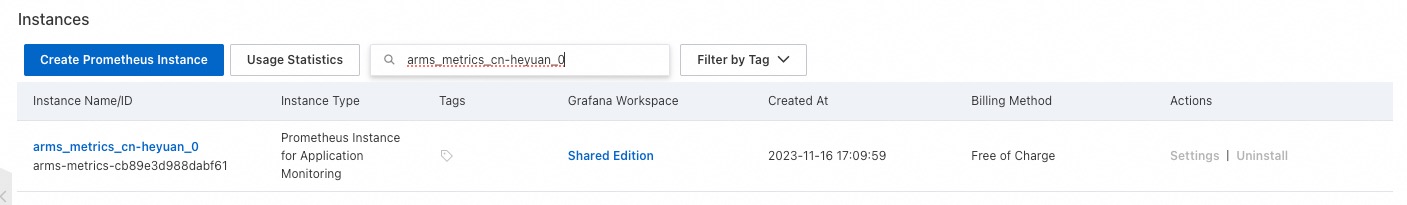
Click the name of the Application Monitoring instance to view the preset dashboards and instance information such as Remote Read address, HTTP API Address, and token.
View preset dashboards
On the Dashboards page, you can view the preset dashboards of the Application Monitoring instance. For information dashboard metrics, see Application monitoring metrics.
Obtain instance information
On the Settings page, obtain the HTTP API address and token.
Then, you can use the HTTP API address and token to synchronize application monitoring data from Managed Service for Prometheus to your local Grafana system. For more information, see Integrate Prometheus monitoring data with a local Grafana system.
References
Managed Service for Prometheus allows you to integrate the data source and dashboards of Application Monitoring with simple configurations. You can use Managed Service for Prometheus to quickly perform the secondary development of application monitoring data. For more information, see Use Application Monitoring metrics to create a custom Grafana dashboard.