When your application shows increased response time or elevated error rates, the root cause may be a service that calls your application rather than your own code. The Upstream application tab in Application Monitoring displays response time, request count, and error count for each caller, so you can quickly determine whether a performance issue originates upstream.
An upstream application is any service that sends data to your application. For example, if OrderService calls your PaymentService, then OrderService is an upstream application of PaymentService. Tracking these callers helps you isolate whether degraded performance is caused by your own service or by an upstream dependency.
Prerequisites
Your application must be connected to Application Monitoring. For setup instructions, see Overview.
View upstream application metrics
Log on to the ARMS console. In the left-side navigation pane, choose Application Monitoring > Applications.
On the Applications page, select a region in the top navigation bar and click the name of the application.
The icon in the Language column indicates the connection type. A
 icon means the application is connected to Application Monitoring. A hyphen (-) means it is connected to Tracing Analysis.
In the left-side navigation pane, click Application Details.
On the Application Details page, select an application instance, set the time period, and click the Upstream application tab.
Metrics reference
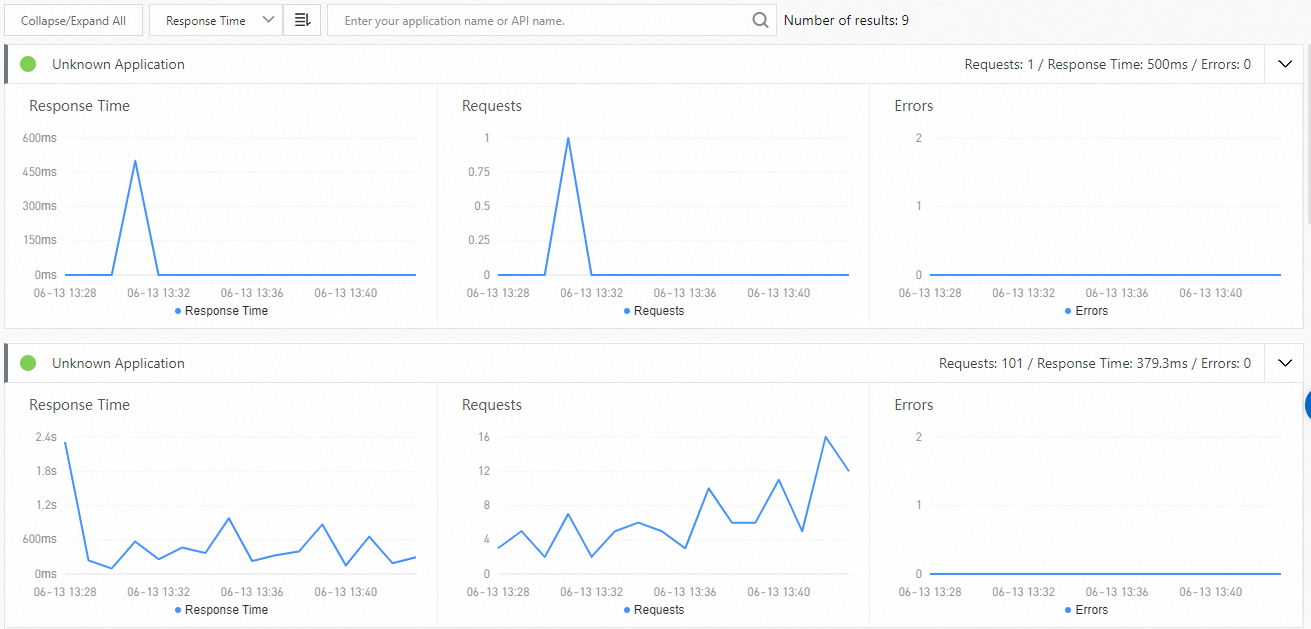
The Upstream application tab displays three time-series charts for the selected time period:
| Chart | Description |
|---|---|
| Response Time | Response time of requests from upstream applications. |
| Requests | Number of requests from upstream applications. |
| Errors | Number of errors from upstream applications. |
Chart interactions
All three charts support the following interactions:
Move the pointer over a chart to view detailed statistics.
Use the cursor to select a time period to view the statistics of the specified time period.