When a request spans multiple services and something goes wrong -- a slow response, an error, a timeout -- you need to trace the full request path to find the root cause. The Trace Query page in the Application Real-Time Monitoring Service (ARMS) console lets you search distributed traces by trace ID, operation name, duration, or other span attributes. Drill into individual spans to identify which service introduced the bottleneck or error. Select multiple traces for aggregate analysis to spot patterns across requests.
Query traces
Log on to the ARMS console.
In the left-side navigation pane, choose . In the top navigation bar, select a region.
On the Trace Query page, select a parameter from the Parameter Type drop-down list and specify a value in the Parameter Value field. Click Add to Query Condition. To find a specific trace, set Parameter Type to TraceId and enter the exact trace ID. You can add multiple query conditions to narrow down results. The following table describes the available parameters.
Parameter Description TraceId The unique identifier of a trace. Supports exact match only. Operation Name The name of the interface. Fuzzy match is not supported. Client Application Name The name of the application that initiates the call. Server Application Name The name of the application that receives the call. Duration Exceeds The minimum call duration to filter by, in milliseconds. Returns traces with spans that exceed this threshold. Call Type The type of call. Select from the drop-down list. Abnormal Call Set to trueto return only traces that contain abnormal calls.Client IP Address The IP address of the application that initiates the call. Server IP Address The IP address of the application that receives the call. Business Primary Key A business primary key to search for business events within traces. Response Code The response code returned by the server application. In the query results, click the trace ID to open the Traces tab.
Read trace details
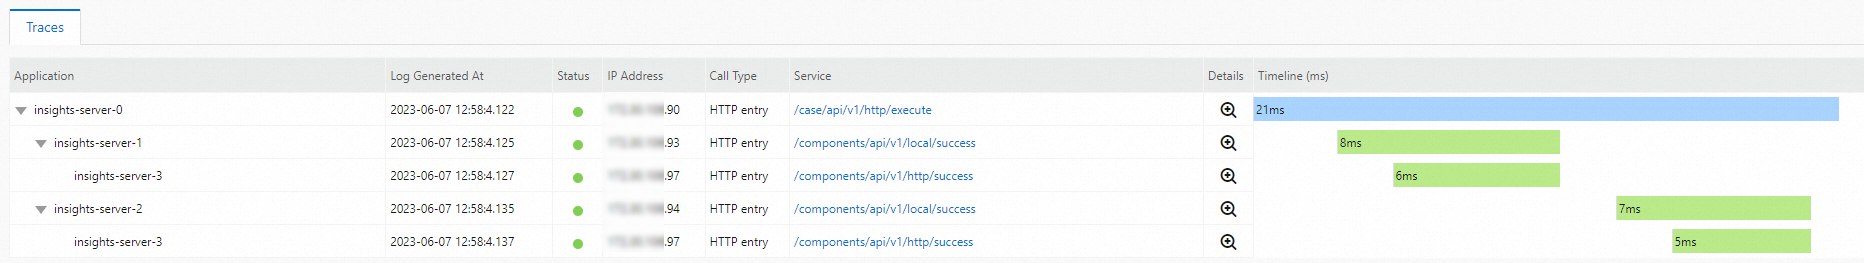
The Traces tab breaks down a trace into individual spans. Each row represents one span with the following fields:
| Field | Description |
|---|---|
| Application | The application to which the trace belongs. |
| Log Generated At | The timestamp when the log was generated. |
| Status | The status of the trace. Red indicates an exception in the local trace related to the service. Green indicates the trace is normal. |
| IP Address | The IP address of the application. |
| Call Type | The type of call, corresponding to the call type in the query filter. |
| Interface Name | The name of the interface that was called. |
| Timeline (ms) | The time consumed by each service and the proportion of time consumed by each service in the duration of the entire trace. Use this to identify which service consumed the most time in the request path. |
Analyze multiple traces
Compare multiple traces side by side to identify patterns, such as which spans have the highest error rates or consume the most time.
On the Trace Query page, select the checkboxes next to the traces you want to analyze.
Click Analyze Selected Traces. The Trace Analysis panel displays aggregate metrics for the selected traces:
Column Description Span name The name of the span operation. Hover over the name to view the trace ID that contains the span. Application name The application that generated the span. Click the name to go to the Application Overview page. Call type The type of call for the span. Number of requests The total request count across the selected traces. Proportion of requests The share of total requests represented by this span. Number of exceptions The exception count for this span across the selected traces. Proportion of exceptions The share of total exceptions represented by this span. Average duration The mean duration of this span across the selected traces. Proportion of spans The share of total spans represented by this span type. Average duration of all selected traces The overall mean duration across all the selected traces. 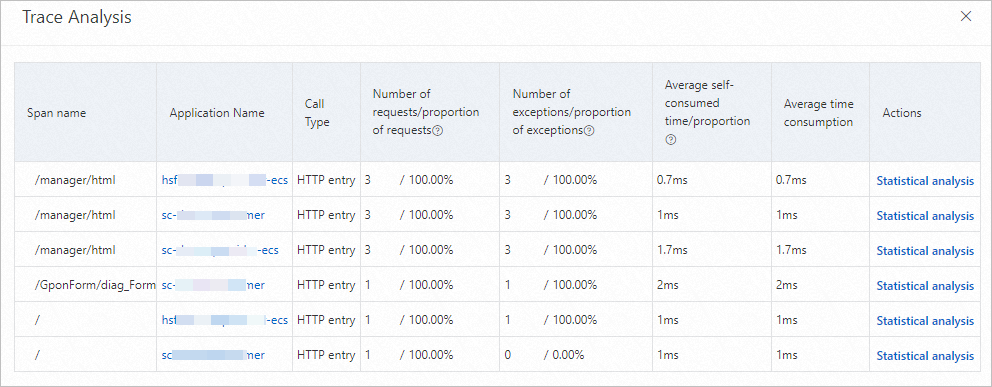
Drill into span details
In the Trace Analysis panel, click Statistical Analysis in the Actions column to view detailed statistics for a specific span. The details include:
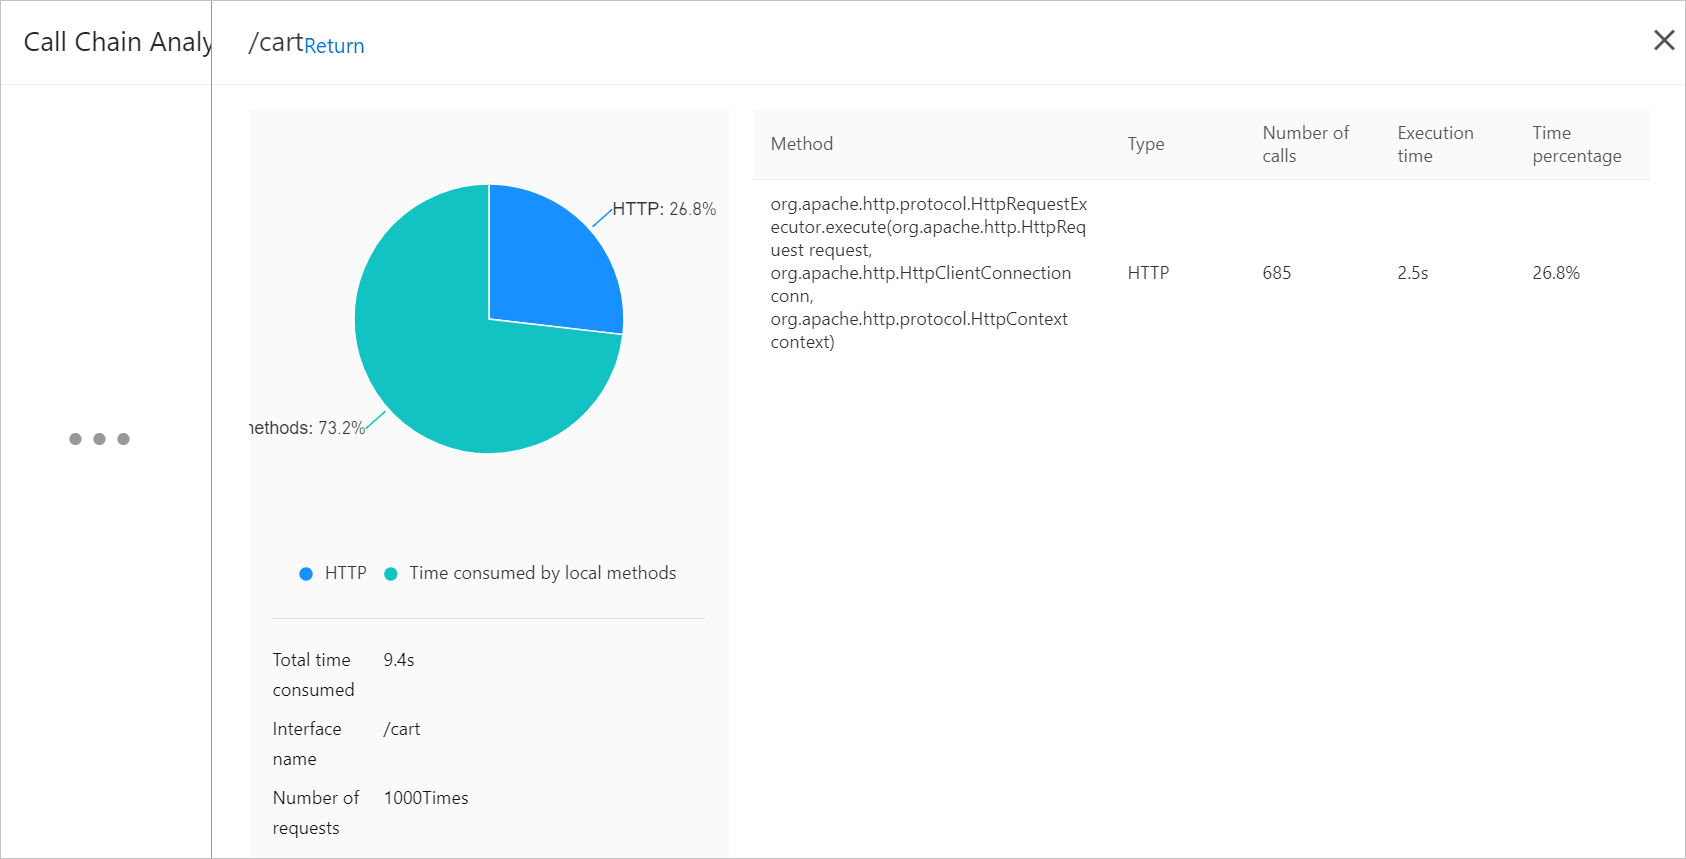
Proportions of different call types for each interface
Total duration, interface name, and number of requests
Recommended samples for further investigation
Number of times each call method is used
Breakdown of each call method: name, type, total duration, and proportion of time consumed