Application Real-Time Monitoring Service (ARMS) auto-instruments common Java frameworks. When you need to capture business-specific operations -- such as internal method calls, scheduled tasks, or custom metadata -- that auto-instrumentation does not cover, add manual instrumentation with the OpenTelemetry SDK for Java.
This guide covers four instrumentation tasks:
Create custom spans
Add attributes to a span
Propagate baggage through the trace context
Access the trace context
For auto-instrumented components, see Java components and frameworks supported by ARMS.
Prerequisites
Before you begin, make sure that you have:
An application monitored in Application Monitoring
ARMS agent V2.9.1.2 or later. To upgrade, see Update the ARMS agent for Java applications
Retrieve the OpenTelemetry instance through GlobalOpenTelemetry.get(). Do not create an instance manually with the SDK. The ARMS agent registers its own OpenTelemetry instance at startup. A manually created instance bypasses the agent, and custom spans become invisible in ARMS (agent v4.x and later).
Add dependencies
Add the following Maven dependencies to your project. The Bill of Materials (BOM) keeps OpenTelemetry artifact versions consistent.
<dependencies>
    <dependency>
        <groupId>io.opentelemetry</groupId>
        <artifactId>opentelemetry-api</artifactId>
    </dependency>
    <dependency>
        <groupId>io.opentelemetry</groupId>
        <artifactId>opentelemetry-sdk-trace</artifactId>
    </dependency>
    <dependency>
        <groupId>io.opentelemetry</groupId>
        <artifactId>opentelemetry-sdk</artifactId>
    </dependency>
</dependencies>

<dependencyManagement>
    <dependencies>
        <dependency>
            <groupId>io.opentelemetry</groupId>
            <artifactId>opentelemetry-bom</artifactId>
            <version>1.23.0</version>
            <type>pom</type>
            <scope>import</scope>
        </dependency>
    </dependencies>
</dependencyManagement>
For more information, see OpenTelemetry Java instrumentation.
Key concepts
| Concept | Description |
|---|---|
| Span | A single operation within a trace, such as a remote call or an internal method call |
| SpanContext | Metadata for a span, including the trace ID and span ID |
| Attribute | A key-value pair attached to a span to record contextual data |
| Baggage | Key-value pairs propagated across all services in a trace |
For the complete specification, see OpenTelemetry Trace API.
Get a tracer
All instrumentation starts with a Tracer. Get one from the global OpenTelemetry instance registered by the ARMS agent:
import io.opentelemetry.api.GlobalOpenTelemetry;
import io.opentelemetry.api.trace.Tracer;

// Get the Tracer from the ARMS agent's OpenTelemetry instance
Tracer tracer = GlobalOpenTelemetry.get().getTracer("manual-sdk", "1.0.0");
The first argument is the instrumentation scope name (typically your library or module name). The second is the version.
Create custom spans
Wrap business logic in a span to make it visible in ARMS traces. Always call span.end() in a finally block to make sure the span is closed, even if an exception occurs.
import io.opentelemetry.api.trace.Span;
import io.opentelemetry.api.trace.SpanKind;
import io.opentelemetry.api.trace.StatusCode;
import io.opentelemetry.context.Scope;

Span span = tracer.spanBuilder("my-operation")
        .setSpanKind(SpanKind.INTERNAL)
        .startSpan();
try (Scope scope = span.makeCurrent()) {
    // Your business logic here
} catch (Throwable t) {
    span.setStatus(StatusCode.ERROR, t.getMessage());
} finally {
    span.end();
}
makeCurrent() sets this span as the active span on the current thread. Any span created within the try block automatically becomes a child of this span.
Create parent-child span relationships
When a method calls another method, the child span is automatically linked to the parent through makeCurrent():
public String handleRequest() {
    Span parentSpan = tracer.spanBuilder("parent")
            .setSpanKind(SpanKind.SERVER)
            .startSpan();
    try (Scope scope = parentSpan.makeCurrent()) {
        // This call creates a child span under "parent"
        processOrder();
    } finally {
        parentSpan.end();
    }
    return "done";
}

private void processOrder() {
    Span childSpan = tracer.spanBuilder("child").startSpan();
    try (Scope scope = childSpan.makeCurrent()) {
        // Business logic
        Thread.sleep(1000);
    } catch (Throwable e) {
        childSpan.setStatus(StatusCode.ERROR, e.getMessage());
    } finally {
        childSpan.end();
    }
}
Instrument scheduled tasks
For background tasks that run outside an HTTP request context, create a root span to capture each execution:
ScheduledExecutorService ses = Executors.newSingleThreadScheduledExecutor();

ses.scheduleAtFixedRate(() -> {
    Span span = tracer.spanBuilder("schedule")
            .setAttribute("schedule.time", System.currentTimeMillis())
            .startSpan();
    try (Scope scope = span.makeCurrent()) {
        // Scheduled task logic
        Thread.sleep(500L);
        span.setAttribute("schedule.success", true);
    } catch (Throwable t) {
        span.setStatus(StatusCode.ERROR, t.getMessage());
    } finally {
        span.end();
    }
}, 10, 30, TimeUnit.SECONDS);
Add attributes to a span
Attach key-value attributes to a span to record contextual data such as request parameters, user identifiers, or operation outcomes.
span.setAttribute("http.method", "GET");
span.setAttribute("http.uri", "/parent");
span.setAttribute("schedule.success", true);
Set attributes at span creation or add them later during execution:
// At creation
Span span = tracer.spanBuilder("my-operation")
        .setAttribute("request.type", "batch")
        .startSpan();

// During execution
span.setAttribute("items.processed", 42);Use OpenTelemetry semantic conventions for standard attributes (such as http.method and http.route) to improve trace interoperability across tools and dashboards.
Propagate baggage through the trace context
Baggage items are key-value pairs that propagate across service boundaries within a trace. Use baggage to pass business context (such as user IDs or session tokens) to downstream services without modifying method signatures.
import io.opentelemetry.api.baggage.Baggage;
import io.opentelemetry.context.Context;

Span span = tracer.spanBuilder("parent")
        .setSpanKind(SpanKind.SERVER)
        .startSpan();
try (Scope scope = span.makeCurrent()) {
    // Create baggage and attach it to the current context
    Baggage baggage = Baggage.current().toBuilder()
            .put("user.id", "1")
            .put("user.name", "name")
            .build();
    try (Scope baggageScope = baggage.storeInContext(Context.current()).makeCurrent()) {
        // Downstream methods and services can read this baggage
        processOrder();
    }
} finally {
    span.end();
}
Read baggage values in any downstream method or service:
String userId = Baggage.current().getEntryValue("user.id");Baggage is propagated to all downstream services. Do not include sensitive data such as passwords or access keys.
Access the trace context
Retrieve the trace ID and span ID from the current span. This is useful for correlating traces with application logs.
import io.opentelemetry.api.trace.Span;

String traceId = Span.current().getSpanContext().getTraceId();
String spanId = Span.current().getSpanContext().getSpanId();

System.out.println("traceId=" + traceId + " spanId=" + spanId);
For a complete guide on log correlation, see Associate trace IDs with business logs for a Java application.
Complete example
The following Spring controller demonstrates all four tasks: creating spans, setting attributes, propagating baggage, and accessing the trace context.
@RestController
@RequestMapping("/ot")
public class OpenTelemetryController {

    private Tracer tracer;

    private ScheduledExecutorService ses = Executors.newSingleThreadScheduledExecutor();

    @PostConstruct
    public void init() {
        OpenTelemetrySdk.builder()
                .setPropagators(ContextPropagators.create(W3CTraceContextPropagator.getInstance()))
                .buildAndRegisterGlobal();

        tracer = GlobalOpenTelemetry.get().getTracer("manual-sdk", "1.0.0");

        ses.scheduleAtFixedRate(new Runnable() {
            @Override
            public void run() {
                Span span = tracer.spanBuilder("schedule")
                        .setAttribute("schedule.time", System.currentTimeMillis())
                        .startSpan();
                try (Scope scope = span.makeCurrent()) {
                    System.out.println("scheduled!");
                    Thread.sleep(500L);
                    span.setAttribute("schedule.success", true);
                    System.out.println(Span.current().getSpanContext().getTraceId()); // Obtain the trace ID.
                } catch (Throwable t) {
                    span.setStatus(StatusCode.ERROR, t.getMessage());
                } finally {
                    span.end();
                }
            }
        }, 10, 30, TimeUnit.SECONDS);
    }

    @ResponseBody
    @RequestMapping("/parent")
    public String parent() {
        Span span = tracer.spanBuilder("parent").setSpanKind(SpanKind.SERVER).startSpan();
        try (Scope scope = span.makeCurrent()) {
            // Use Baggage to propagate the custom tags of the service.
            Baggage baggage = Baggage.current().toBuilder()
                    .put("user.id", "1")
                    .put("user.name", "name")
                    .build();
            try (Scope baggageScope = baggage.storeInContext(Context.current()).makeCurrent()) {
                child();
            }
            span.setAttribute("http.method", "GET");
            span.setAttribute("http.uri", "/parent");
        } finally {
            span.end();
        }
        return "parent";
    }

    private void child() {
        Span span = tracer.spanBuilder("child").startSpan();
        try (Scope scope = span.makeCurrent()) {
            System.out.println("current traceId = " + Span.current().getSpanContext().getTraceId());
            System.out.println("userId in baggage = " + Baggage.current().getEntryValue("user.id"));
            Thread.sleep(1000);
        } catch (Throwable e) {
            span.setStatus(StatusCode.ERROR, e.getMessage());
        } finally {
            span.end();
        }
    }
}
ARMS agent compatibility
Different ARMS agent versions handle custom instrumentation differently.
| Feature | ARMS agent v4.x and later | ARMS agent v3.x and earlier |
|---|---|---|
| Create custom spans | Supported. A new span is generated. | Supported. A new span is generated. |
| Create spans (parent-child) | Supported | Supported |
| Propagate baggage | Supported | Not supported |
| Add attributes | Supported | Supported |
| Child span visibility | Separate span in trace | Displayed as method stack within the parent span |
| Trace context (trace ID match) | Supported. The printed trace ID matches the agent trace ID. | Not supported. The printed trace ID differs from the agent trace ID. |
| Read baggage | Supported | Supported |
Instrumentation results
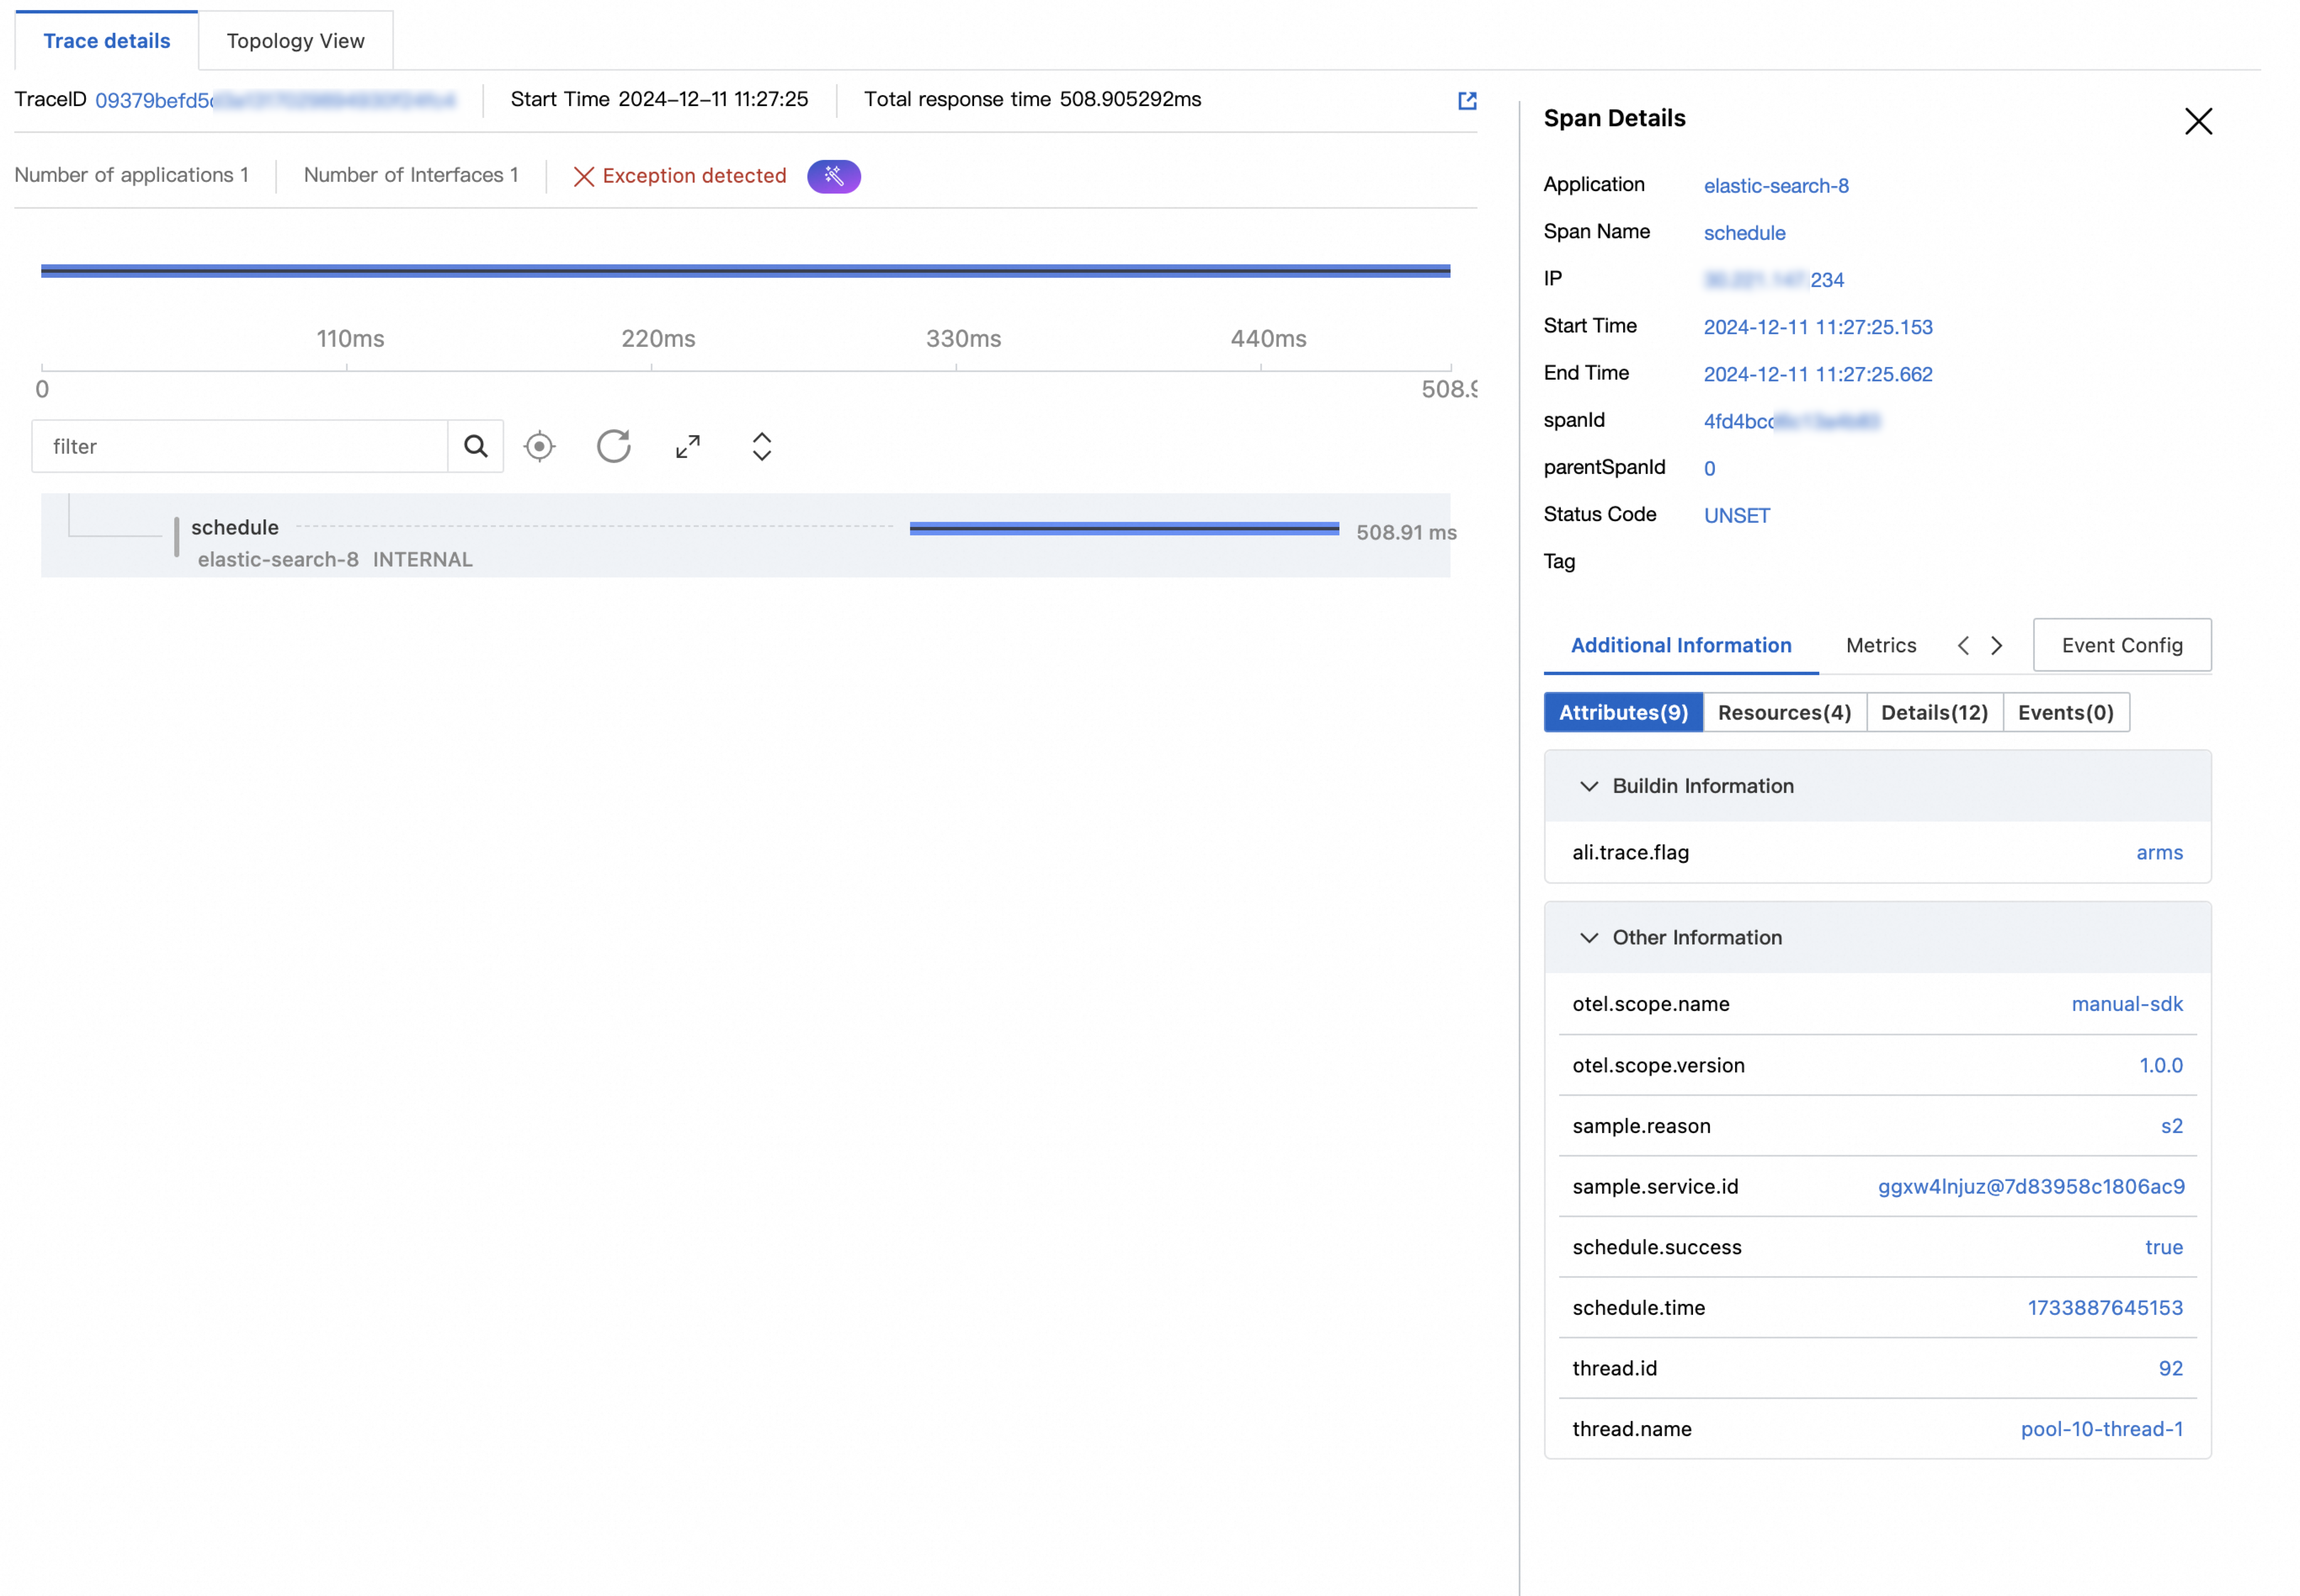
ARMS agent v4.x and later
Scheduled task span:
Spans generated through the OpenTelemetry SDK appear in the trace view.
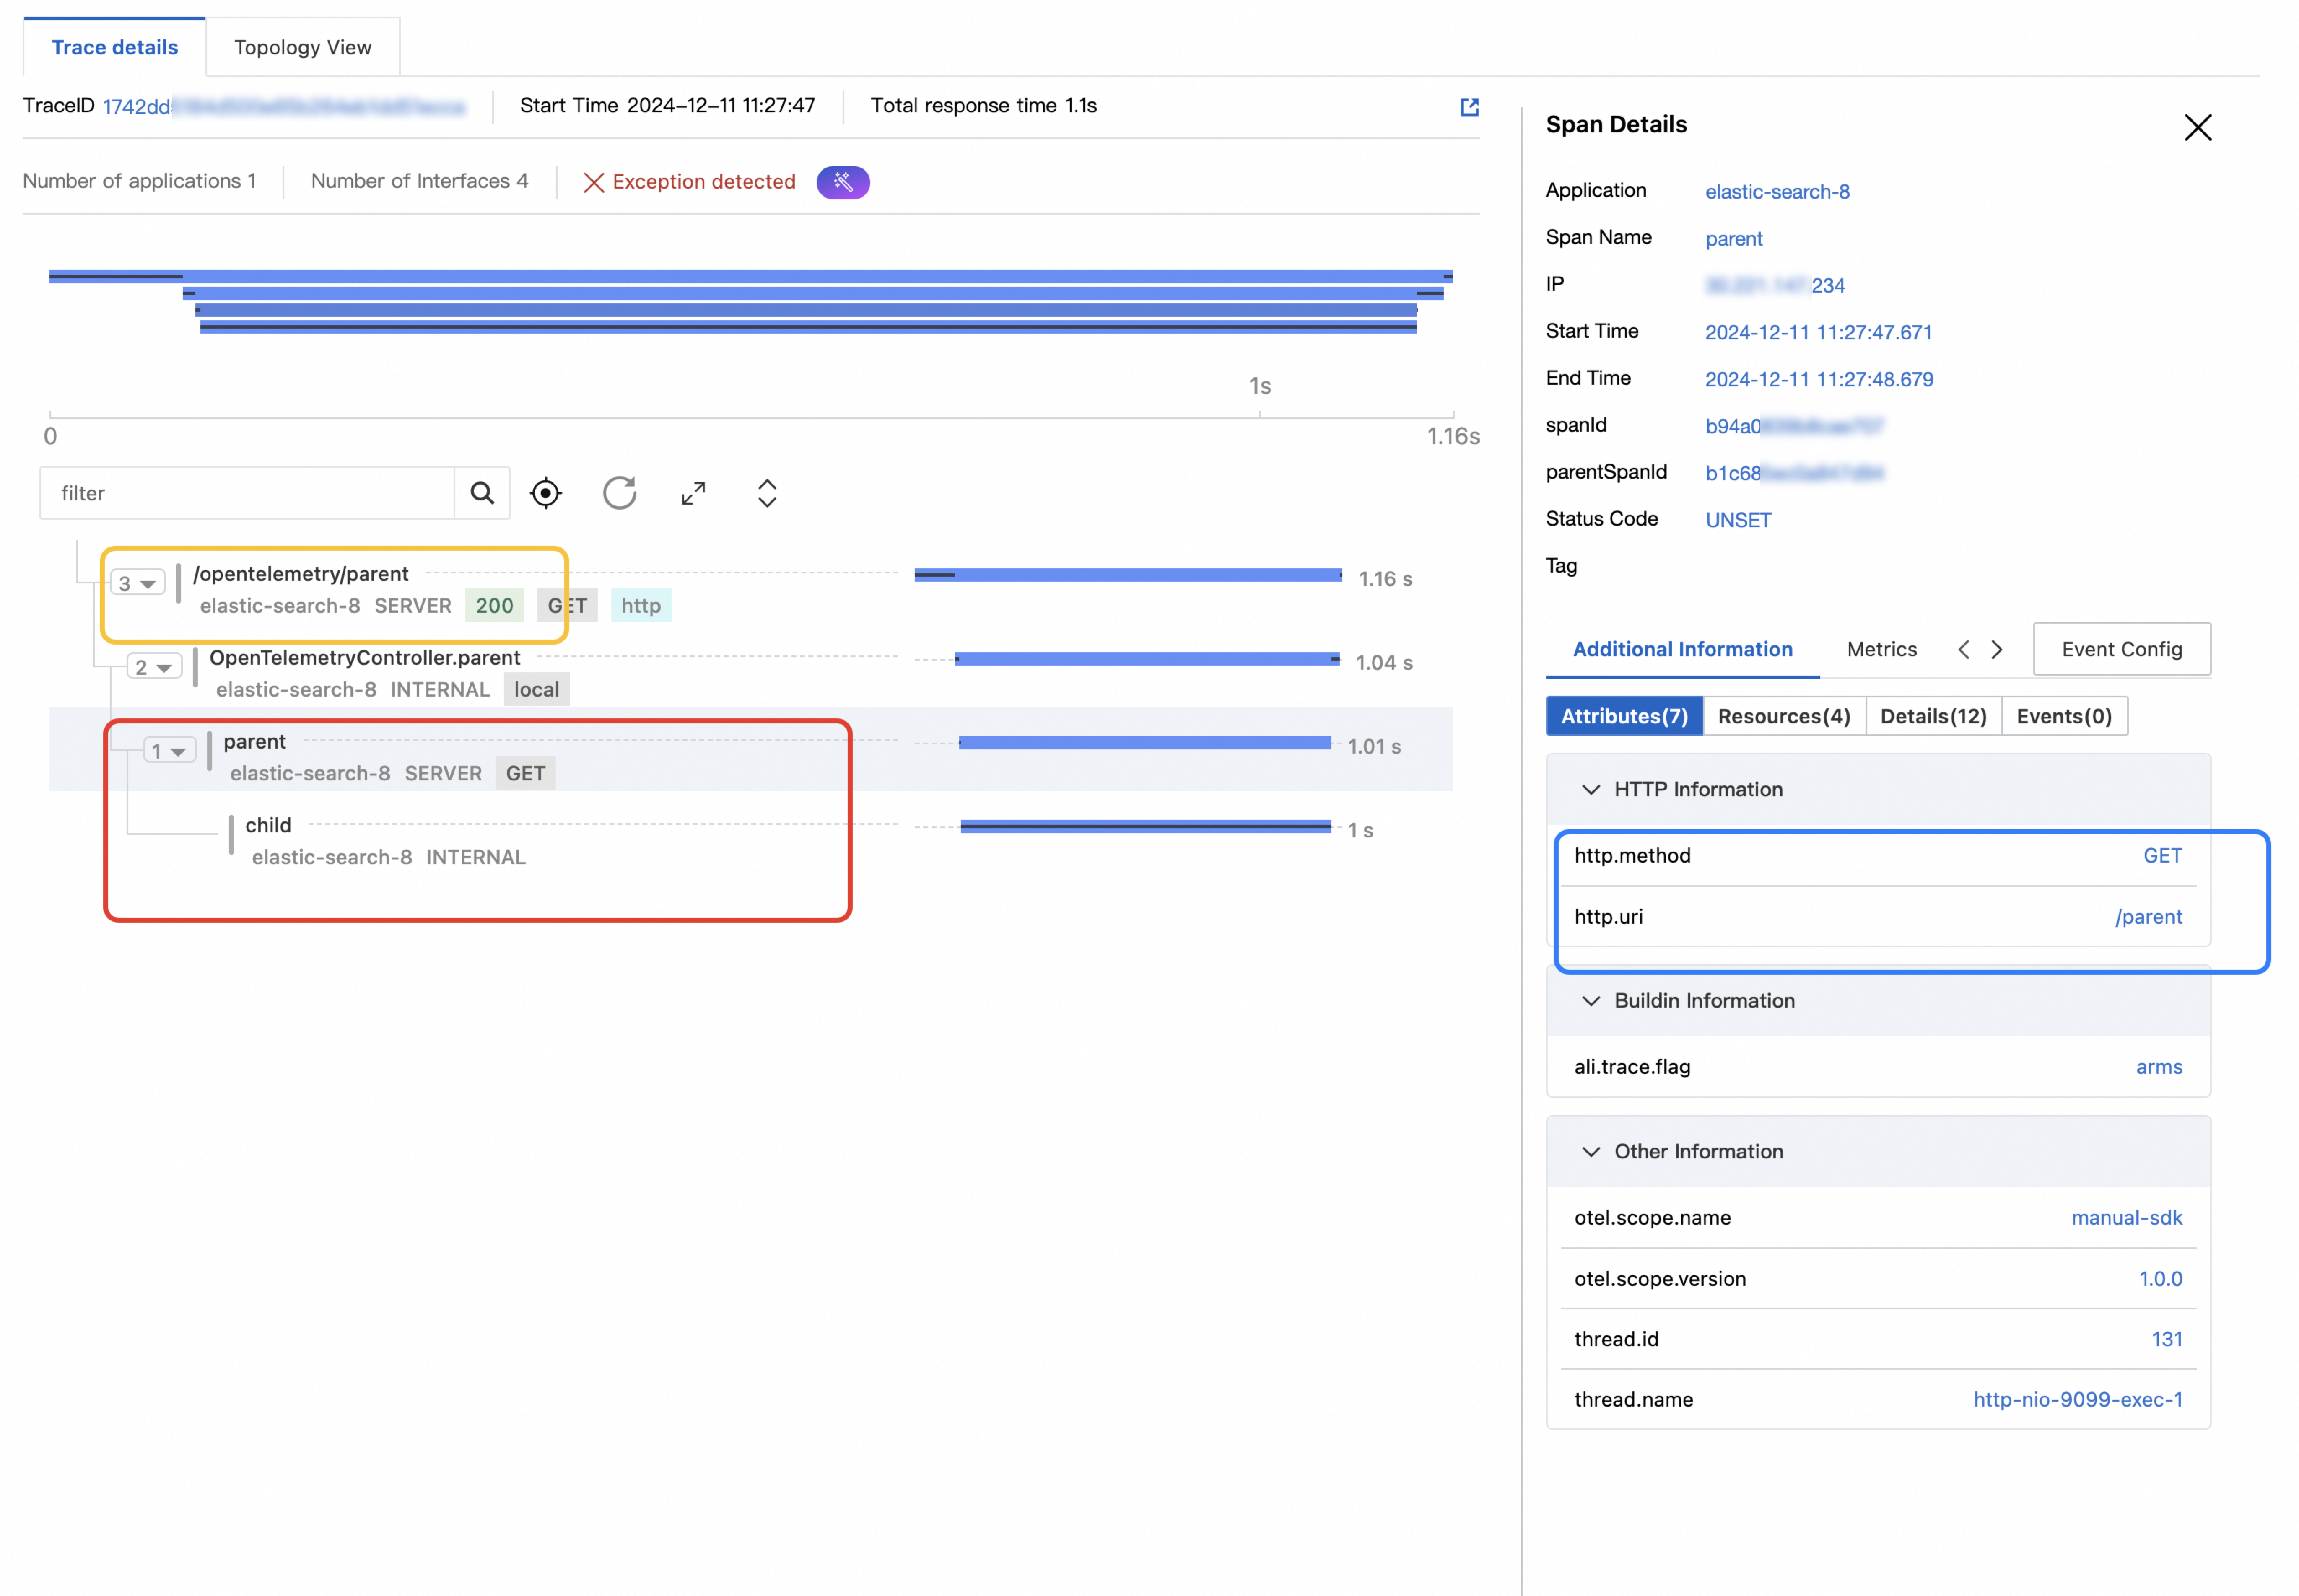
Parent-child spans with attributes and baggage:
SDK-generated spans (red box) and Tomcat auto-instrumented spans (yellow box) belong to the same trace. Attributes set through the SDK are visible on the span details (blue box).
ARMS agent v3.x and earlier
Scheduled task span:
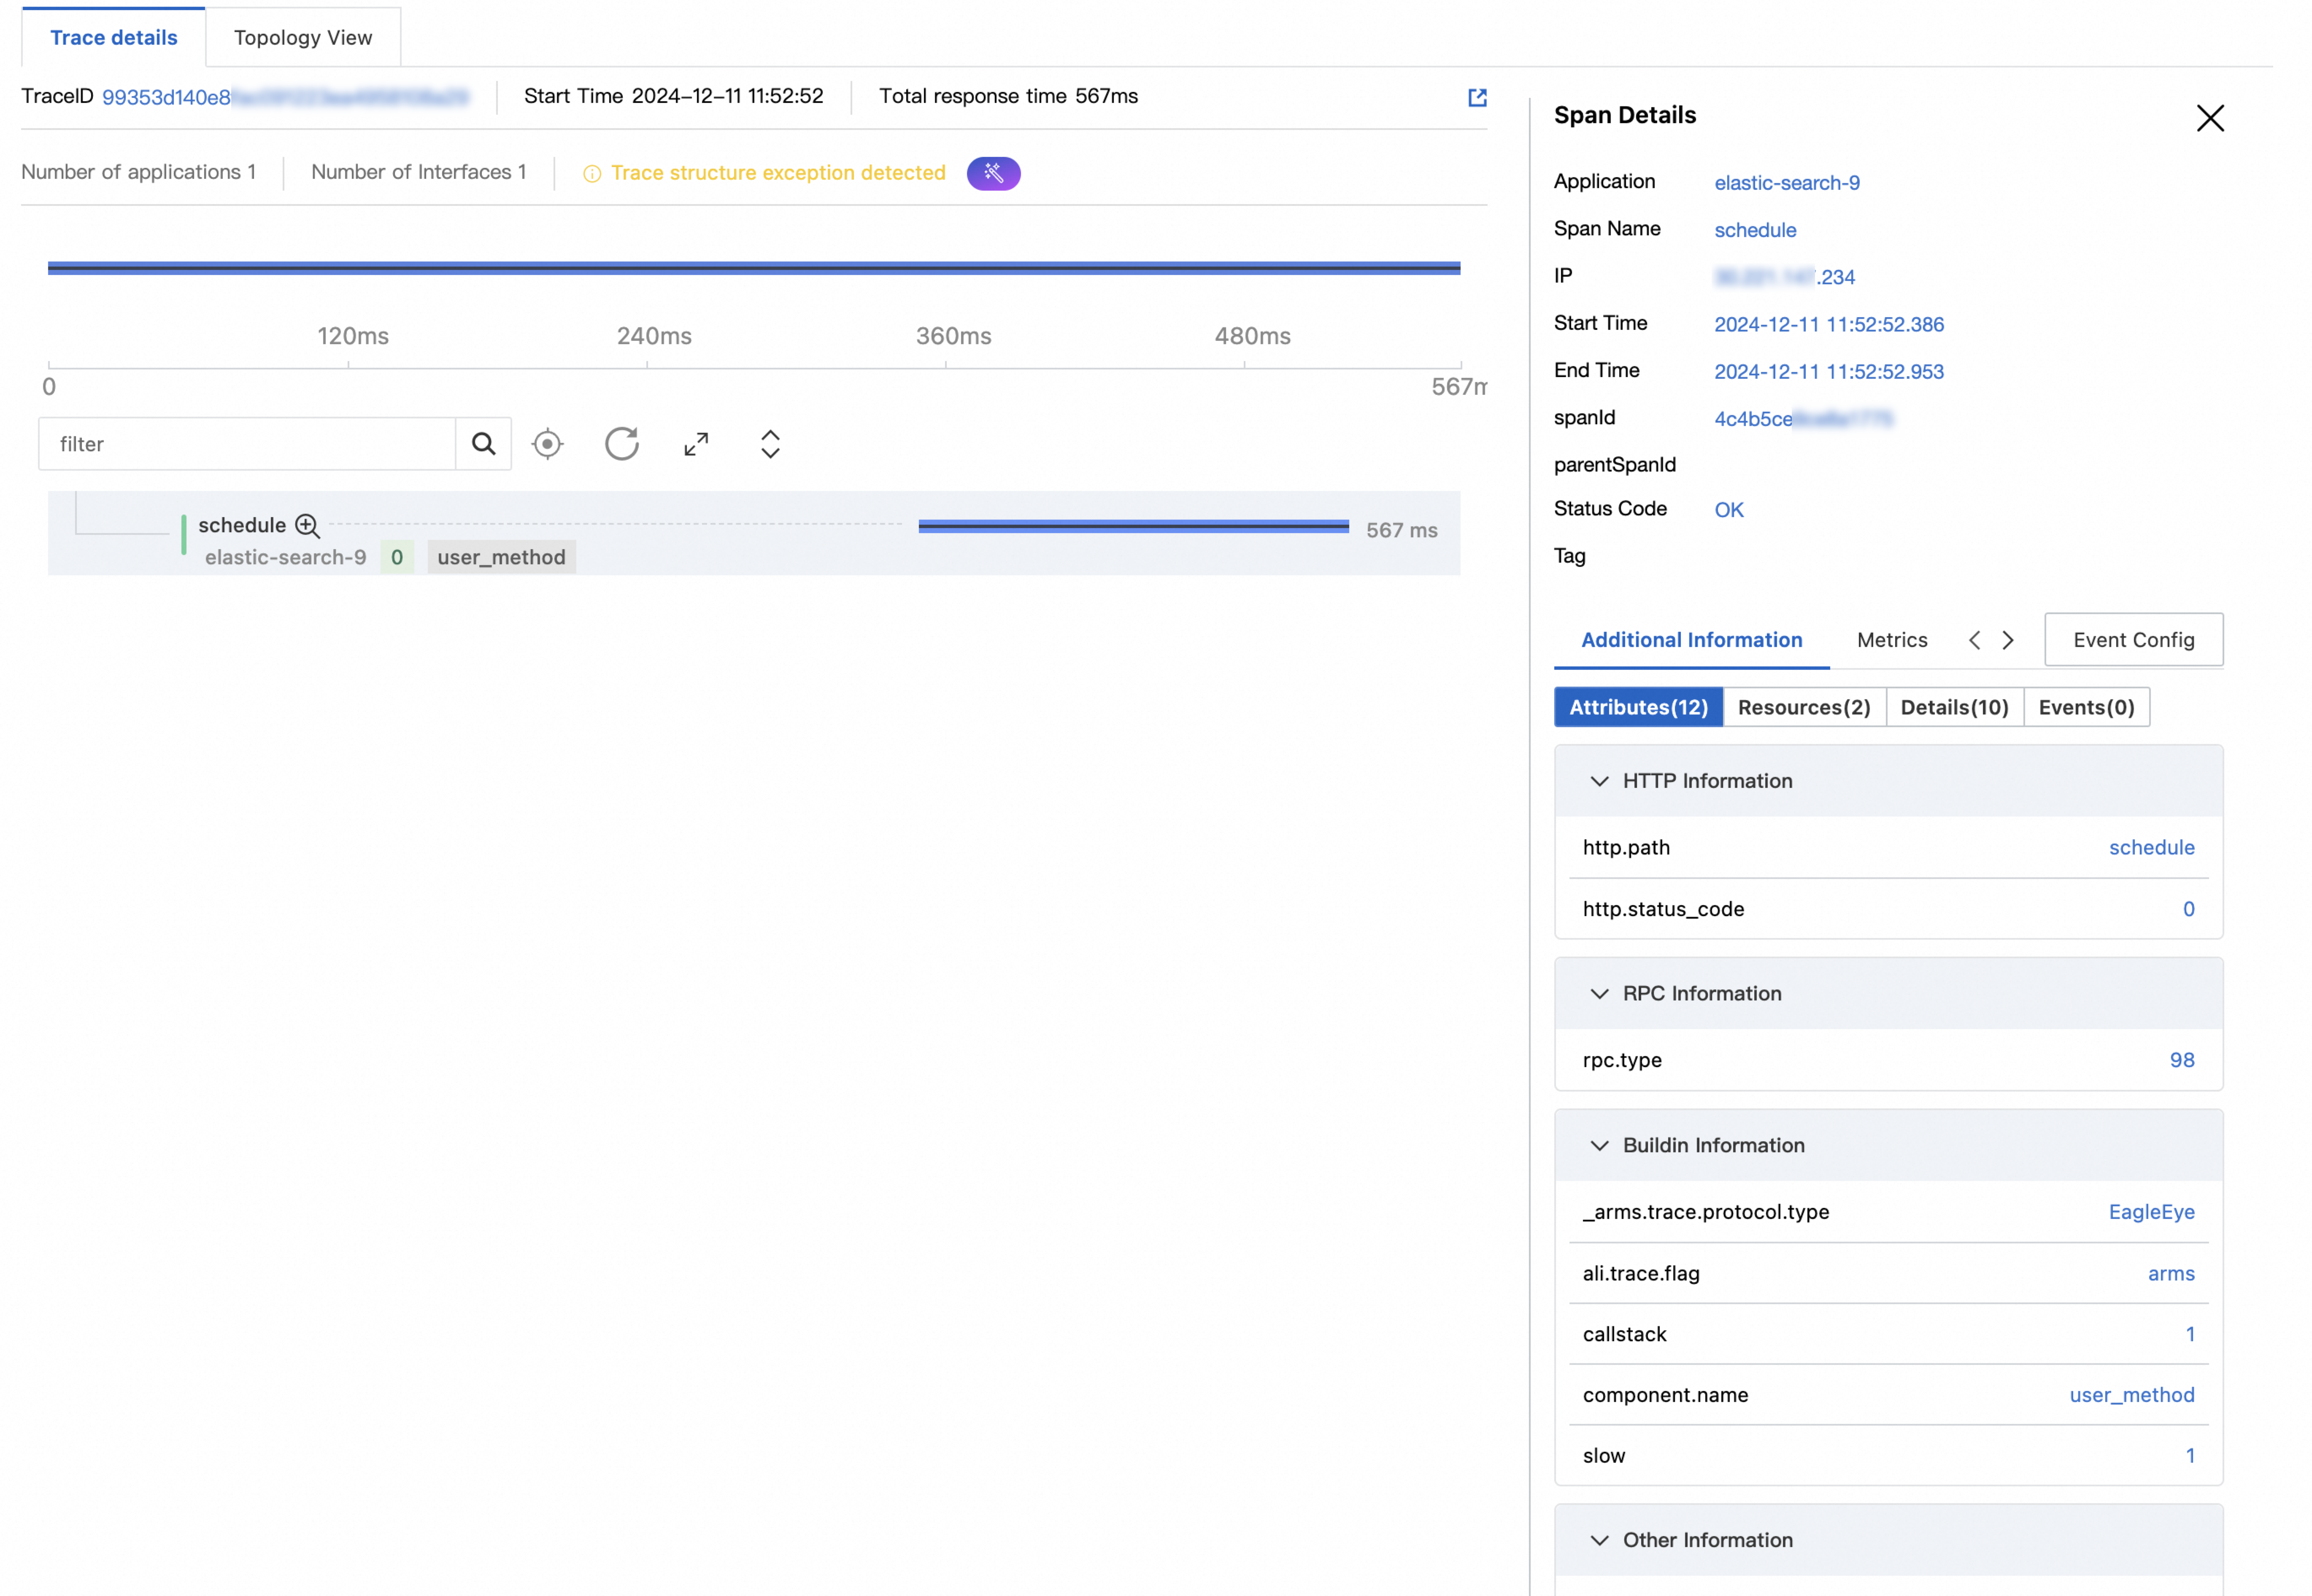
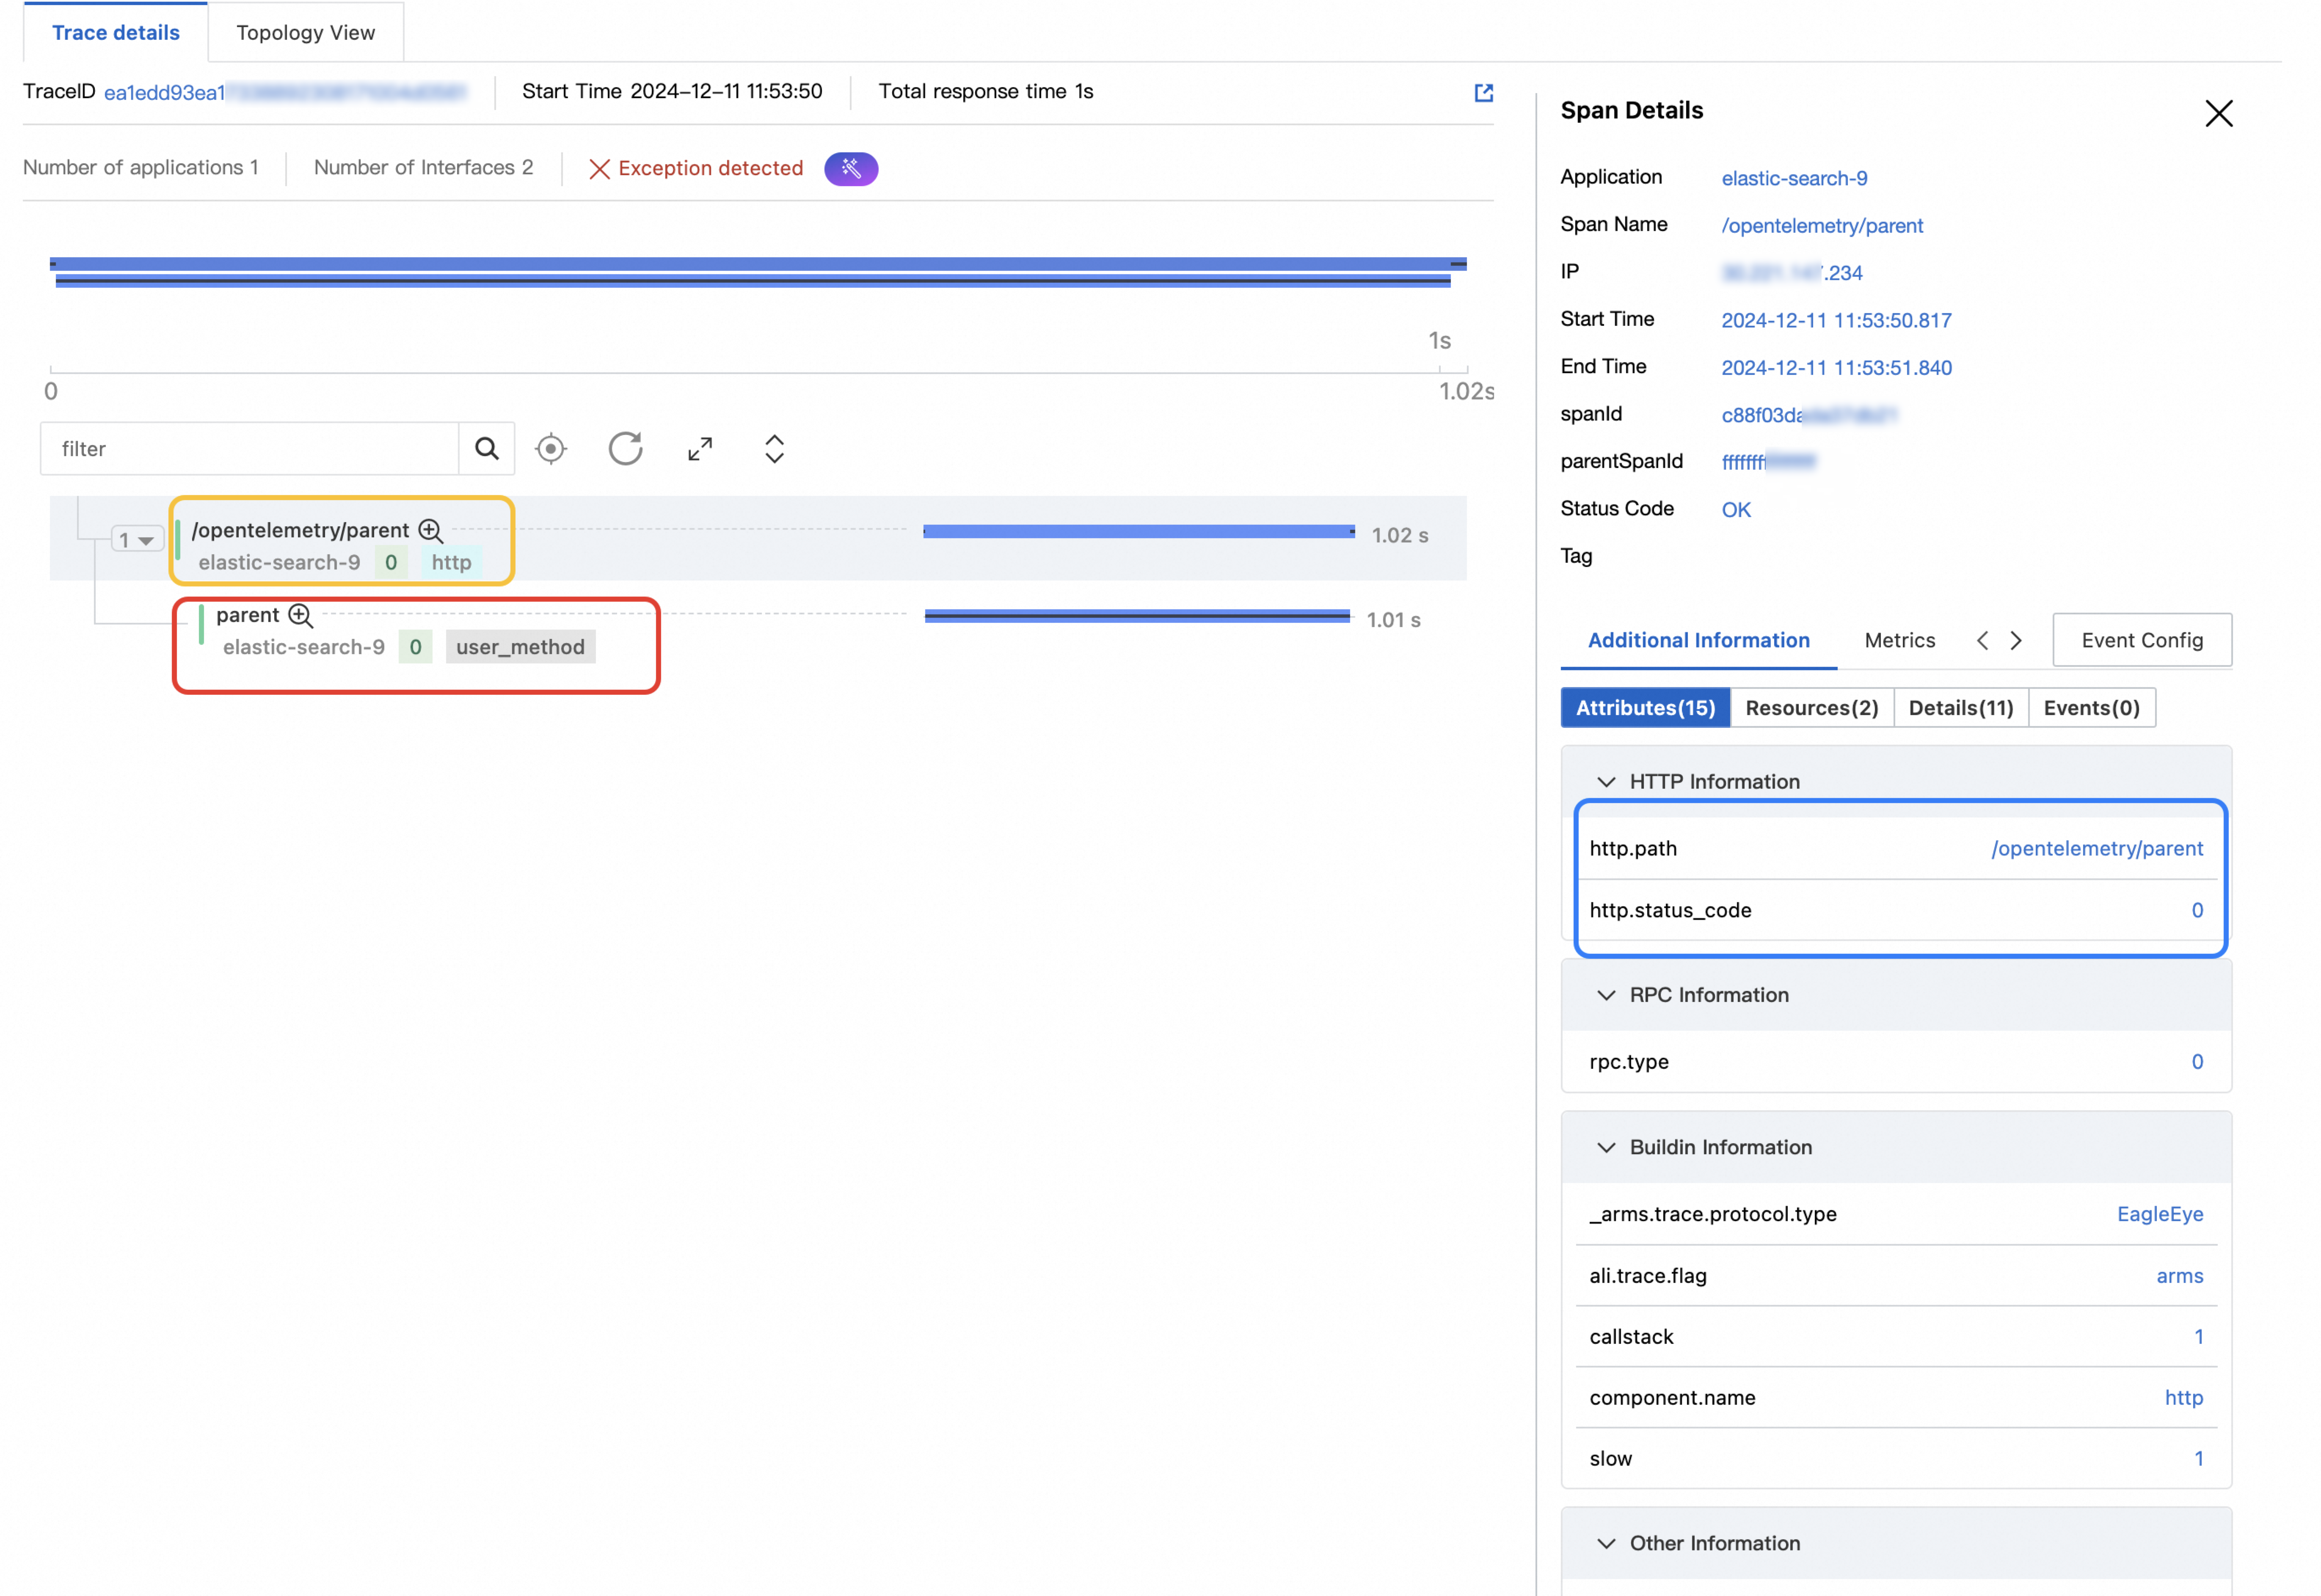
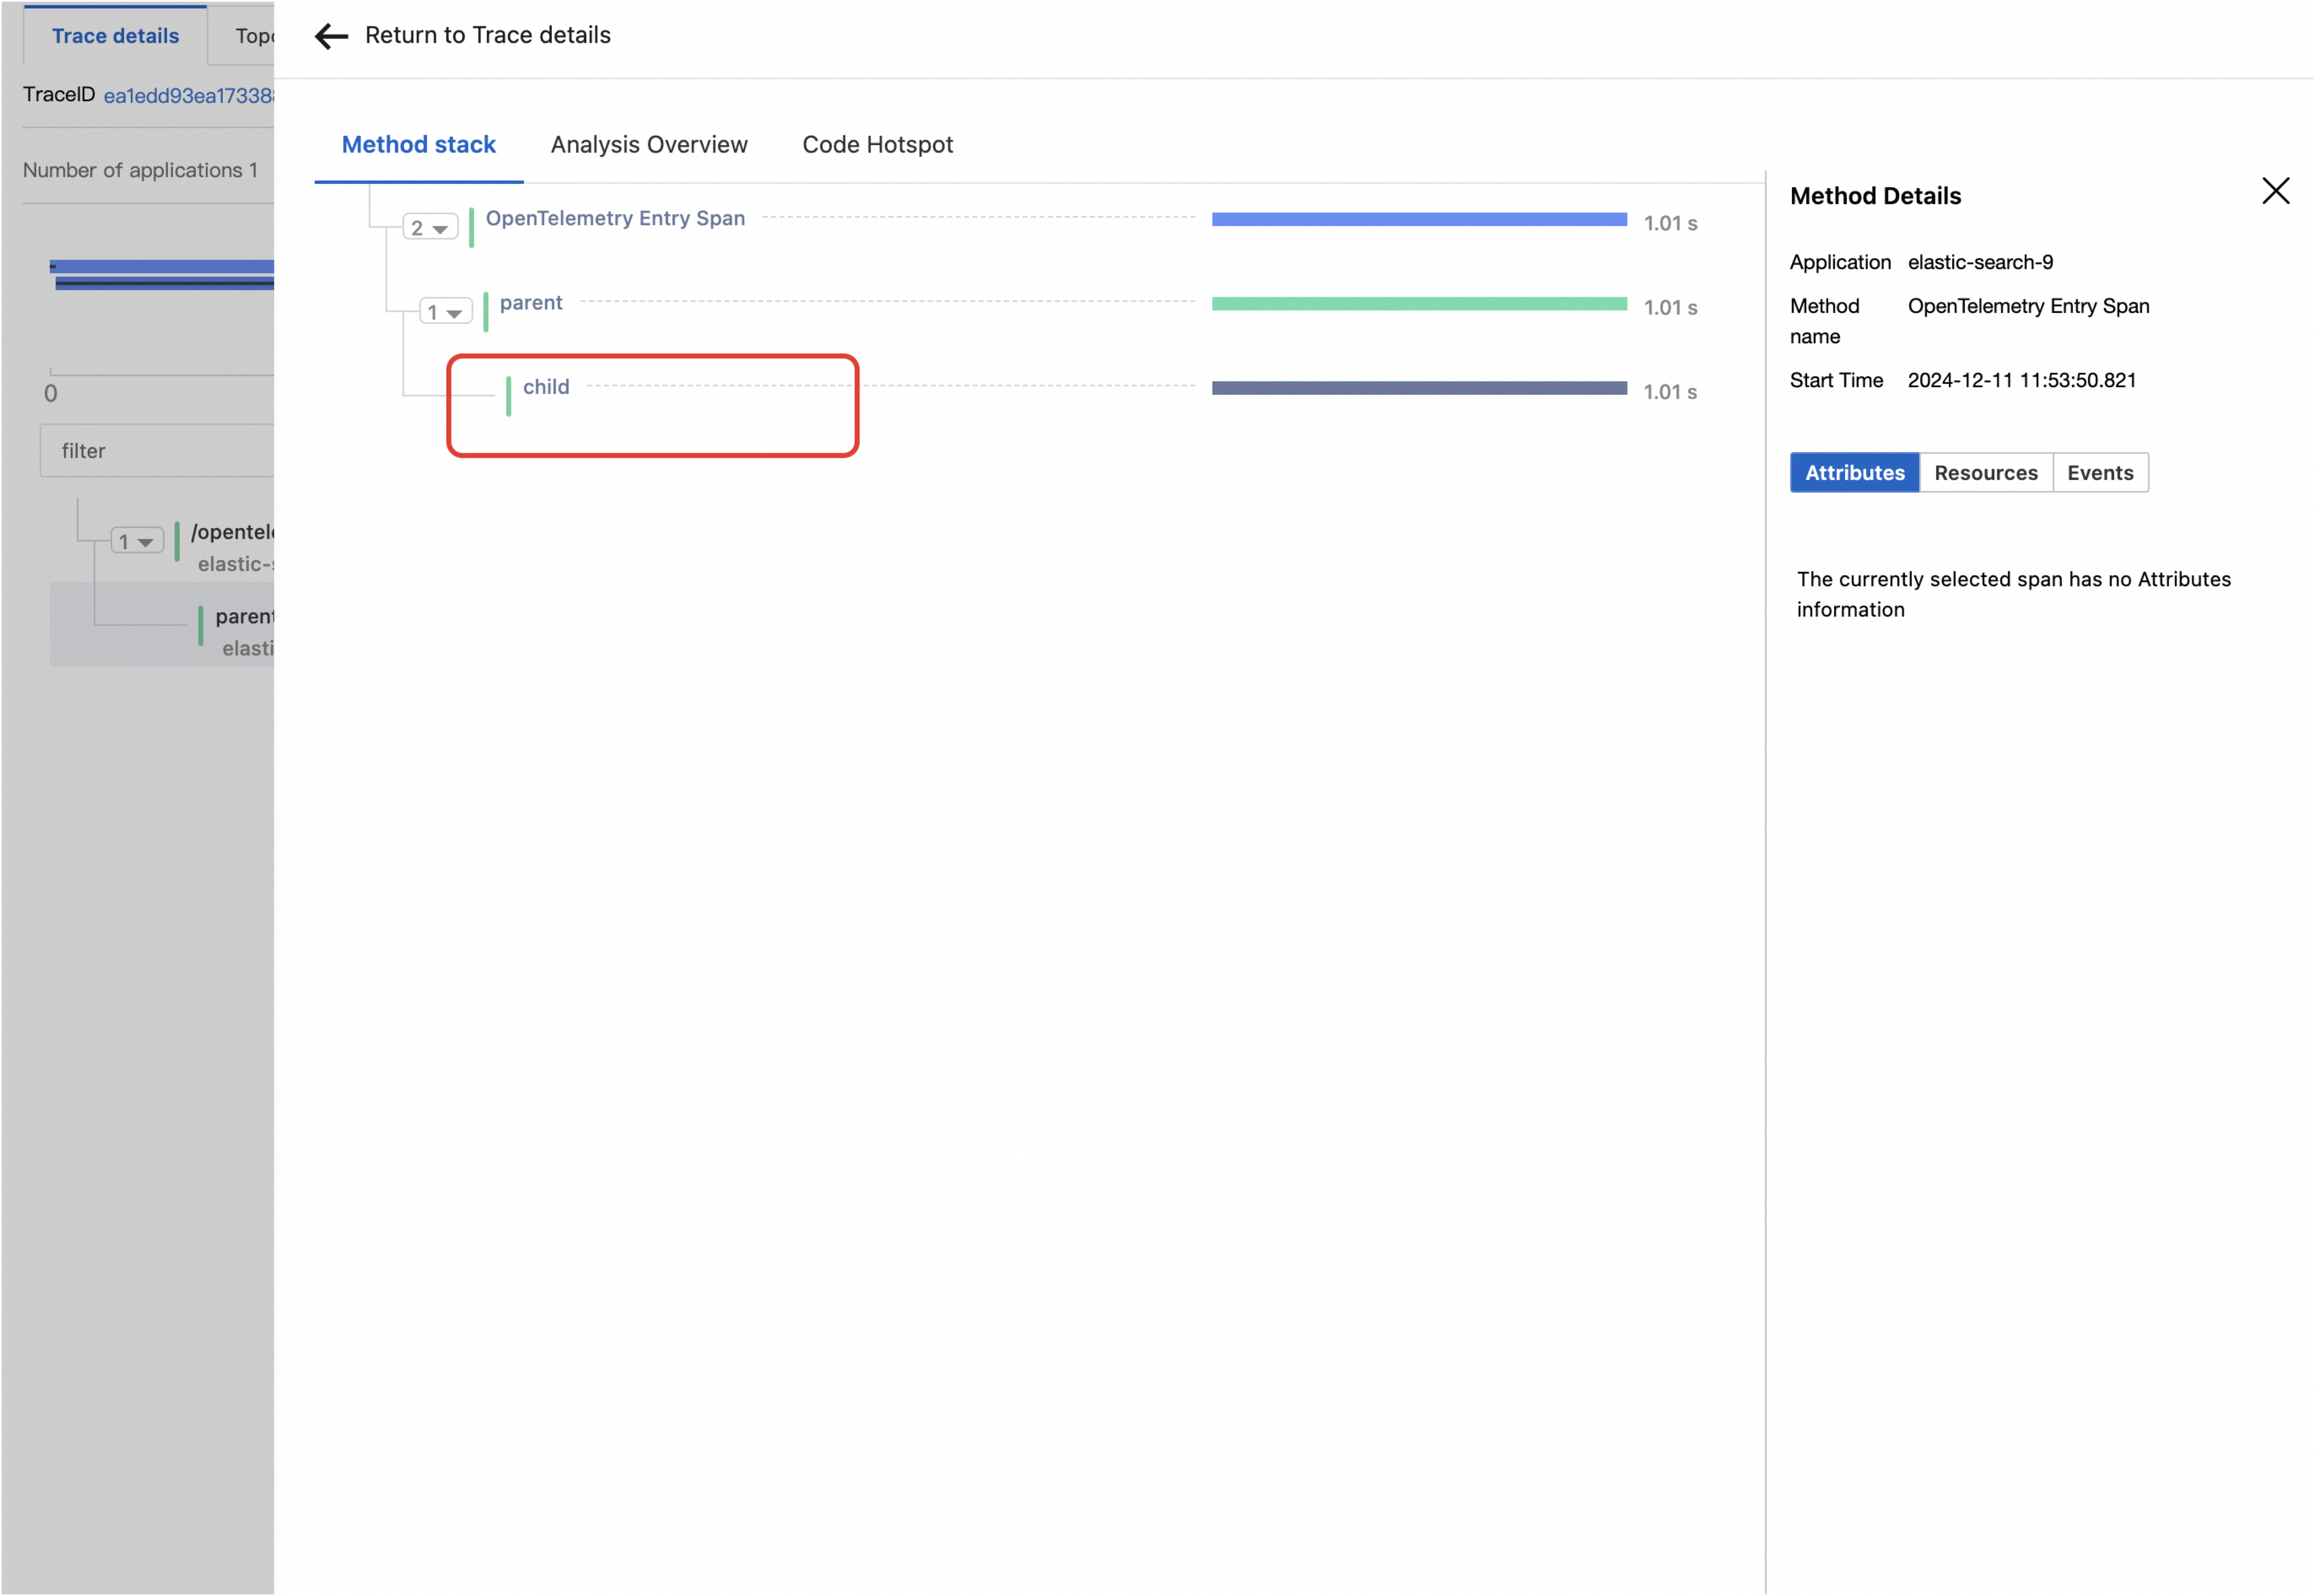
Parent-child spans with attributes:
SDK-generated spans (red box) and Tomcat auto-instrumented spans (yellow box) belong to the same trace. The child span appears as a method stack within the parent span. Attributes set through the SDK are visible (blue box).
What's next
Associate trace IDs with business logs for a Java application -- correlate trace data with application logs for faster root-cause analysis