Slow page loading directly impacts user retention. Application Real-Time Monitoring Service (ARMS) Browser Monitoring helps you identify whether the bottleneck is in the network, backend APIs, or frontend resources, and then drill down to the root cause.
Prerequisites
Before you begin, make sure that you have:
-
An application monitored by ARMS Browser Monitoring. For more information, see Browser monitoring overview
How page loading works
Every page load passes through three phases. Identifying the slow phase narrows the root cause:
| Phase | What to check | What it means |
|---|---|---|
| Network | First Paint Time (Page Load Time Details); DNS Lookup, TCP Connection, SSL Connection (Page Load Waterfall Plot) | Slow page loading may be caused by the network |
| Backend API | DOM Ready (Page Load Time Details); Time to First Byte (TTFB), Content Download (Page Load Waterfall Plot) | Slow page loading may be caused by slow API requests |
| Frontend resources | Fully Loaded Time (Page Load Time Details); DOM Parsing, Resource Download (Page Load Waterfall Plot) | Slow page loading may be caused by slow loading of frontend resources |
The following sections walk through each phase from identification to root cause.
Step 1: Identify the slow phase
-
Log on to the ARMS console. In the left-side navigation pane, choose .
-
On the Browser Monitoring page, select a region in the top navigation bar and click the name of the application that you want to manage.
-
In the left-side navigation pane, choose .
-
Check the Page Load Time Details and Page Load Waterfall Plot sections to identify which phase is slow.
Figure 1. Page Load Time Details section
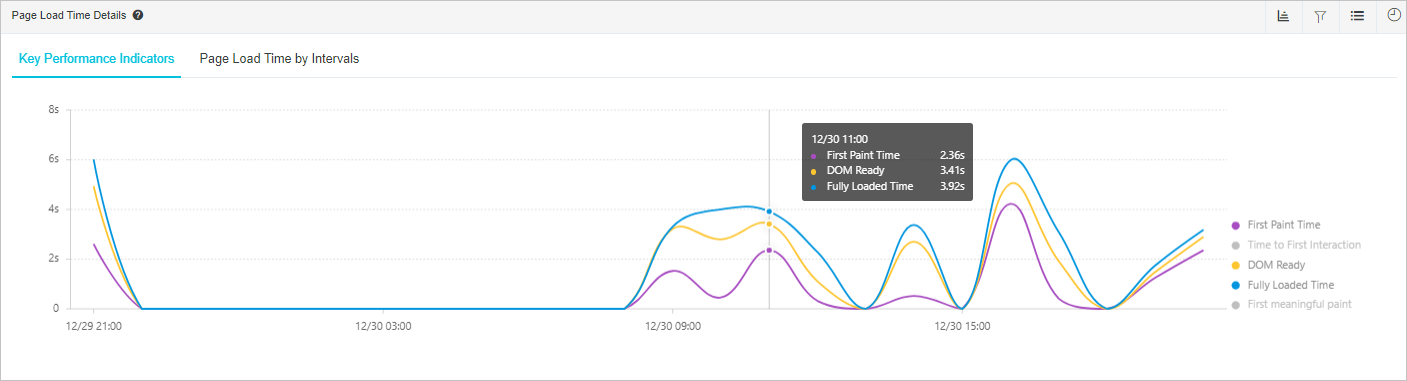
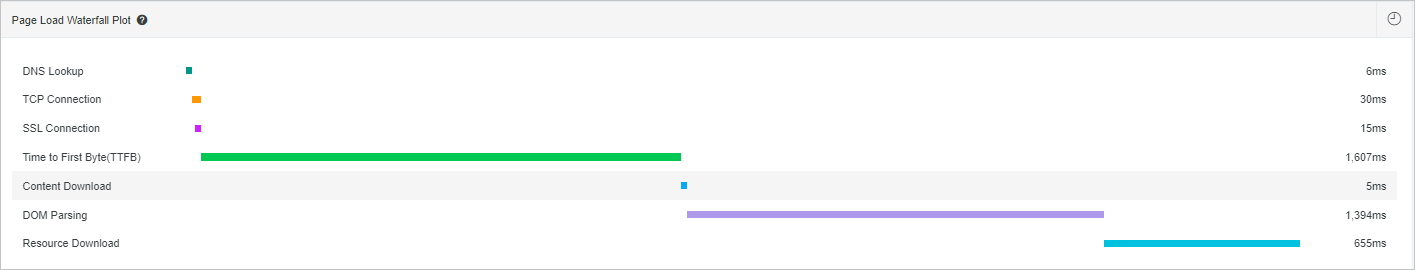
Figure 2. Page Load Waterfall Plot section
-
Match your symptoms to the table below to determine the root cause and next action:
Symptom Metrics with high values Root cause Next step Slow initial rendering First Paint Time; DNS Lookup, TCP Connection, SSL Connection Network issue Check the network Slow content delivery DOM Ready; TTFB, Content Download Slow backend API Go to Step 2: Diagnose slow API requests Slow full page load Fully Loaded Time; DOM Parsing, Resource Download Slow frontend resources Go to Step 3: Trace slow page sessions
Step 2: Diagnose slow API requests
If the metrics point to slow backend APIs, drill down from the API level to the specific backend service causing the delay.
-
In the left-side navigation pane, choose Application > API Details.
-
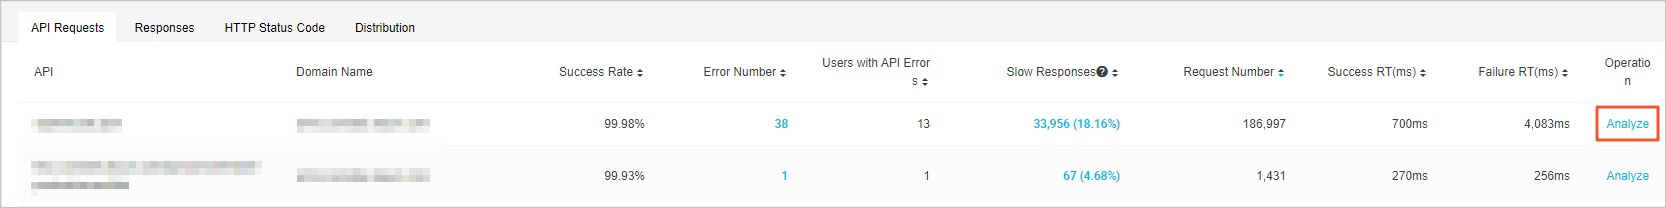
On the API Requests tab, find the slow API and click Analyze in the Operation column.
-
On the API Details tab, click Show Invocation Trace in the upper-right corner of the Request Details section. This displays the overall frontend response time and the backend call sequence diagram.

-
Compare the backend processing time against the overall response time:
Scenario Indication Action Short backend processing, long overall response time The delay occurs between the browser and the server (network transfer) Click View Session in the upper-right corner of the Request Details section to check network connection type, region, browser, device, and operating system Long backend processing time The backend service itself is the bottleneck Click the magnifier icon in the Details column to open the Details dialog box and identify which part of backend tracing is time-consuming to locate the issue
Step 3: Trace slow page sessions
If the metrics point to slow frontend resource loading, use session traces to identify the specific resources causing the delay.
-
In the left-side navigation pane, choose Application > Page Speed.
-
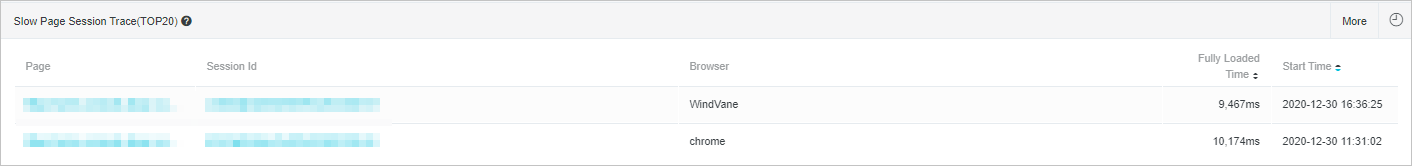
In the Slow Page Session Trace(TOP20) section, click the page name of a slow session.
-
On the Session Traces page, review the Page Resource Loading Waterfall section. The waterfall shows every resource loaded during the session, with timing bars that reveal which resources are slow.
What's next
-
Page loading speed: Learn about page load metrics and how ARMS measures them.
-
Diagnose JS errors by using Browser Monitoring: Troubleshoot JavaScript errors by using Browser Monitoring.