Application Real-Time Monitoring Service (ARMS) lets you control how the agent collects, samples, and reports observability data. From the Custom Configuration tab, adjust sampling policies, toggle agent features, set performance thresholds, choose tracing protocols, and define data redaction rules. Most changes take effect immediately, though some (such as plug-in switches) require an application restart.
The following table summarizes which changes take effect immediately and which require an application restart:
| Configuration area | Takes effect immediately | Restart required |
|---|---|---|
| ARMS agent switch, log level | Yes | No |
| Plug-in switches | No | Yes |
| Collect SQL Bindings, Inner Callstack Reduce | Yes | No |
| Other settings | Varies | Check individual settings |
To configure these settings programmatically, use the SaveTraceAppConfig API.
Prerequisites
Before you begin, make sure that you have:
An ARMS agent installed for your application. For setup instructions, see Application Monitoring overview
Open the custom configuration page
Log on to the ARMS console.
In the left-side navigation pane, choose Application Monitoring > Application List.
Select a region in the top navigation bar, then click the application name.
In the left-side navigation pane, click Application Settings, then click the Custom Configuration tab.
After you modify settings, click Save at the bottom of the page.
Icons in the Language column indicate the application language:
 Java
Java Go
Go Python
Hyphen (-): application monitored through Managed Service for OpenTelemetry.
Sampling rate settings
Sampling determines which traces the agent collects and reports. Trace sampling settings take priority over throttling settings.
ARMS Pro Edition
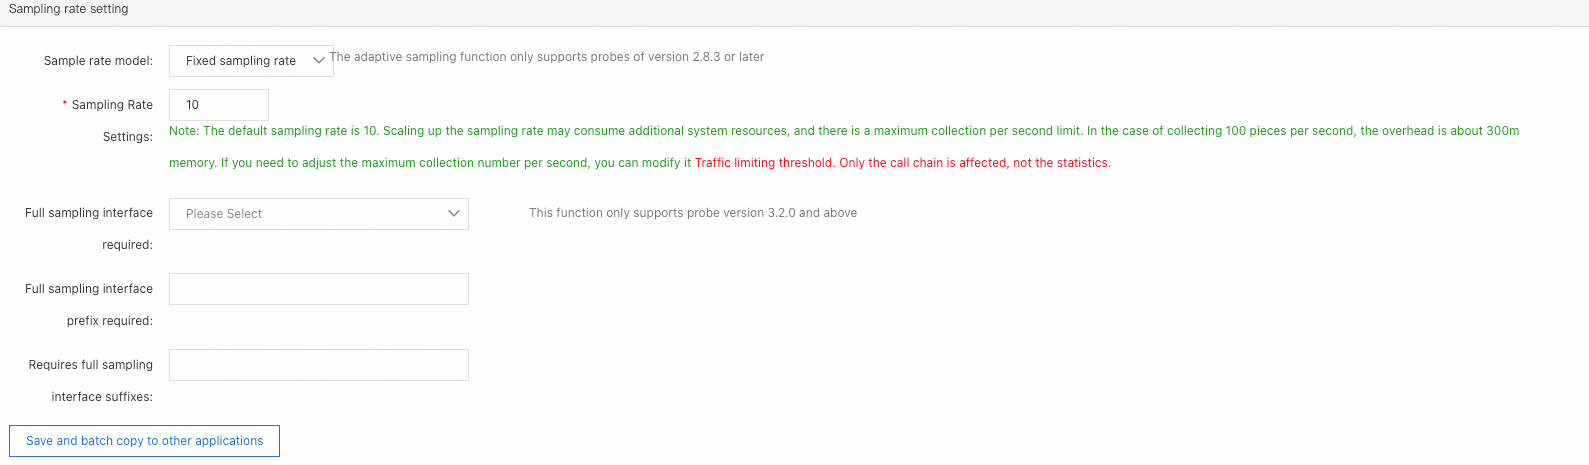
In the Sample rate setting section, specify the sampling policy and target interfaces for traces. For details, see Select a trace sampling mode for the ARMS agent earlier than V3.2.8.
ARMS Basic Edition
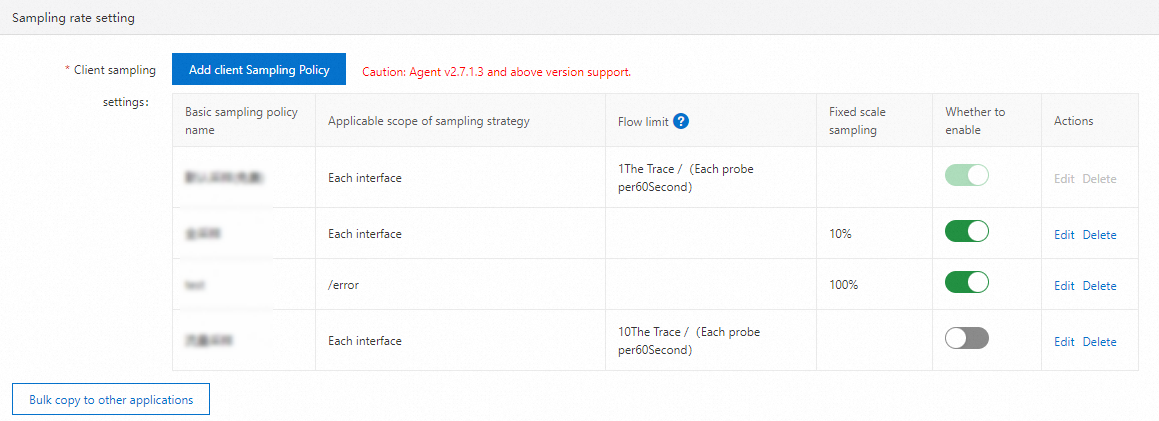
ARMS Basic Edition supports client-side sampling policies. You are charged based on the number of data lines collected. By default, each agent collects one trace per minute for each interface in your account at no charge. To add a custom policy, click Add Client Sampling Policy.
| Parameter | Description |
|---|---|
| Sampling Policy Name | A descriptive name for the policy. |
| Sampling type and Sampling value | Choose one of the following: |
- Fixed proportion sampling: Sample traces at a fixed ratio. Enter a percentage in the Sampling value field (for example, 10%). | |
- Flow limit: Sample a fixed number of traces per time interval. Specify the number of traces each agent collects and the interval (for example, 5 traces every 1 second). | |
| Applicable interface | Choose Each interface to apply the policy to all interfaces, or Specify Interface to target a single interface by name. To target multiple interfaces, create a separate policy for each one. |
When multiple sampling policies are enabled, they take effect in the following priority order:
Default sampling (free tier)
Flow limit (specific interface)
Fixed proportion sampling (specific interface)
Flow limit (all interfaces)
Fixed proportion sampling (all interfaces)
Agent switches and log level
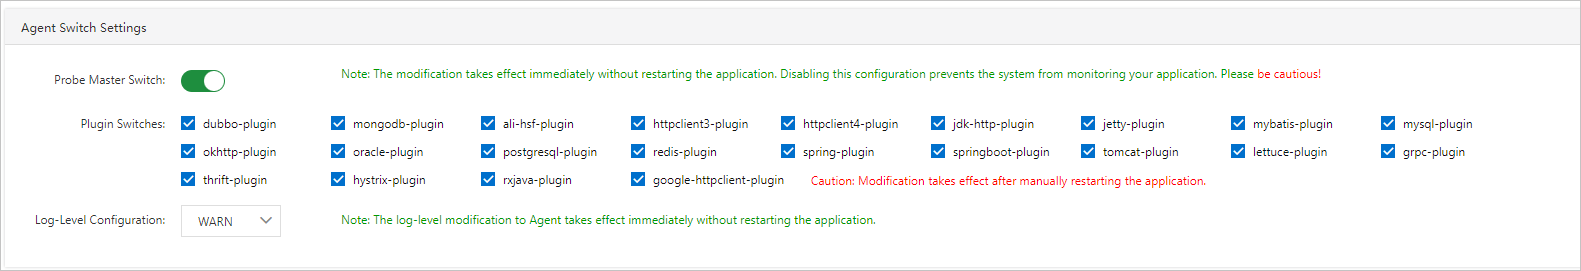
In the Agent Switch Settings section, toggle the ARMS agent switch, individual plug-in switches, and the log level.
Changes to the ARMS agent switch and log level take effect immediately. No restart is required.
If you turn off the ARMS agent switch, ARMS stops monitoring the application entirely. Proceed with caution.
Changes to individual plug-in switches require an application restart to take effect.
Threshold settings
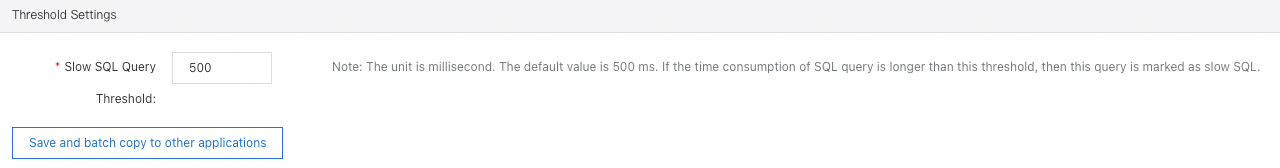
In the Threshold Settings section, configure thresholds for slow SQL queries, interface response time, and request throttling.
Message queue settings
In the Message Queue Configuration section, configure how ARMS monitors message queue operations.
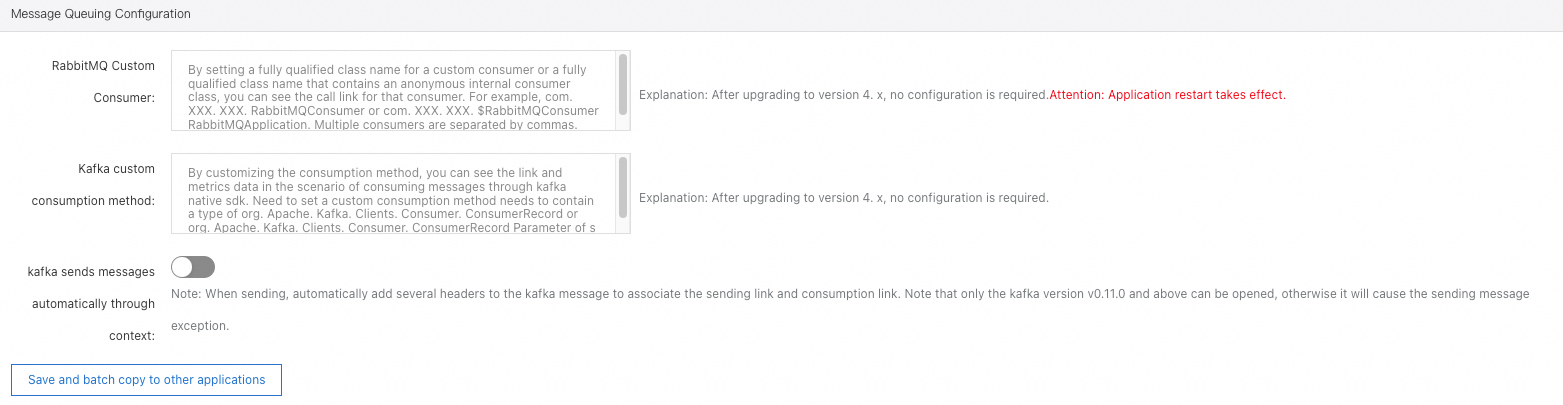
| Setting | Description |
|---|---|
| Custom RabbitMQ consumer | Specify class names for custom consumers or anonymous internal consumers to capture their traces. Separate multiple class names with commas (,). |
| Custom Kafka consumption method | Specify a custom consumption method to capture traces and metrics when consuming messages through native Kafka SDKs. |
| kafka sends automatic message pass-through context | Automatically add headers to Kafka messages that link delivery traces with consumption traces. |
Agent collection settings
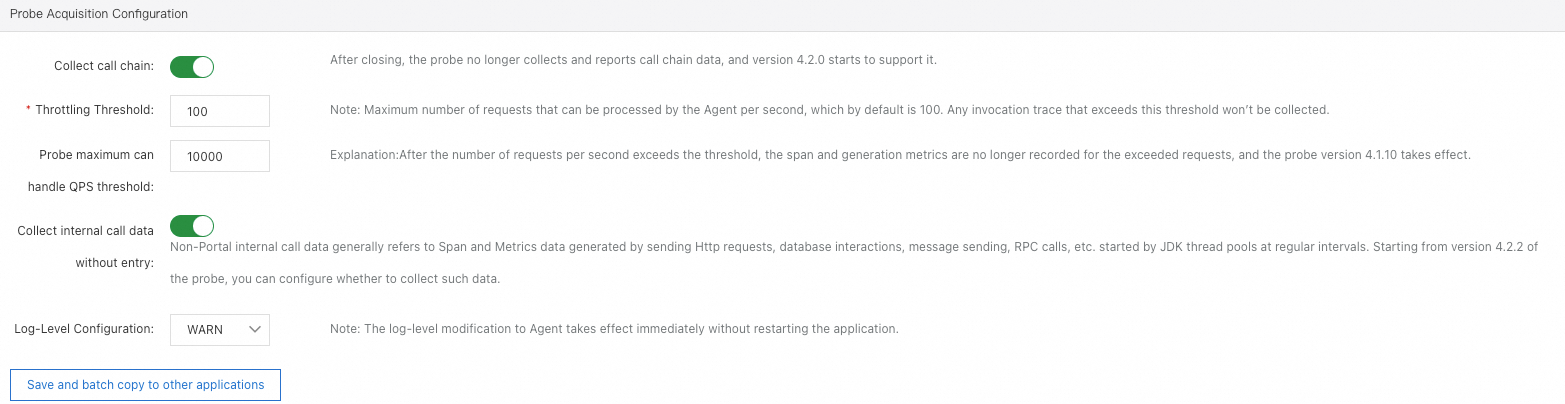
| Setting | Description | Default |
|---|---|---|
| Collect call chain | Report trace data. Disabling stops all trace reporting. | On |
| Throttling Threshold | Maximum requests the agent processes per second. Trace data for requests exceeding this limit is not collected. | 100 |
| Probe maximum can handle QPS threshold | Maximum requests the agent can handle per second. The system may adjust this value by up to 5% for performance optimization. Requests exceeding this threshold are not monitored: no spans, no metrics, and no trace IDs in logs. | -- |
| Collect internal call data without entry | Collect span and metric data for internal calls that lack an entry point, such as scheduled HTTP requests, database queries, message sends, or RPC calls through JDK thread pools. | -- |
| Log-Level Configuration | Adjust the agent log level for troubleshooting. | -- |
Trace sampling settings take priority over throttling settings. When both are configured, the sampling policy is evaluated first.
Interface call settings
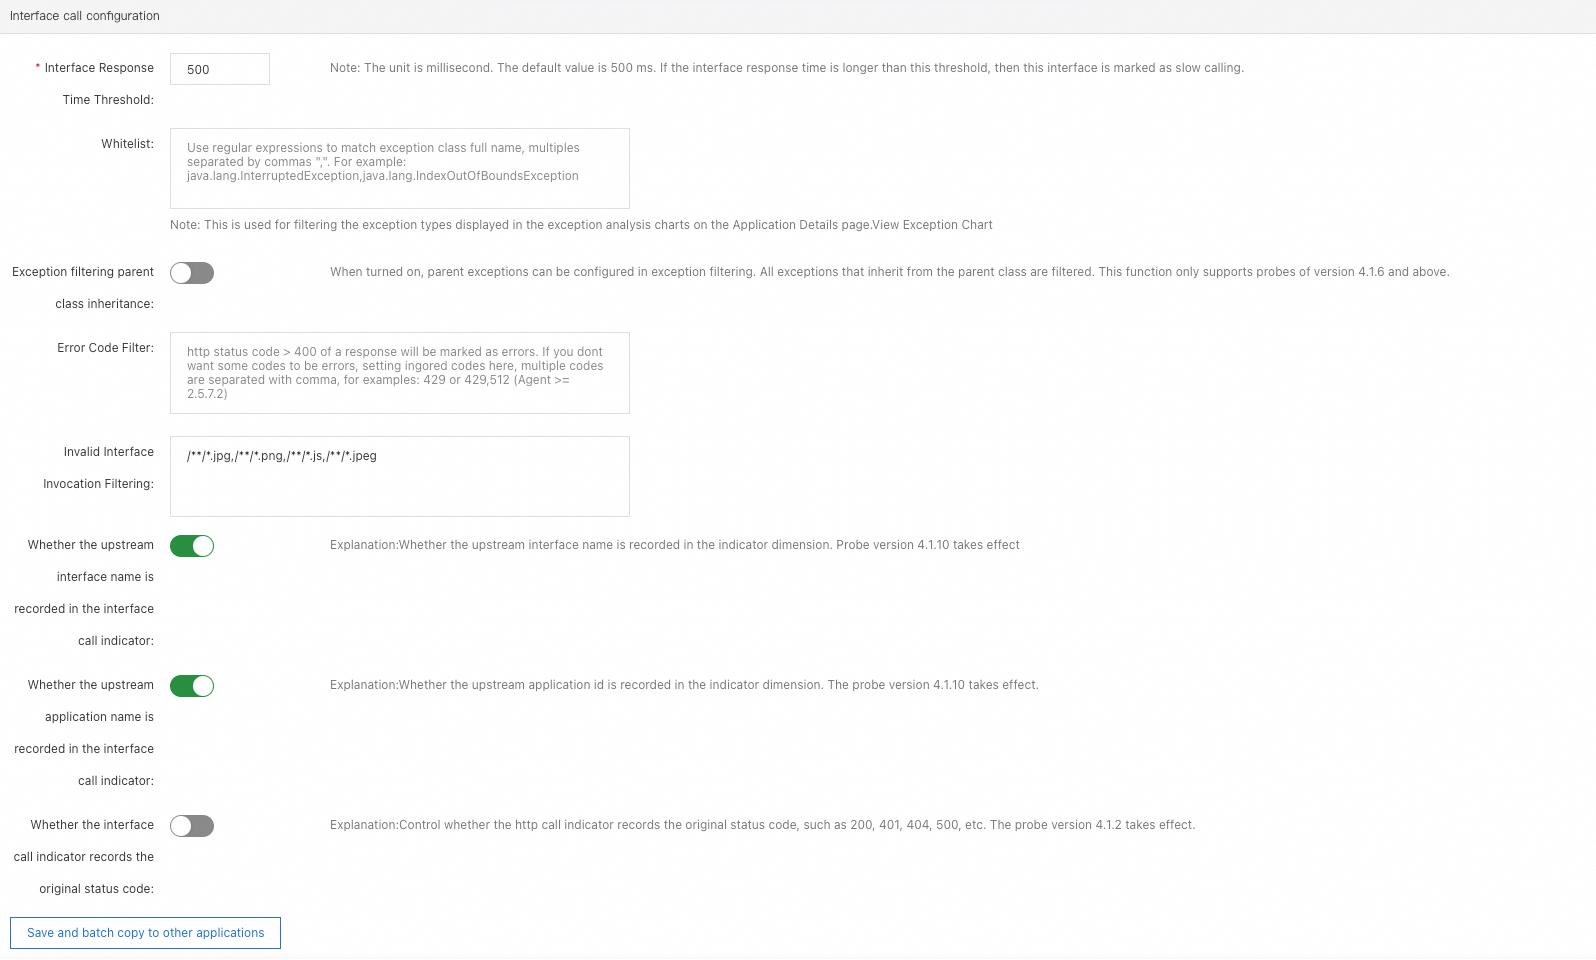
| Setting | Description |
|---|---|
| Interface Response Time Threshold | Mark requests as slow when the response time exceeds this value. |
| Whitelist | Specify exception classes to exclude from the Overview and Scenario-based Analysis > Exceptions tabs. Exceptions that meet the filtering criteria will not be displayed in the ARMS console. |
| Exception filtering parent class inheritance | When enabled, if a collected exception is a subclass of a whitelisted exception class, it is also filtered. |
| Error Code Filter | By default, HTTP status codes greater than 400 are classified as errors. Add status codes to this list to exclude them from error classification. |
| Invalid Interface Invocation Filtering | Enter interface names to hide from the console. The ARMS agent stops reporting observability data for these interfaces. |
| Whether the upstream interface name is recorded in the interface call indicator / Whether the upstream application name is recorded in the interface call indicator | Record upstream application and interface names in interface metrics. This affects upstream/downstream trace data in service views. When an application has many upstream callers, enabling this setting can significantly increase metric volume and cost. |
| Whether the interface call indicator records the original status code | Record the original HTTP response code in interface-related metrics. |
Pool monitoring settings
In the Pooled monitoring settings section, configure thread pool and connection pool monitoring.
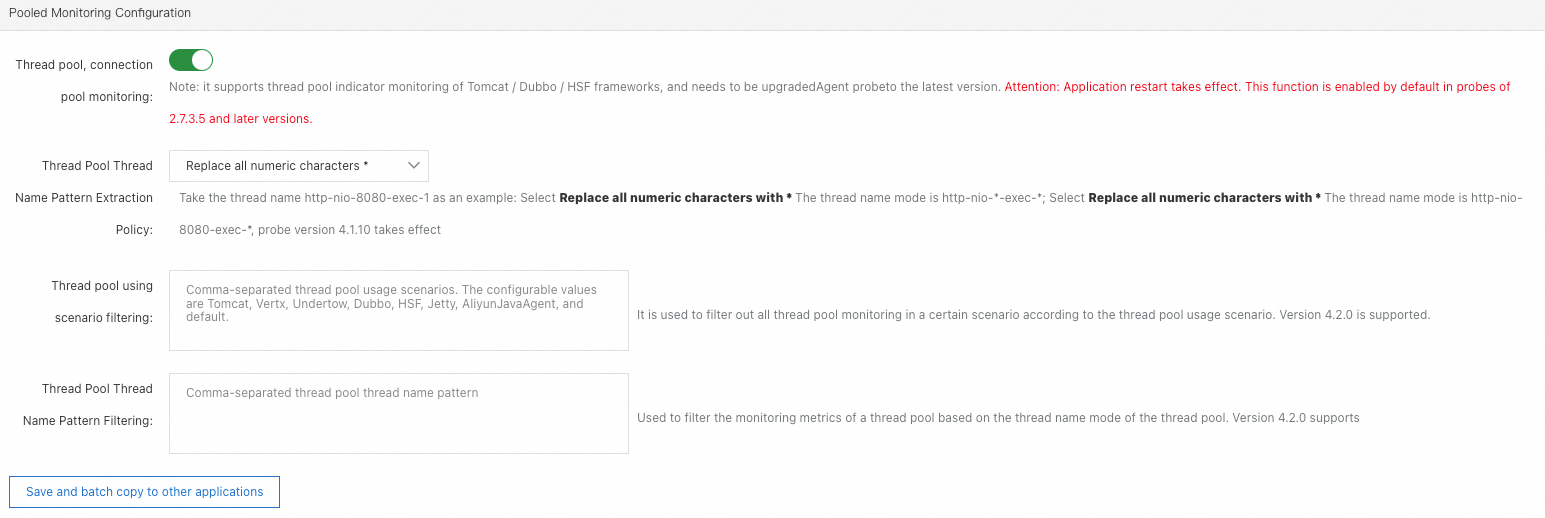
| Setting | Description |
|---|---|
| Thread pool and connection pool monitoring | Monitor thread pool metrics in frameworks such as Apache Tomcat, Apache Dubbo, and High-speed Service Framework (HSF). Requires the latest ARMS agent version. |
| Thread Pool Thread Name Pattern Extraction Policy | Controls how thread names are normalized. By default, all numeric characters in thread names are replaced with * (for example, http-nio-8080-exec-1 becomes http-nio-*-exec-*). Switch to end-only replacement when multiple Dubbo providers with different ports would otherwise be aggregated into a single pool. |
| Thread pool using scenario filtering / Thread Pool Thread Name Pattern Filtering | Exclude specific thread pools from metric collection based on usage scenario or thread name pattern. These settings only take effect for the ARMS agent for Java v4.2.0 and later. |
Thread pool usage scenarios include: Tomcat, Vert.x, Undertow, Dubbo, Jetty, AliyunJavaAgent (the agent's own thread pool), and default (all other unclassified pools).
Span attributes settings
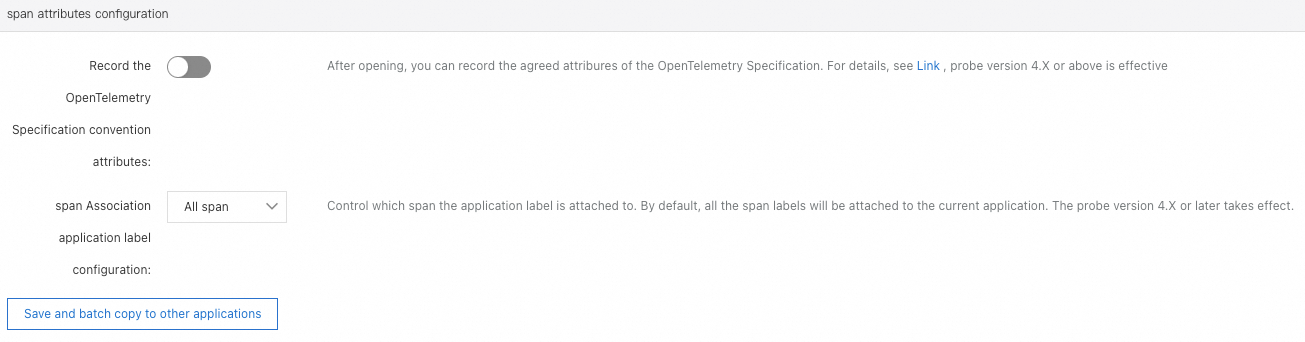
| Setting | Description |
|---|---|
| Document the OTel Spec convention attributes | Record the attributes defined by the OpenTelemetry Specification in spans. Disabled by default to reduce data volume. Enable this if you need the standard semantic convention attributes for each plug-in type. |
Advanced settings
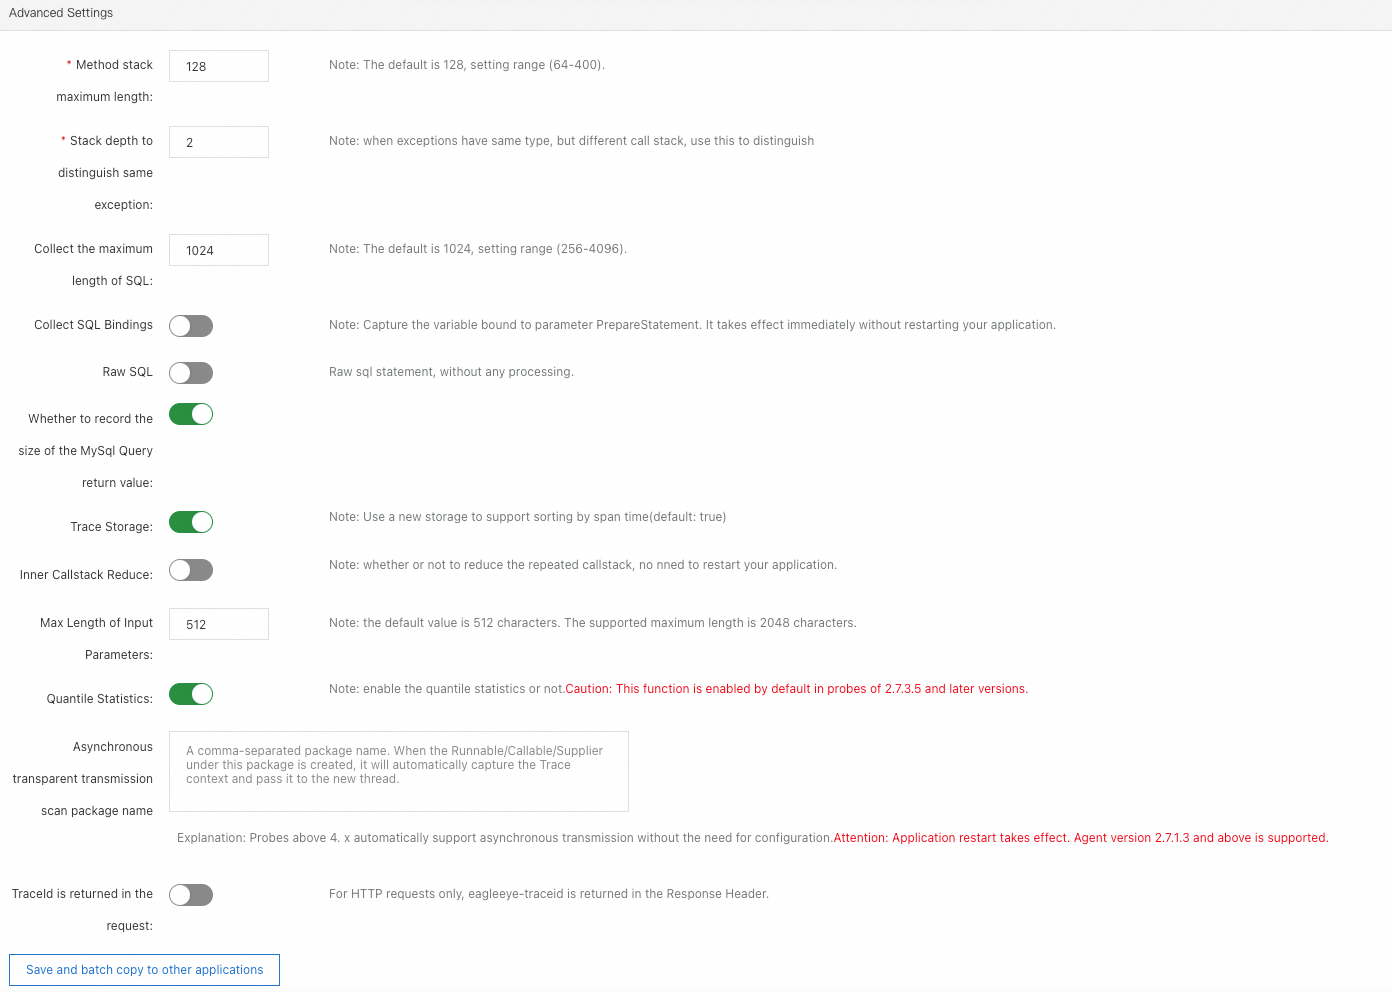
| Setting | Default | Valid range | Restart required | Description |
|---|---|---|---|---|
| Method stack maximum length | 128 entries | Up to 400 | -- | Maximum number of entries in a method stack. |
| Stack depth to distinguish same exception | -- | -- | -- | Stack depth used to differentiate exceptions of the same type. Set this to the call depth where the first difference occurs. |
| Collect the maximum length of SQL | 1024 characters | 256--4096 | -- | Maximum length of captured SQL statements. |
| Collect SQL Bindings | Off | On / Off | No | Capture variable values bound to PreparedStatement parameters. Only applies when variable values are set for PreparedStatement parameters. |
| Raw SQL | -- | On / Off | -- | Specify whether to perform operations other than truncation on SQL statements. |
| Whether to record the size of the MySql Query return value | Off | On / Off | -- | Record the size of MySQL query return values. |
| Trace Storage | On | On / Off | -- | Use the time-sorted storage format for traces. |
| Inner Callstack Reduce | Off | On / Off | No | Simplify duplicated calls such as for-loops. |
| Max Length of Input Parameters | 512 characters | Up to 2048 | -- | Maximum length of captured input parameter values. |
| Quantile Statistics | Off | On / Off | -- | Enable quantile statistics (percentiles, medians, quartiles) for performance analysis. |
| Automatic pass-through asynchronous | -- | On / Off | -- | Automatically propagate async context when tasks are submitted through a thread pool. |
| Asynchronous transparent transmission scan package name | -- | Package names | -- | Add scan packages for async context propagation. When a Runnable, Callable, or Supplier object is created in a scanned package, the agent captures the current thread's trace context and propagates it to async threads. Requires ARMS agent v2.7.1.3 or later. |
| TraceId is returned in the request | Off | On / Off | -- | Return the eagleeye-traceid field in HTTP response headers. |
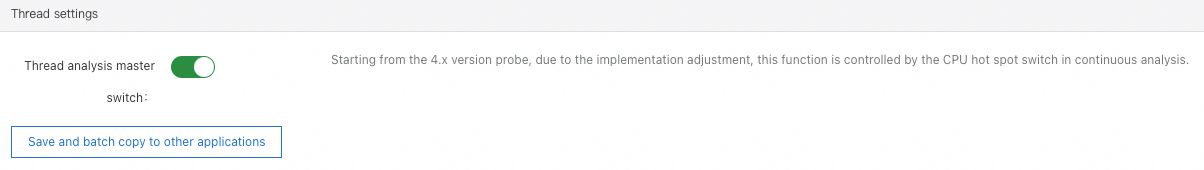
Thread settings
In the Thread settings section, toggle the Thread analysis master switch to enable or disable thread analysis.
This feature is available only in Application Monitoring Pro Edition.
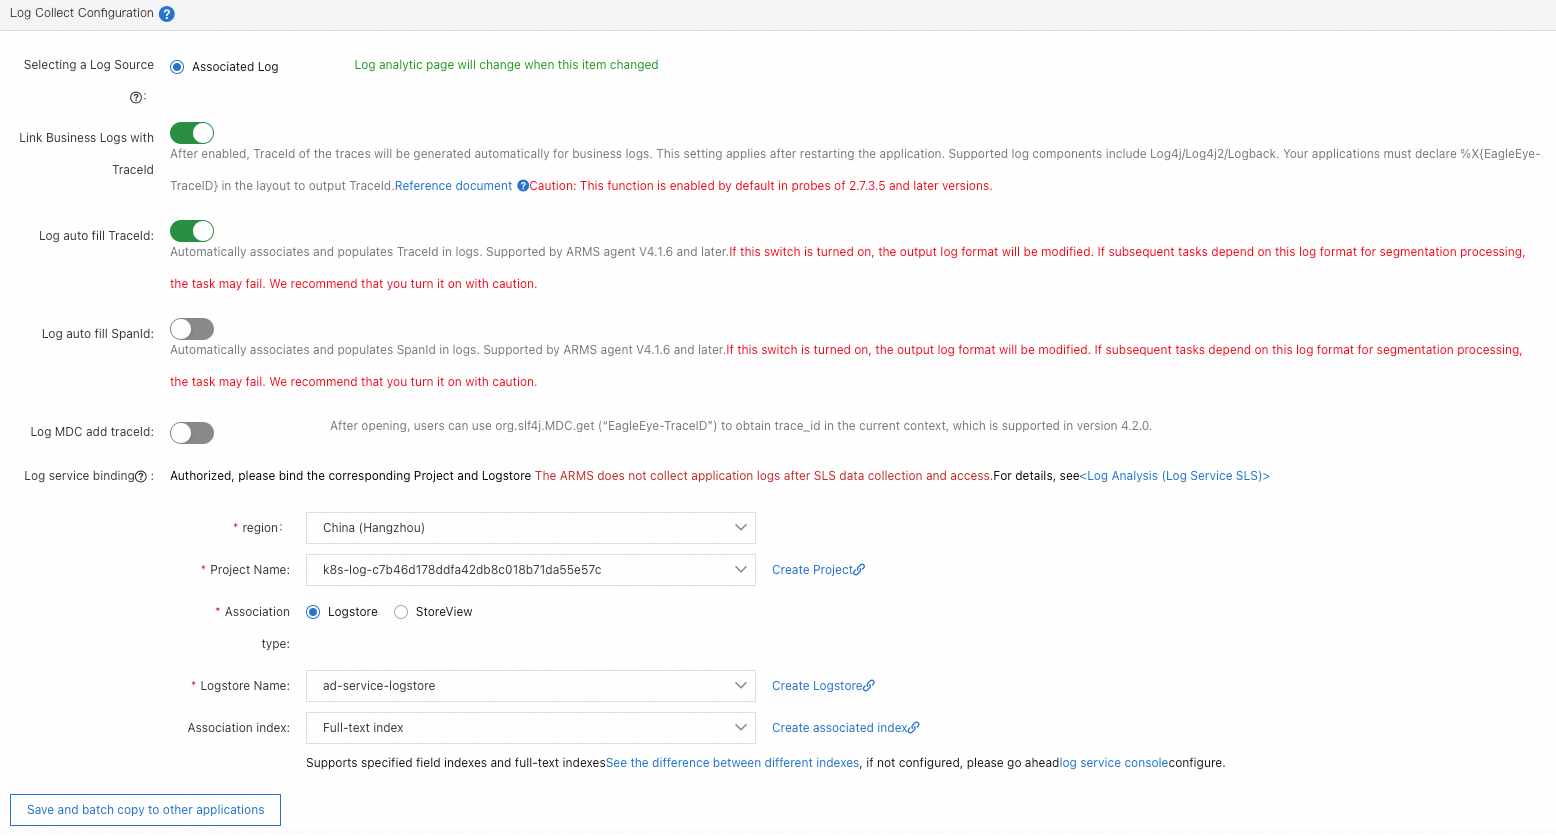
Application logs association
In the Log Collect Configuration section, configure the log sources to associate with this application. For setup instructions, see Log analysis.
Log association is available only in Application Monitoring Pro Edition.
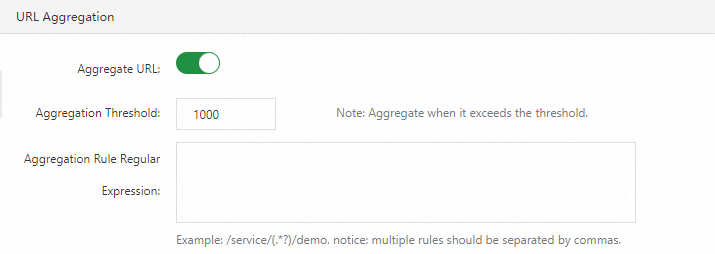
URL convergence rules
In the URL Aggregation section, group similar URLs into a single entry for cleaner monitoring views. For example, URLs prefixed with /service/demo/ appear as one entry.
| Setting | Description |
|---|---|
| Convergence switch | Enable or disable URL grouping. |
| Convergence threshold | Minimum number of matching URLs required to trigger grouping. For example, if set to 100, URLs are grouped only when at least 100 URLs match the rule. |
| Convergence rules | Define regex patterns to match URLs for grouping. |
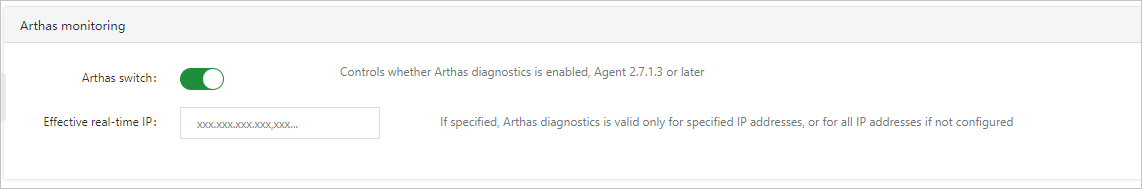
Configure Arthas monitoring
In the Arthas monitoring section, enable the Arthas diagnostics feature and specify the IP addresses to target. For details, see Use Arthas diagnostics.
Arthas monitoring is available only in Application Monitoring Pro Edition.
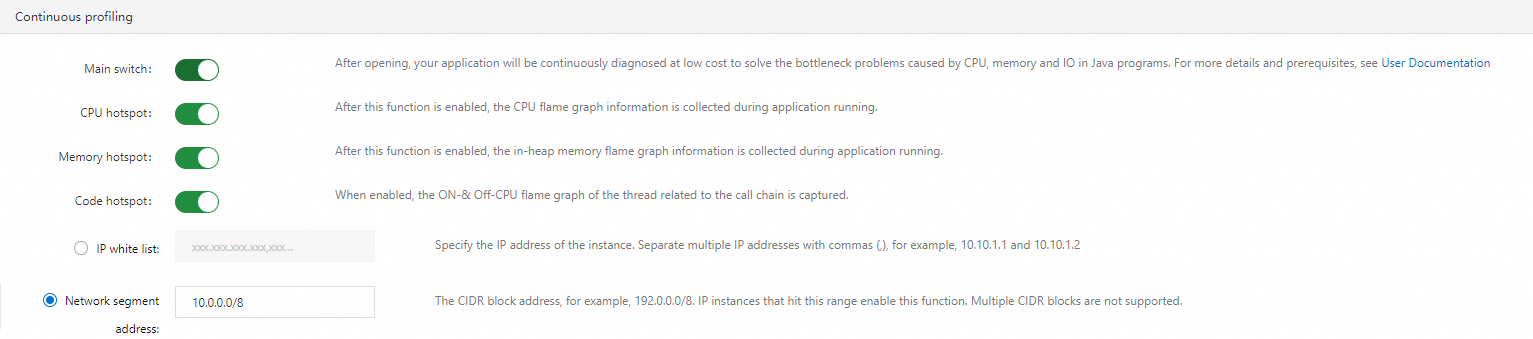
Continuous profiling
In the Continuous profiling section, toggle the main switch and individual switches for CPU hotspot, memory hotspot, and code hotspot profiling. Specify IP addresses or CIDR blocks to limit the profiling scope.
For setup instructions, see Use the continuous profiling feature.
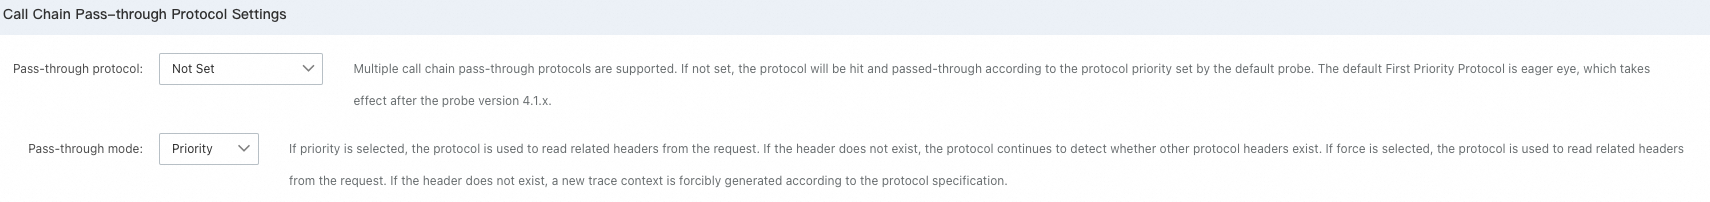
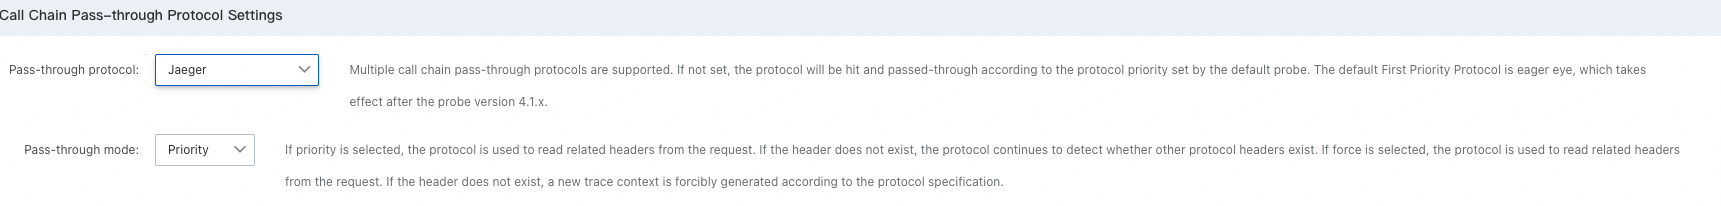
Tracing protocol settings
In the Tracing Protocol Settings section, select the trace propagation protocol for your application. For supported protocols, see Supported trace propagation protocols.
Protocol detection order
When a request arrives, the ARMS agent checks for protocol headers in this default order:
EagleEye
OpenTelemetry
SkyWalking
Jaeger
Zipkin
If a matching header is found, the agent restores the trace context using that protocol and propagates the same header to downstream calls. If no header is detected, the agent defaults to EagleEye.
Prioritize a protocol
Select a protocol to check first. For example, selecting Jaeger changes the detection order to: Jaeger, EagleEye, OpenTelemetry, SkyWalking, Zipkin.
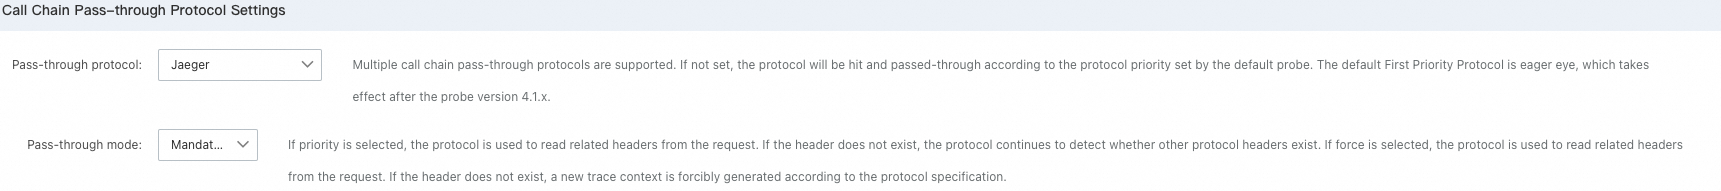
Use a single protocol exclusively
Select a protocol and enable exclusive mode. For example, with Jaeger in exclusive mode, the agent only checks for the Jaeger header. If no Jaeger header is found, it generates a new trace context instead of checking other protocols.
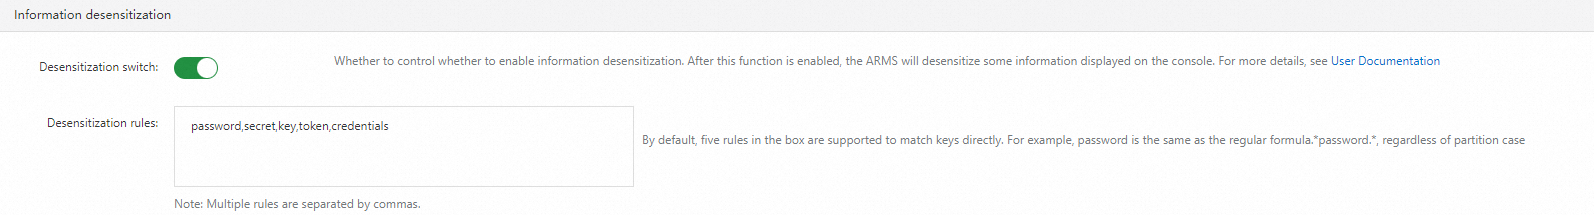
Information desensitization
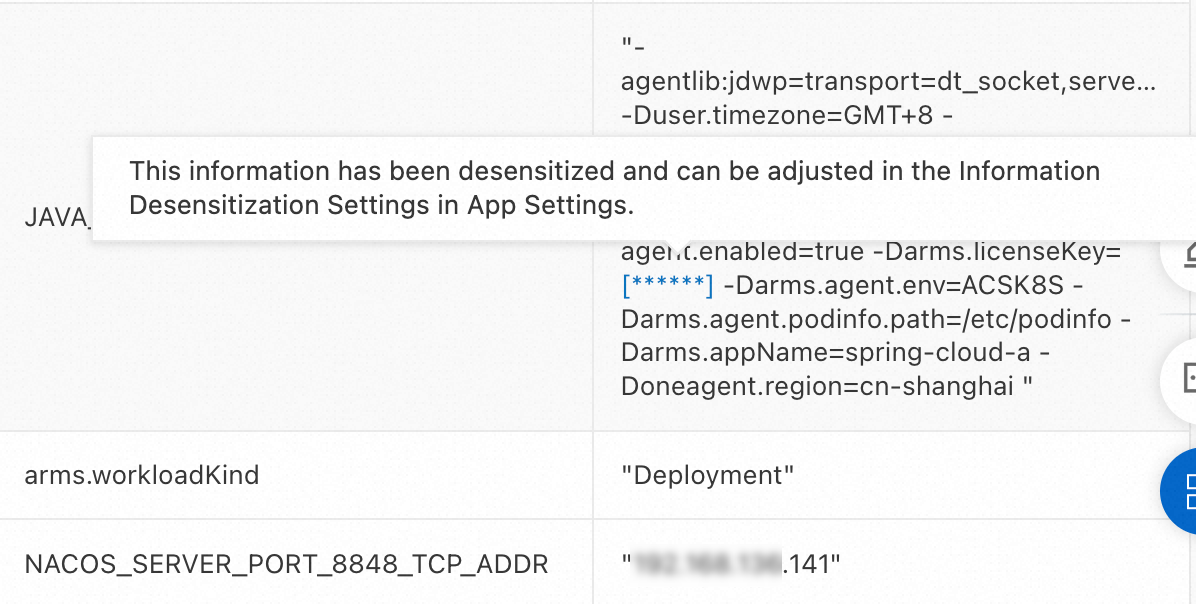
In the Information desensitization section, define redaction rules for sensitive data collected from JVM system parameters, Kubernetes YAML configurations, method input parameters, Arthas environment variables, and system variables.
Each rule element is a case-insensitive regular expression. For example, password matches any key containing the string password (equivalent to .*password.*). Separate multiple elements with commas (,).
When the agent collects data, it checks each key against the configured patterns. If a key matches, the corresponding value is desensitized. For example, adding licenseKey to the rule desensitizes the value of -Darms.licenseKey.
Synchronize settings across applications
Copy settings from one application to others.
Copy a single configuration section
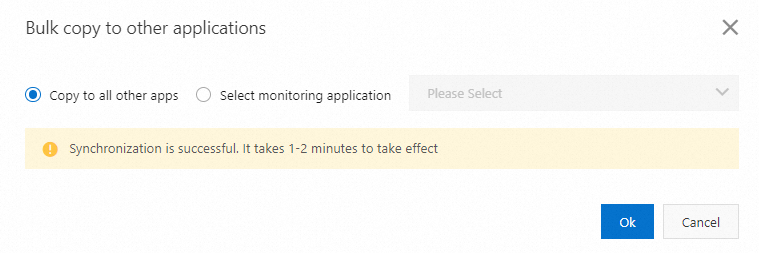
In the target section, click Save and batch copy to other applications.
In the dialog box, select specific applications or all applications, then click Ok.
Copy all configuration sections
At the bottom of the page, click Save and batch copy to other applications.
In the dialog box, select specific applications or all applications, then click Ok.
Set global defaults
Save the current application's settings as the default for all new applications.
At the bottom of the page, click Save the current application Settings to the global default Settings.
In the confirmation message, click Ok.