When standard Browser Monitoring metrics do not cover your business-specific interactions -- such as tracking how often users click a checkout button or measuring how long a module takes to load -- custom statistics let you report these events directly from your JavaScript code. The Application Real-Time Monitoring Service (ARMS) Browser Monitoring SDK provides two API methods: __bl.sum() for counting occurrences and __bl.avg() for measuring average values.
Quick start
After the Browser Monitoring SDK is loaded on your page, add the following calls to start reporting events:
// Count each checkout button click
__bl.sum('checkout-button-click');

// Measure module load time in milliseconds
__bl.avg('module-load-time', 120);
Reported data appears in the ARMS console under four analysis dimensions: Statistics details, PV/UV, Geographical view, and Terminal view.
Choose the right statistic type
| Type | When to use | API method | Example scenarios |
|---|---|---|---|
| Sum | Count how many times an event occurs | __bl.sum(key, value) | Button clicks, module loads |
| Average | Measure the mean value of a metric | __bl.avg(key, value) | Module load time |
Prerequisites
Before you begin, make sure that the Browser Monitoring SDK is added to your web page.
Report sum statistics
Call __bl.sum(key, value) to count event occurrences. Each call adds the specified value to the running total for the given event key.
Parameters
| Parameter | Type | Required | Default | Description |
|---|---|---|---|---|
key | String | Yes | None | Event name |
value | Number | No | 1 | Cumulative count to add per report |
Example: track button clicks and batch counts
// Count each checkout button click (default increment: 1)
__bl.sum('checkout-button-click');

// Report 3 module-load events in a single call
__bl.sum('module-load', 3);
Report average statistics
Call __bl.avg(key, value) to record values for average calculations.
Parameters
| Parameter | Type | Required | Default | Description |
|---|---|---|---|---|
key | String | Yes | None | Event name |
value | Number | No | 0 | Reported value to include in the average calculation |
Example: measure module load time
// Report load-time measurements in milliseconds
__bl.avg('module-load-time', 120);
__bl.avg('module-load-time', 85);
Analysis dimensions
ARMS displays reported event data across four dimensions. The examples below use average statistics.
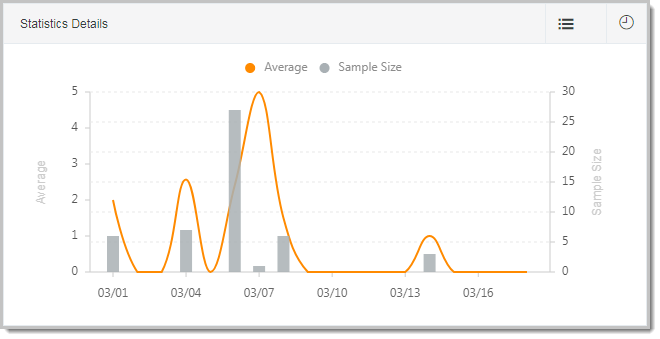
Statistics details
A line chart that plots the average value and sample count for an event over time. For example, if you track module load time, this chart shows how the average duration and the number of samples change over the selected time range.
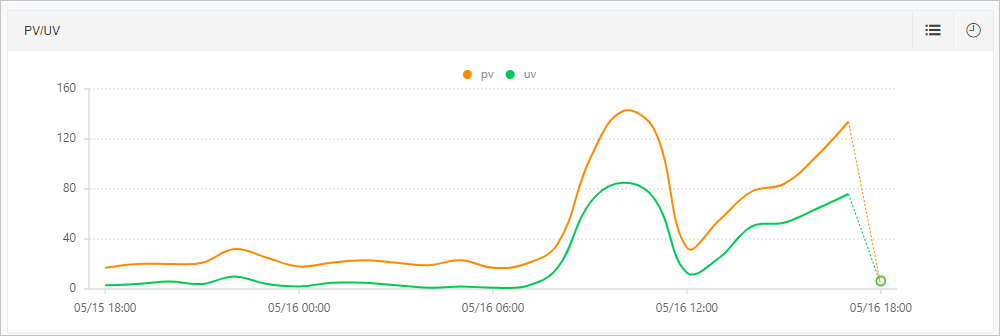
PV/UV
A line chart that shows the page view (PV) and unique visitor (UV) counts for the event over the selected time range.
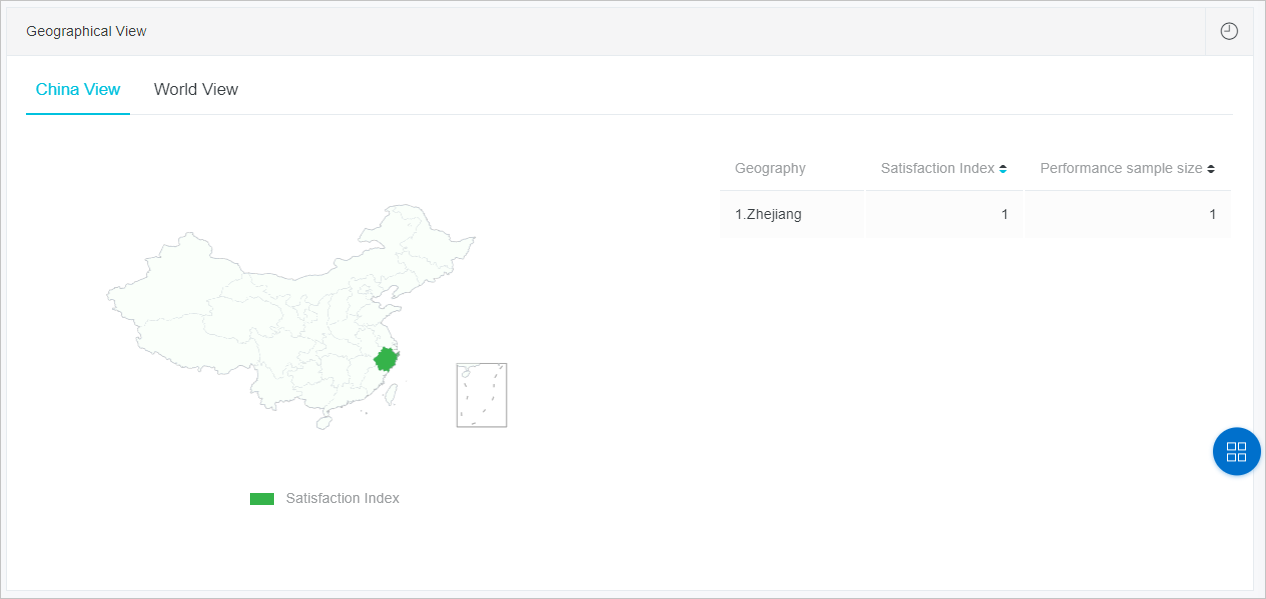
Geographical view
Breaks down event data by location: by province or city within the Chinese mainland, and by country or region worldwide. Each location entry includes the reported amount, average value, and UV count.
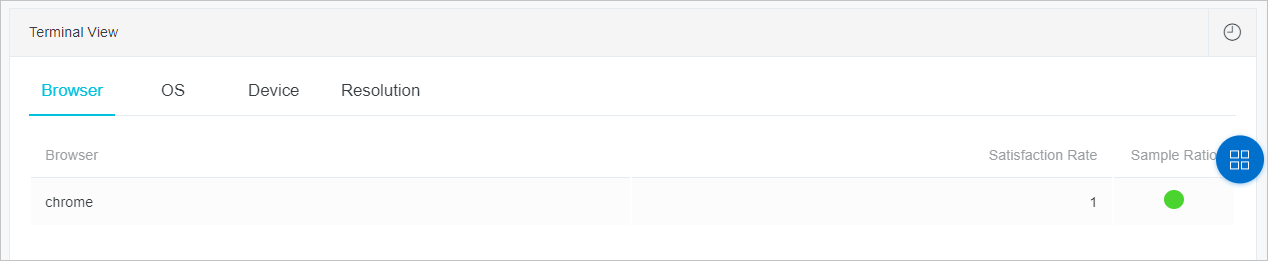
Terminal view
Breaks down event data by browser, device, operating system, and screen resolution. Each entry shows the average value and sample count. Use this view to identify performance or compatibility differences across client environments.
What's next
Open the Statistics details and Geographical view panels in the ARMS console to identify performance patterns across regions and time periods.
Combine custom statistics with other Browser Monitoring features for end-to-end visibility.