Application Real-Time Monitoring Service (ARMS) Prometheus allows you to create alert rules for monitoring jobs. When alert conditions are met, you can receive alerts through emails, Short Message Service (SMS) messages, and DingTalk notifications in real time. This helps you detect errors in a proactive manner. This topic describes how to create application monitoring alert rules, browser monitoring alert rules, and Prometheus monitoring alert rules by using an instance.
Prerequisites
A monitoring job and a contact group are created. For more information, see the following topics:
Create an application monitoring alert
To create an alert for an application monitoring job on Java Virtual Machine-Garbage Collection (JVM-GC) times in period-over-period comparison, perform the following steps:
- Log on to the ARMS console.In the left-side navigation pane, choose .
- On the Alarm Policies page, choose in the upper-right corner.
- In the Create Alarm dialog box, set the parameters and click Save.
Set the following parameters:
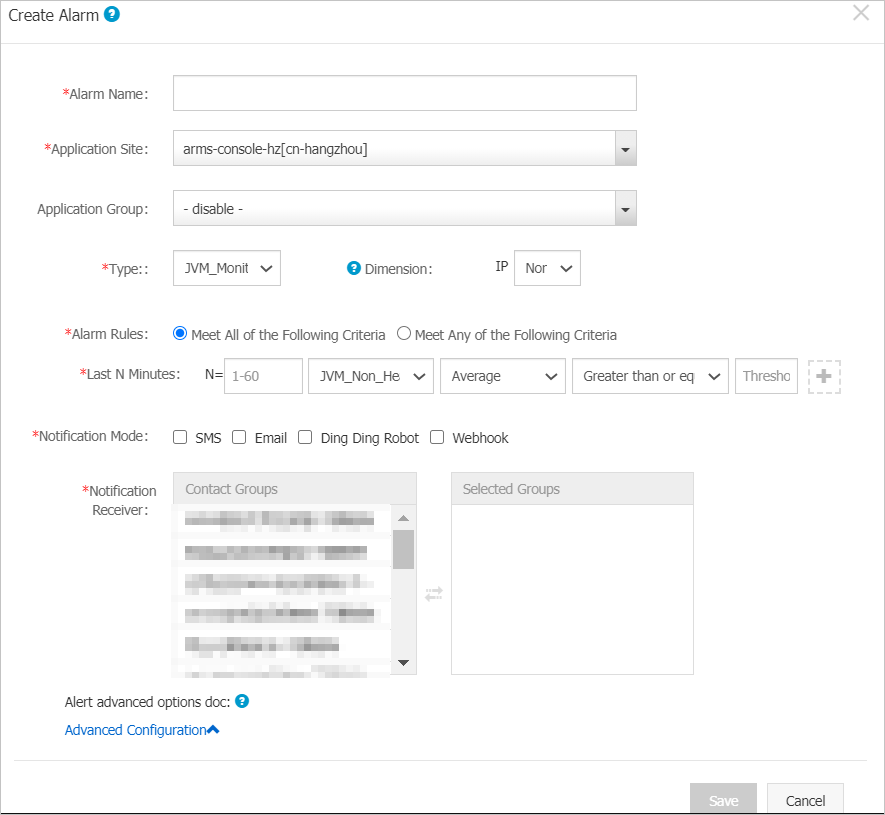
- Enter an alert name, for example, JVM-GC_Comparison.
- From the Application Site drop-down list, select the monitoring job you created.
- In the Type field, select the type of the monitoring metric, for example, JVM_Monitoring.
- Set Dimension to Traverse.
- Configure the alert rule.
- Select Meet All of the Following Criteria.
- Edit the alert rule. For example, an alert is triggered when the value of N is 5 and the average value of JVM_FullGC increases by 100% compared with that in the previous hour. Note To add another alert rule, click the plus sign (+) on the right of the first alert rule.
- Select one or more notification methods. For example, select Email.
- Set the Notification Receiver parameter. In the Contact Groups list, click the name of a contact group. If the contact group appears in the Selected Groups list, the setting is successful.
Create a browser monitoring alert
To create a Page_Metric alert to monitor JS_Error_Rate and JS_Error_Count for a browser monitoring job, perform the following steps:
In the left-side navigation pane, choose .
On the Alarm Policies page, choose in the upper-right corner.
In the Create Alarm dialog box, set the parameters and click Save.
Set the following parameters:
- Enter an alert name, for example, Page_Metric.
- From the Application Site drop-down list, select the monitoring job you created.
- In the Type field, select the type of the monitoring metric, for example, Page_Metric.
- Set Dimension to Traverse.
- Configure the alert rule.
- Select Meet All of the Following Criteria.
- Edit the alert rule. For example, an alert is triggered when the value of N is 10 and the average value of JS_Error_Rate equals or exceeds 20.
- To add another alert rule, click the plus sign (+) on the right of the first alert rule. For example, an alert is triggered when the value of N is 10 and the sum of JS_Error_Count equals or exceeds 20.
- Select one or more notification methods. For example, select SMS and Email.
- Set the Notification Receiver parameter. In the Contact Groups section, click the name of a contact group. If the contact group appears in the Selected Groups section, the setting is successfully completed.
Create a Prometheus monitoring alert
To create an alert on network receiving pressure for a Prometheus monitoring job, perform the following steps:
In the left-side navigation pane, choose .
On the Alarm Policies page, choose in the upper-right corner.
- In the Create Alarm dialog box, enter all required information and click Save.
Set the following parameters:
- Enter an alert name, for example, Received_Bytes.
- Select the cluster of the Prometheus monitoring job.
- Set Type to grafana.
- Select the specific dashboard and chart.
- Configure an alert rule.
- Select Meet All of the Following Criteria.
- Edit the alert rule. For example, an alert is triggered when the value of N is 5 and the average value of Received_Bytes (MB) equals or exceeds 3. Note A Grafana chart may display data of curve A, curve B, and curve C. You can select one of them to monitor.
- In the PromQL field, edit the existing PromQL statement or enter a new PromQL statement. Important If a PromQL statement contains a dollar sign (
$), an error may occur. You must delete the equal sign (=) and the parameters on both sides of the equal sign (=) in the statement that contains the dollar sign ($). For example, changesum (rate (container_network_receive_bytes_total{instance=~"^$HostIp.*"}[1m]))tosum (rate (container_network_receive_bytes_total[1m])).
- Select one or more notification methods. For example, select SMS.
- Set the Notification Receiver parameter. In the Contact Groups list, click the name of a contact group. If the contact group appears in the Selected Groups list, the setting is successful.
For the new version
To create an alert rule in the new version, perform the following operations:
- Create an alert rule in Application Monitoring. For more information, see Create and manage an alert rule in Application Monitoring (new).
- Create an alert rule in Browser Monitoring. For more information, see Create and manage a Browser Monitoring alert rule.
- Create an alert rule in Prometheus Monitoring. For more information, see Create an alert rule.