The API Details page in ARMS Browser Monitoring surfaces success rates, response times (RT), and error counts for API calls in your web application. Use this page to spot slow endpoints (RT > 1,000 ms), trace failing requests back to specific status codes or return messages, and break down traffic by geography, domain, device, and other dimensions.
Quick troubleshooting reference
| Symptom | Where to look |
|---|---|
| Overall success rate is dropping | API Request Statistics > Success Rate tab |
| High response times | API Request Statistics > Success RT or Failure RT tab |
| Spike in slow responses | API Request Statistics > Slow Responses tab |
| Increase in errors | API Request Statistics > Error Number tab |
| Specific endpoint is failing | API Requests tab > click the number in the Error Number column |
| Slow responses on a specific endpoint | API Requests tab > click the number in the Slow Responses column |
| Errors from a specific status code | HTTP Status Code tab > Set To Search Value on the target code |
| Traffic breakdown by geography or device | Distribution tab |
Open the API details page
Log on to the ARMS console.
In the left-side navigation pane, choose .
On the Browser Monitoring page, click the name of the application.
In the left-side navigation pane, choose .
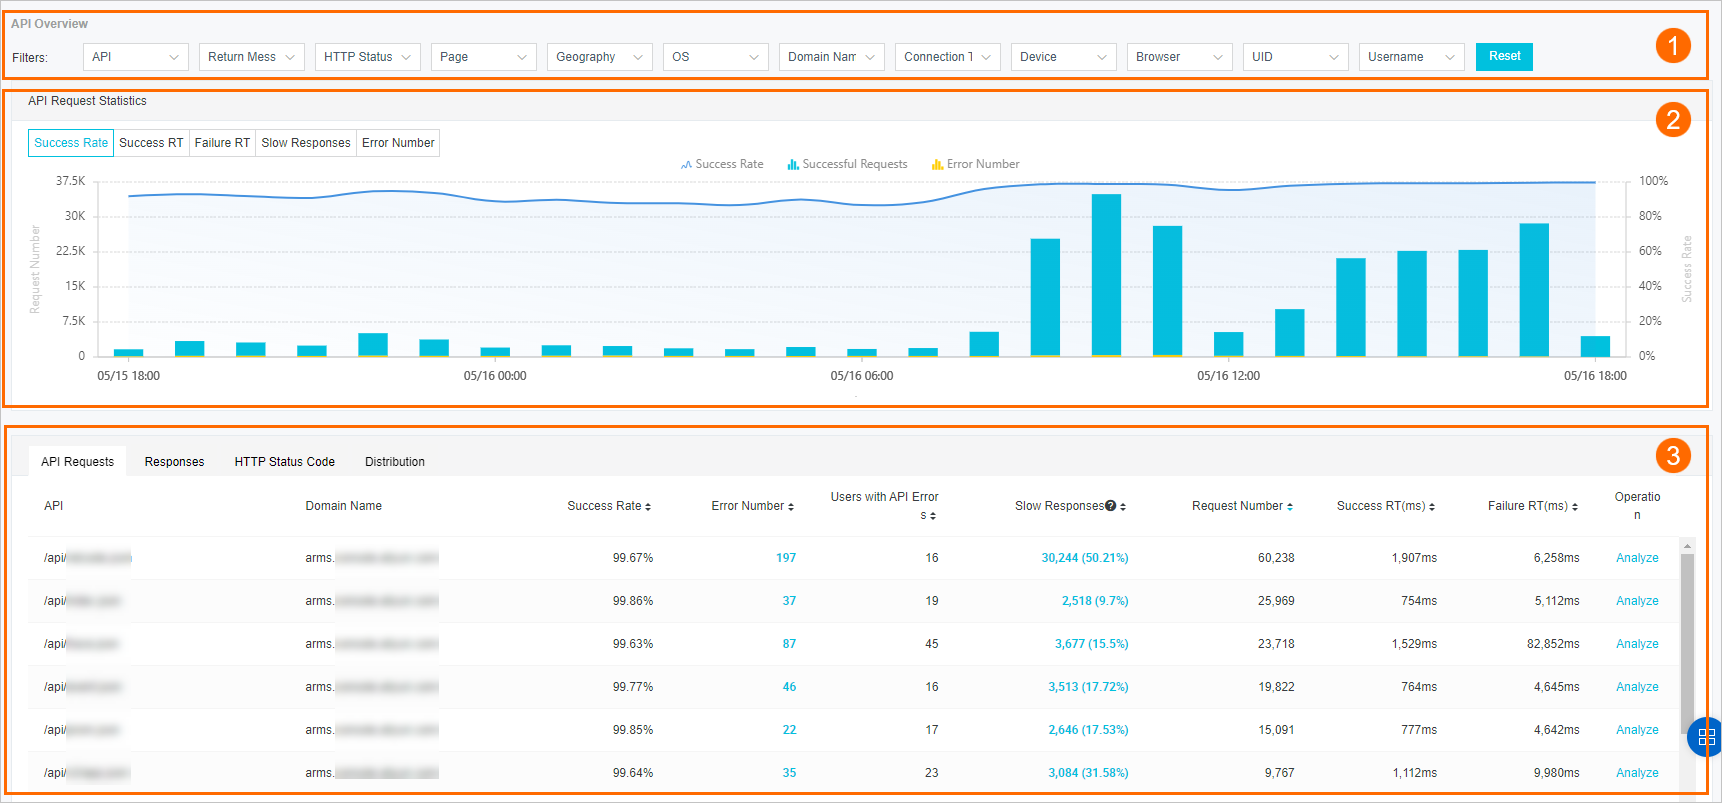
The page is divided into three sections:
| Section | Description |
|---|---|
| Filters (top) | Narrow results by specific dimensions. |
| API Request Statistics (middle) | View trends for success rate, RT, slow responses, and errors over time. |
| Detail tabs (bottom) | Explore individual API endpoints, responses, HTTP status codes, and distribution breakdowns. |
Filters
Filter data by one or more dimensions: API, Return Message, HTTP Status Code, Page, Geography, OS, Domain Name, Connection Type, Device, Browser, UID, and Username.
To remove a single filter, hover over it and click the
 icon.
icon.To clear all filters, click Reset.
API request statistics
The API Request Statistics section provides time-series charts across five tabs. Hover over any chart to view exact values at a specific point in time.
Success rate
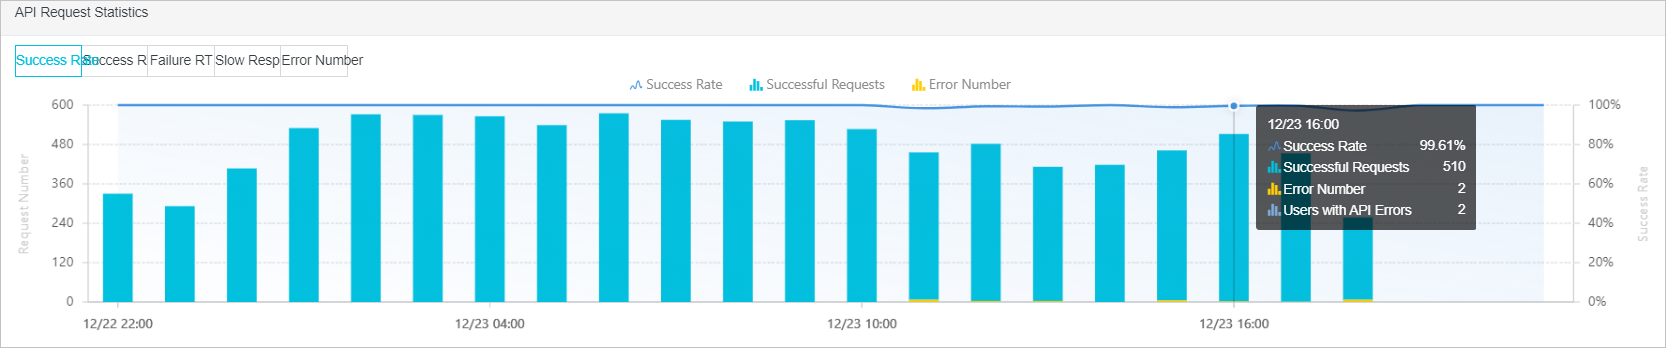
Click the Success Rate tab to view the success rate trend alongside request and error volumes.
| Chart element | Description |
|---|---|
| Success Rate (line) | Percentage of successful API calls over time. Corresponds to the right y-axis. |
| Successful Requests (blue bars) | Number of successful API calls per hour. Corresponds to the left y-axis. |
| Error Number (yellow bars) | Number of failed API calls per hour. Corresponds to the left y-axis. |
Hover over the chart to view the success rate, number of successful requests, number of failed requests, and number of users that encounter failures at a specific point in time.
Response time
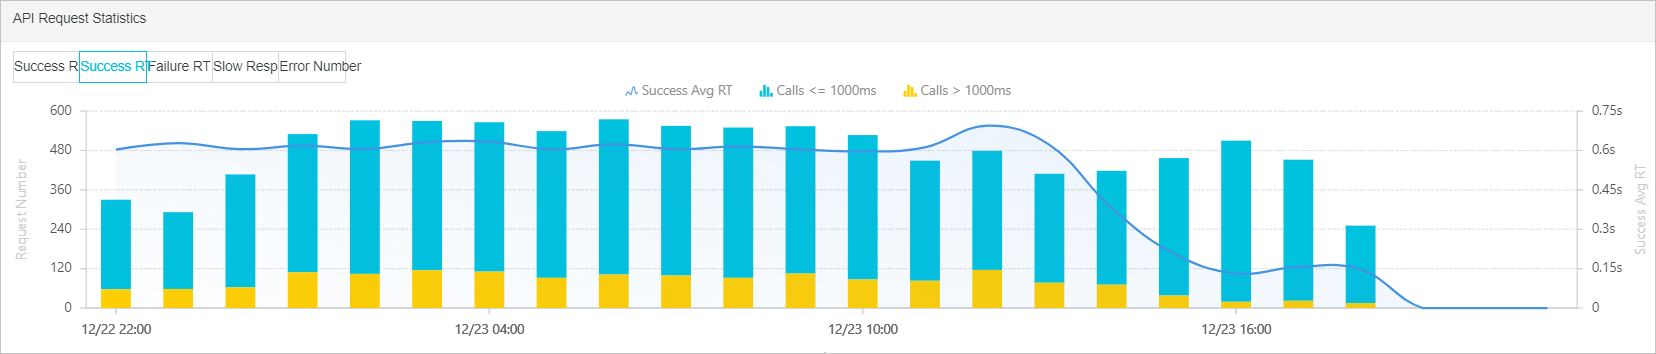
Click the Success RT or Failure RT tab to compare RT trends against the 1,000 ms threshold.
| Chart element | Description |
|---|---|
| Success Avg RT / Failure Avg RT (line) | Average RT for successful or failed API calls over time. Corresponds to the right y-axis. |
| Calls <= 1000ms (blue bars) | Number of calls with RT at or below 1,000 ms per hour. Corresponds to the left y-axis. |
| Calls > 1000ms (yellow bars) | Number of calls with RT above 1,000 ms per hour. Corresponds to the left y-axis. |
Slow responses
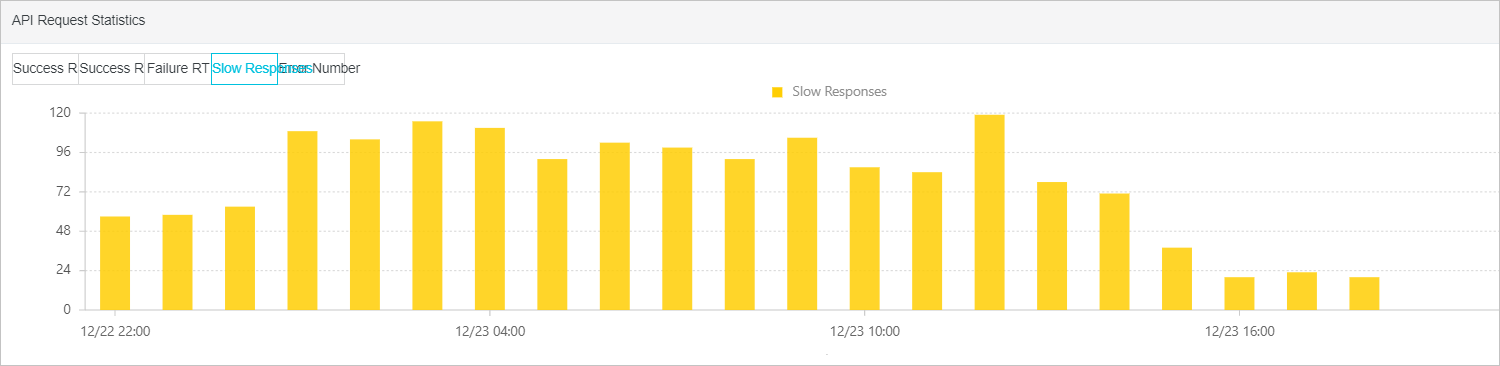
Click the Slow Responses tab to view the volume of slow responses over time.
| Chart element | Description |
|---|---|
| Slow Responses (bars) | Number of slow responses per hour. Corresponds to the left y-axis. |
Error count
Click the Error Number tab to view the volume of failed API calls over time.
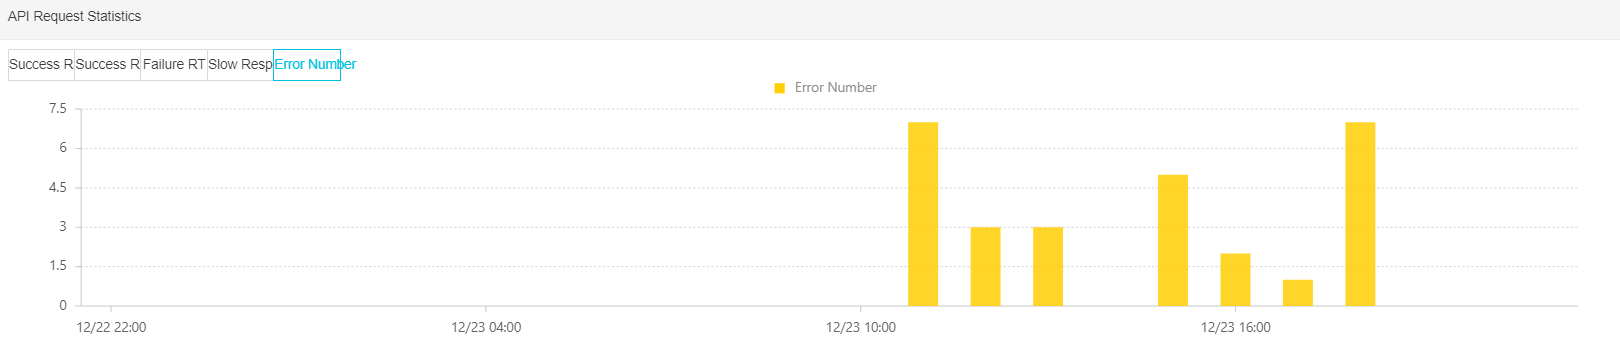
| Chart element | Description |
|---|---|
| Error Number (bars) | Number of failed API calls per hour. Corresponds to the left y-axis. |
Detail tabs
The bottom section contains four tabs for drilling into individual endpoints: API Requests, Responses, HTTP Status Code, and Distribution.
Common actions across tabs
The API Requests, Responses, and HTTP Status Code tabs share the following actions:
| Action | How to |
|---|---|
| Sort the list | Click the |
| Add a filter | Hover over a value in the key column (API name, return message, or HTTP status code) and click Set To Search Value. |
| View slow-response details | Click a number in the Slow Responses column. In the Request Details panel, click Show Invocation Trace to view call traces and business traces, or click View Session to view session traces. |
| Open the analyze view | Click Analyze in the Operation column. See the Analyze sub-tabs section below for details. |
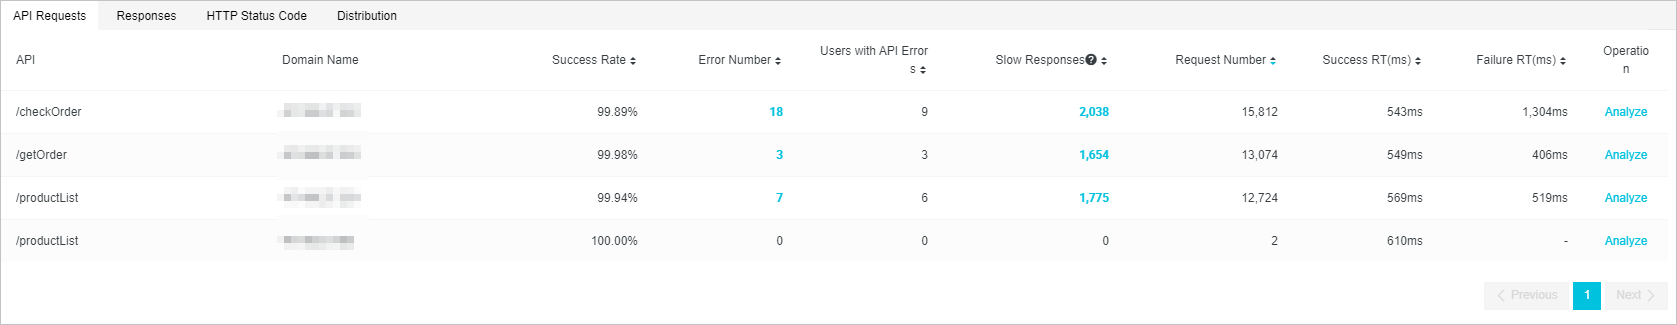
API Requests
Click the API Requests tab to view per-endpoint metrics for all API calls within the selected time range.
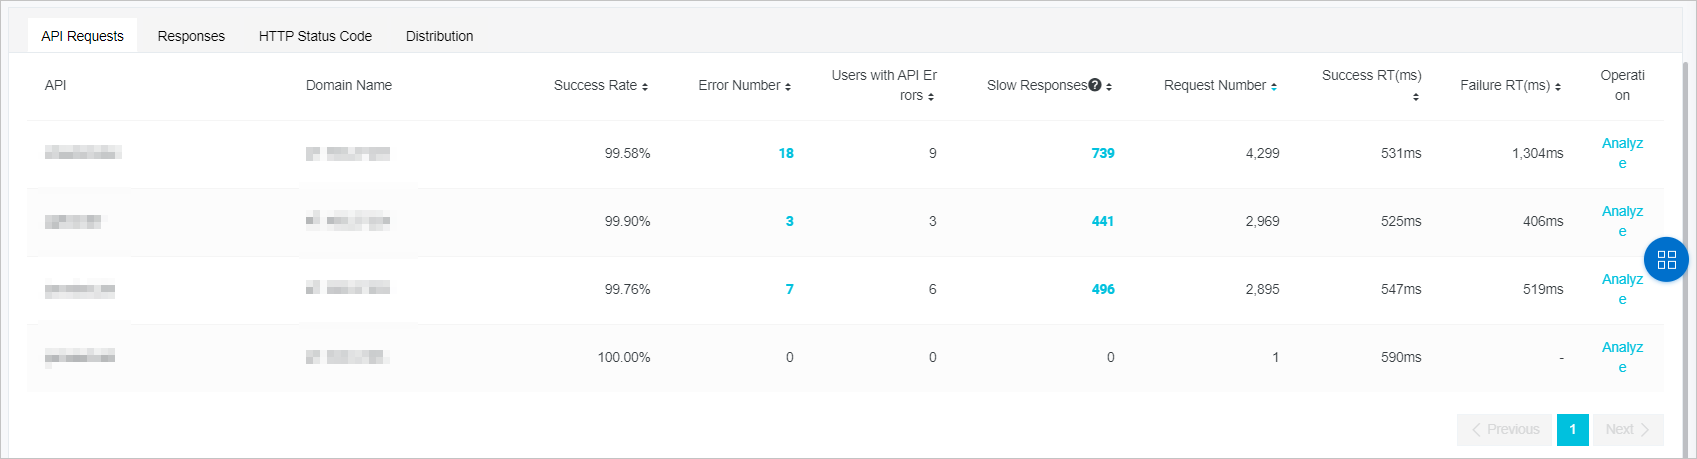
In addition to the common actions, this tab supports:
View error details: Click a number in the Error Number column to view the details and distribution of failed API calls. In the Request Details panel, click Show Invocation Trace to view call traces and business traces, or click View Session to view session traces.
Edit alias: Hover over an API name in the API column and click the
 icon to modify its alias. The alias is used as the display name across the page.
Responses
Click the Responses tab to view metrics grouped by return message.
This tab uses the same common actions described above. Hover over a value in the Return Message column and click Set To Search Value to filter by that response.
HTTP status code
Click the HTTP Status Code tab to view metrics grouped by HTTP status code.
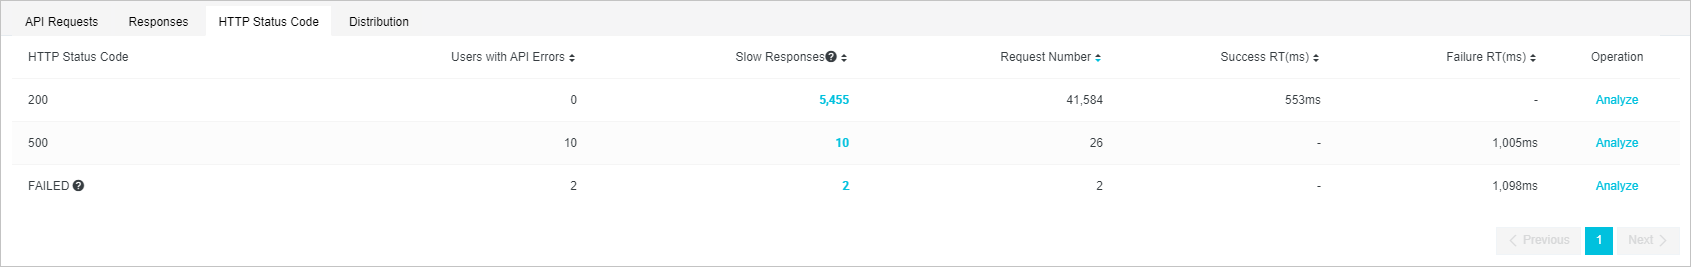
This tab uses the same common actions described above. Hover over a value in the HTTP Status Code column and click Set To Search Value to filter by that status code.
Distribution
Click the Distribution tab to view how API calls break down across multiple dimensions: return messages, HTTP status codes, pages, domain names, and geographical locations. Pie charts show the proportions by operating system, browser, device, and connection type.
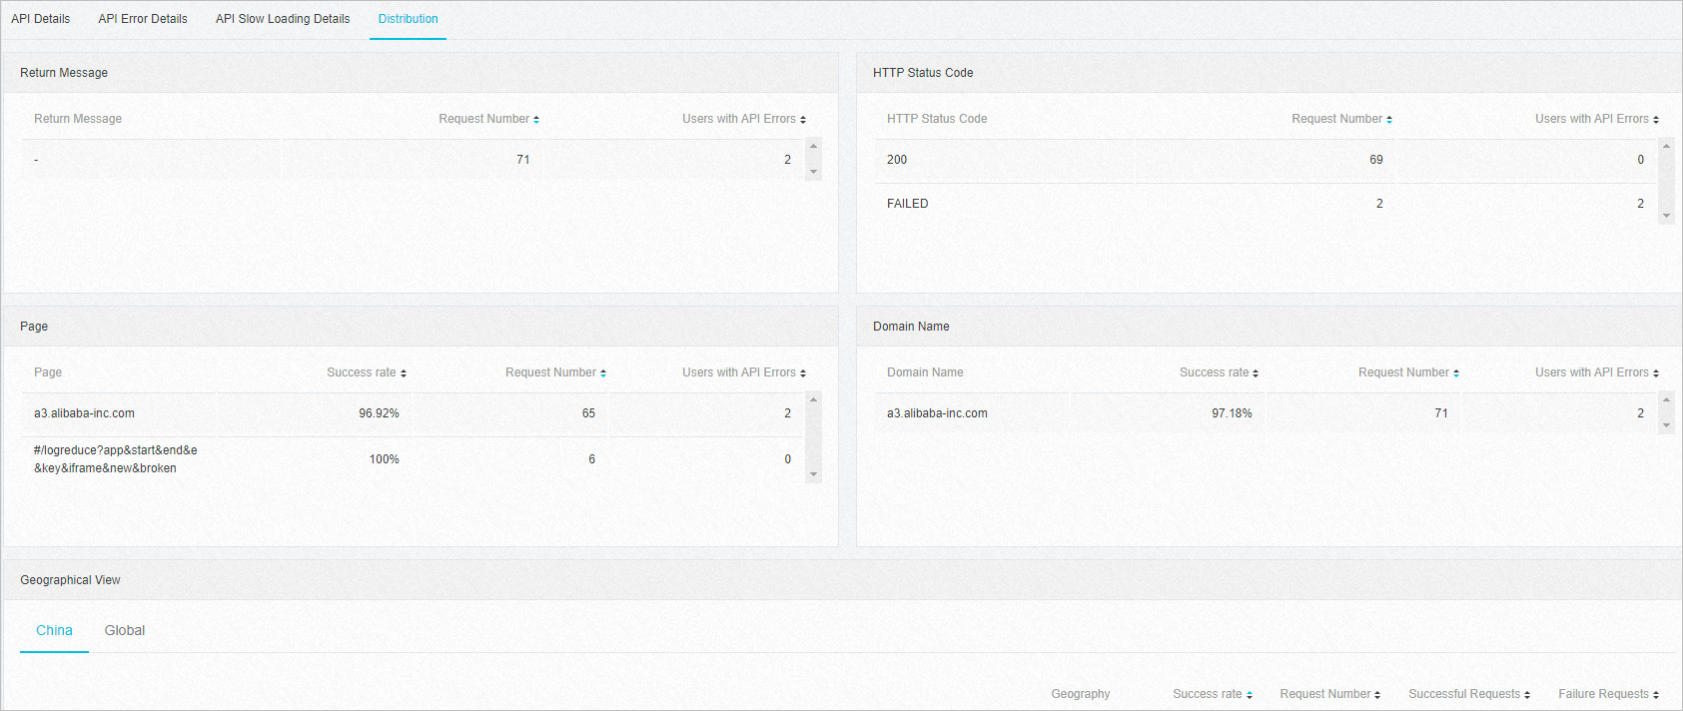
Hover over a value in the Domain Name or Page column and click Set To Search Value to add it as a filter.
Pie charts display only the first five items. Click the Toggle View icon in the upper-right corner of each chart to view all items.
Analyze sub-tabs
When you click Analyze on any row in the API Requests, Responses, or HTTP Status Code tab, a detail view opens with four sub-tabs:
| Sub-tab | What it shows |
|---|---|
| API Details | Success rate trend and per-request details. In the Request Details section, click Show Invocation Trace to view call traces and business traces, or click View Session to view session traces. |
| API Error Details | Failed API call details and the distribution of errors. |
| API Slow Loading Details | RT distribution and network request information for slow calls. |
| Distribution | Breakdown by return message, HTTP status code, page, domain name, geographical location, operating system, browser, device, and connection type. |