API Gateway seamlessly integrates with Simple Log Service (SLS). You can use SLS to query logs in real time, download them, and perform multi-dimensional statistical analysis. You can also ship logs to Object Storage Service (OSS) or MaxCompute.
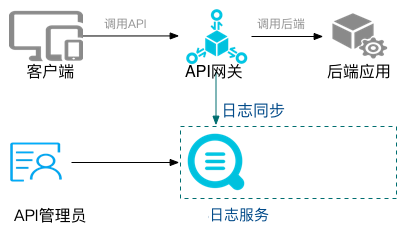
Features
Online log query
This is useful for troubleshooting and statistical analysis.
Detailed call logs
The logs contain the following fields: The requestQueryString, requestHeaders, requestBody, responseHeaders, and responseBody fields are available only for dedicated instances and must be enabled on the group details page.
Parameter | Description |
apiGroupUid | The ID of the API group. |
apiGroupName | The name of the API group. |
apiUid | The ID of the API. |
apiName | The name of the API. |
apiStageUid | The environment ID. |
apiStageName | The environment name. |
httpMethod | The HTTP method used for the call. |
path | The request path. |
domain | The domain name used for the call. |
statusCode | The HTTP status code. |
errorMessage | The error message. |
appId | The caller's application ID. |
appName | The caller's application name. |
clientIp | The client's IP address. |
exception | The specific error message from the backend service. |
exchangeTimestamp | The timestamps of I/O events in the request lifecycle.
|
providerAliUid | The account ID of the API provider. |
region | The region. Example: |
requestHandleTime | The request time (UTC). |
requestId | The globally unique request ID. |
requestSize | The request size in bytes. |
responseSize | The response size in bytes. |
serviceLatency | The total time spent accessing backend resources, including allocating connection resources, establishing the connection, and invoking the backend service. Unit: milliseconds. |
errorCode | The error code. Example: |
requestProtocol | The client request protocol. Valid values: HTTP, HTTPS, and WS. |
instanceId | The ID of the instance where the API service runs. |
initialRequestId | If one API calls another (for example, API-1 calls API-2), this field records the request ID of the first call (API-1) in the log of the second call (API-2). |
clientNonce | The X-Ca-Nonce header of the client request. |
requestQueryString | The query string of the client request (dedicated instances only). |
requestHeaders | The headers of the client request (dedicated instances only). |
requestBody | The body of the client request, up to 1,024 bytes (dedicated instances only). |
responseHeaders | The headers of the API response (dedicated instances only). |
responseBody | The body of the API response, up to 1,024 bytes (dedicated instances only). |
consumerAppKey | The AppKey of the API request. |
totalLatency | The total latency of the API request in milliseconds. |
customTraceId | The trace ID of the end-to-end log. |
jwtClaims | The claims parsed from the JSON Web Token (JWT). You can configure this in the API group settings. |
plugin | The list of plug-ins that matched the API request and their related context. |
View API logs with Simple Log Service
Configuration methods
Two configuration methods are available:
Use the Log Audit feature in the SLS console to synchronize API Gateway logs. With this method, logs from all regions are collected into the Log Audit project. No additional configuration is required in API Gateway.
Configure data ingestion for API Gateway in the SLS console. With this method, you must configure synchronization once for each region.
The following sections describe these two methods.
For Alibaba Gov Cloud and Alibaba Finance Cloud, you can synchronize SLS logs only by using the first method.
Using Log Audit
Open the Log Audit Service configuration page and select a central region, where all subsequent API Gateway logs will be delivered.
The top of the Global Configurations page shows the region and name of the central project. Below, a table displays configuration items for cloud products such as ActionTrail, Object Storage Service (OSS), RDS, Virtual Private Cloud (VPC), DNS, PolarDB, Server Load Balancer (SLB), and Application Load Balancer (ALB). The items include the log collection switch, Storage Mode (Centralized or By Region), retention period, Sync To Center, and Archive After N Days. Enable the log collection switches for the required cloud products and then click Save in the upper-right corner. In the Collection and Synchronization Authorization section, if a message indicates that the account is not authorized to collect and synchronize logs, complete the authorization by using manual authorization or Authorize with AccessKey.
Select an authorization method and follow the on-screen instructions. This example uses manual authorization.
After the authorization is complete, the API Gateway call logs are available in the
apigateway_logLogstore within the central project.API Gateway call logs include fields such as
apiGroupName,apiGroupUid,apiName,apiStageName,apiStageUid, andapiUid. You can view the detailed key-value pairs for each log entry on the Raw Logs tab.
Configure in the API Gateway console
1) Make sure that you have activated SLS. Then, log on to the SLS console, select the target region, and create a project and a Logstore. This example uses the China (Hangzhou) region.
In the Create Project dialog box, enter a Project Name (for example, gateway-t***), keep the default resource group, and select your preferences in the Enable Logging for section, such as Operation Log and Global Log. Then, click OK. After the project is created, click Create Logstore in the dialog box that appears. When creating the Logstore, configure its settings. For example, set the Logstore Name to gateway_log, Type to Standard, Billing Mode to Pay-By-Data-Written, Data Retention Period to 30 days, and Number of Shards to 2. Enable Auto Split Shard (up to a maximum of 64 shards) and Log Public IP, and then click OK. In the final confirmation dialog box, click Data Import Wizard.
2) Configure API Gateway data ingestion and select the API Gateway product.
After you select API Gateway, the Data Source Configuration page appears. Confirm that RAM authorization is complete (the page displays "You have authorized Log Service to distribute logs"). In the Create Distribution Rule section, confirm that API Gateway access logs are imported into the destination Logstore, and then click Next. Continue clicking Next through the remaining steps to complete the configuration.
View logs
Log on to the SLS console to view logs and search call logs using the SLS query syntax.
In the query results, each log entry contains fields such as apiGroupName, apiGroupUid, apiName, __source__, __tag__:__receive_time__, and __topic__. You can filter logs by field in the Quick Analysis pane on the left, or use the query syntax in the search box at the top for precise searches.
Customize query reports
You can customize query reports based on your business needs. For instructions, see Create a dashboard.