TCP-RT is a kernel-instrumented TCP monitoring tool that identifies request/response pairs on TCP connections and captures timing metrics: upload time, service processing time, and download time. It works with protocols that use a single concurrent request/response per connection, including HTTP/1.1, MySQL, and Redis.
Two versions are available:
| Version | Interface | System requirement |
|---|---|---|
| tcprt (recommended) | systemctl + YAML config file |
Alibaba Cloud Linux 3, kernel 5.10.134-17 or later |
| tcp_rt.ko | modprobe / rmmod + sysfs parameters |
Alibaba Cloud Linux 2 (kernel 4.19.91-21.al7 or later) or Alibaba Cloud Linux 3 |
Use tcprt whenever possible. tcp_rt.ko is maintained for compatibility with Alibaba Cloud Linux 2 and older Alibaba Cloud Linux 3 kernels.
Limitations
-
Mutual exclusion: Both versions write to the same log file path. Running them simultaneously is not supported — use only one at a time.
-
Protocol support: TCP-RT requires a single concurrent request/response per connection, such as HTTP/1.1, MySQL, or Redis.
-
Kernel requirements: tcprt requires Alibaba Cloud Linux 3 with kernel 5.10.134-17 or later. tcp_rt.ko supports Alibaba Cloud Linux 2 (kernel 4.19.91-21.al7 or later) or any Alibaba Cloud Linux 3 kernel.
-
Parsing modes: tcp_rt.ko supports only the
defaultparsing mode. Thehttpandhttpsmodes are available in tcprt only.
How it works
TCP-RT instruments the kernel to record four timestamps per request/response cycle (called a TASK):
-
T0 — first request packet arrives at the server
-
T1 — last request packet arrives at the server
-
T2 — server sends the first response packet
-
T3 — server receives the final ACK from the client
From these timestamps, TCP-RT derives three metrics:
| Metric | Interval | What it measures |
|---|---|---|
upload_time |
T0 to T1 | Time for the client request to arrive |
process_time (service delay) |
T1 to T2 | Server processing time |
download_time |
T2 to T3 | Time for the response to reach the client |
download_time is not reported directly in log records. Calculate it as:
download_time = total_time - upload_time - process_timeLocal mode (server perspective)
When TCP-RT runs on the server, it records timestamps from the server's point of view.

Peer mode (client perspective)
When TCP-RT monitors outbound connections (peer mode), it records timestamps from the client's point of view. In this mode, process_time is the interval from the client sending the last request packet to receiving the first response packet.

Parsing modes
The parsing mode controls which protocol-level details TCP-RT captures:
| Mode | Built on | What it adds |
|---|---|---|
default |
— | Generic TCP request/response parsing (HTTP, Redis, MySQL) |
http |
default |
Round-trip time (RTT) and congestion window metrics; detects HTTP Expect: 100-continue |
https |
http |
Transport Layer Security (TLS) handshake parsing and Close Notify alert detection |
tcp_rt.ko supports only thedefaultparsing mode. Thehttpandhttpsmodes are available in tcprt only.
Details on what each mode records appear in Output format.
Configure tcprt
Prerequisites
Before you begin, make sure you have:
-
An instance running Alibaba Cloud Linux 3 with kernel version 5.10.134-17 or later
-
sudoaccess on the instance
Install and start tcprt
-
Install the tcprt package.
sudo yum install -y tcprt -
Open the configuration file.
sudo vim /etc/tcprt-bpf/tcprt.yaml -
Press
ito enter edit mode and configure the parameters you need. See Configuration parameters for details. -
Save the file: press
Esc, type:wq, then pressEnter. -
Start the service.
sudo systemctl start tcprt -
(Optional) Enable tcprt to start automatically at boot.
sudo systemctl enable tcprt
Configuration parameters
The configuration file has three sections: global, per-port, and init.
global
Applies to all ports unless overridden in per-port.
| Parameter | Description | Values | Default |
|---|---|---|---|
peer |
Default port matching mode. false matches local ports; true matches remote ports. |
true / false |
(empty) |
stats |
Enable stats log output. | enable / disable |
disable |
stats_interval |
Stats output interval. Unit: seconds. | Integer | 60 |
first_frame_bytes |
Byte thresholds for completion-time statistics. Unit: byte. | List of up to 4 integers | (empty) |
per-port
A list of port-specific configurations. Each entry overrides the global defaults for that port.
| Parameter | Description | Values | Default |
|---|---|---|---|
port |
Port number or range (two comma-separated integers for a closed interval). | Integer or start,end |
(required) |
peer |
Matching mode for this port or range. | true / false |
Global peer value |
mode |
Parsing mode. | default / http / https |
default |
first_frame |
Enable completion-time statistics by byte thresholds. | enable / disable |
disable |
init
Buffer settings, configurable only at service start.
| Parameter | Description | Default |
|---|---|---|
log_buf_num |
Number of sub-buffers for log files. Maximum log size = log_buf_num × log_buf_size. |
8 |
log_buf_size |
Size of each log sub-buffer. Unit: byte. | 262144 |
stats_buf_num |
Number of sub-buffers for stats files. Maximum stats size = stats_buf_num × stats_buf_size. |
8 |
stats_buf_size |
Size of each stats sub-buffer. Unit: byte. | 16384 |
Configuration example
The following example configures two ports with different parsing modes and enables byte-threshold completion-time statistics for port 443:
global:
  peer: false           # match local ports by default
  stats: disable
  stats_interval: 60
  first_frame_bytes: [100, 2000, 20000, 0]  # byte thresholds for R.F records

per-port:
  -
    port: 443
    mode: https         # enables TLS handshake parsing and Close Notify detection
    first_frame: enable # appends completion-time steps to R records
  -
    port: 56789,56800   # monitors port range 56789–56800
    mode: default
    peer: true          # match remote ports for this range

init:
  log_buf_num: 8
  log_buf_size: 262144
  stats_buf_num: 8
  stats_buf_size: 16384
Completion-time statistics (first_frame) track byte thresholds using ACK packets. Because one ACK can acknowledge a large burst of data, logged data volumes may exceed the configured thresholds.
Uninstall tcprt
sudo yum remove tcprtEnter y when prompted to confirm.
Configure tcp_rt.ko
Prerequisites
Before you begin, make sure you have:
-
An instance running Alibaba Cloud Linux 2 (kernel 4.19.91-21.al7 or later) or Alibaba Cloud Linux 3
-
sudoaccess on the instance
Load the module
Two approaches are available.
Option 1: Set parameters at load time
Load the module with parameters in a single command. For example, to monitor local port 80:
sudo modprobe tcp_rt lports=80Verify the parameter was applied:
sudo cat /sys/module/tcp_rt/parameters/lportsOption 2: Load the module, then set parameters
-
Load the module.
sudo modprobe tcp_rt -
Write parameters to
/sys/module/tcp_rt/parameters/. For example, to monitor local port 80:sudo sh -c 'echo 80 > /sys/module/tcp_rt/parameters/lports' -
Verify the parameter.
sudo cat /sys/module/tcp_rt/parameters/lports
Module parameters
| Parameter | Description | Default | Example command |
|---|---|---|---|
stats |
Enable stats output. 0 = disabled, 1 = enabled. |
0 |
echo 0 > stats |
stats_interval |
Stats output interval. Unit: seconds. | 60 |
echo 60 > stats_interval |
lports |
Local server ports to monitor (up to 6). | (none) | echo 80,800,8080 > lports |
pports |
Remote ports of TCP connections to monitor. | (none) | echo 80,800,8080 > pports |
lports_range |
Local port ranges. Two integers per range. | (none) | echo 80,100,1000,2000 > lports_range |
pports_range |
Remote port ranges. Two integers per range. | (none) | echo 80,100,1000,2000 > pports_range |
log_buf_num |
Maximum log size = log_buf_num × 256 KB. Configurable only at module load. |
8 |
modprobe tcp_rt log_buf_num=10 |
stats_buf_num |
Maximum stats size = stats_buf_num × 16 KB. Configurable only at module load. |
8 |
modprobe tcp_rt stats_buf_num=10 |
Unload the module
-
Deactivate tcp_rt so new connections no longer use it.
sudo echo 1 > /sys/kernel/debug/tcp-rt/deactivate -
Confirm no existing connections are using the module.
lsmodIf the
Used bycount fortcp_rtis0, no connections are active. -
Unload the module.
sudo rmmod tcp_rt
Output format
TCP-RT outputs two file types to /sys/kernel/debug/tcp-rt via debugfs:
| File type | Path pattern | Output timing |
|---|---|---|
| Log file | rt-network-log<N> (one file per CPU core) |
When the next TASK starts on a connection, or when the connection closes |
| Stats file | rt-network-stats |
Periodically (default: every 60 seconds) |
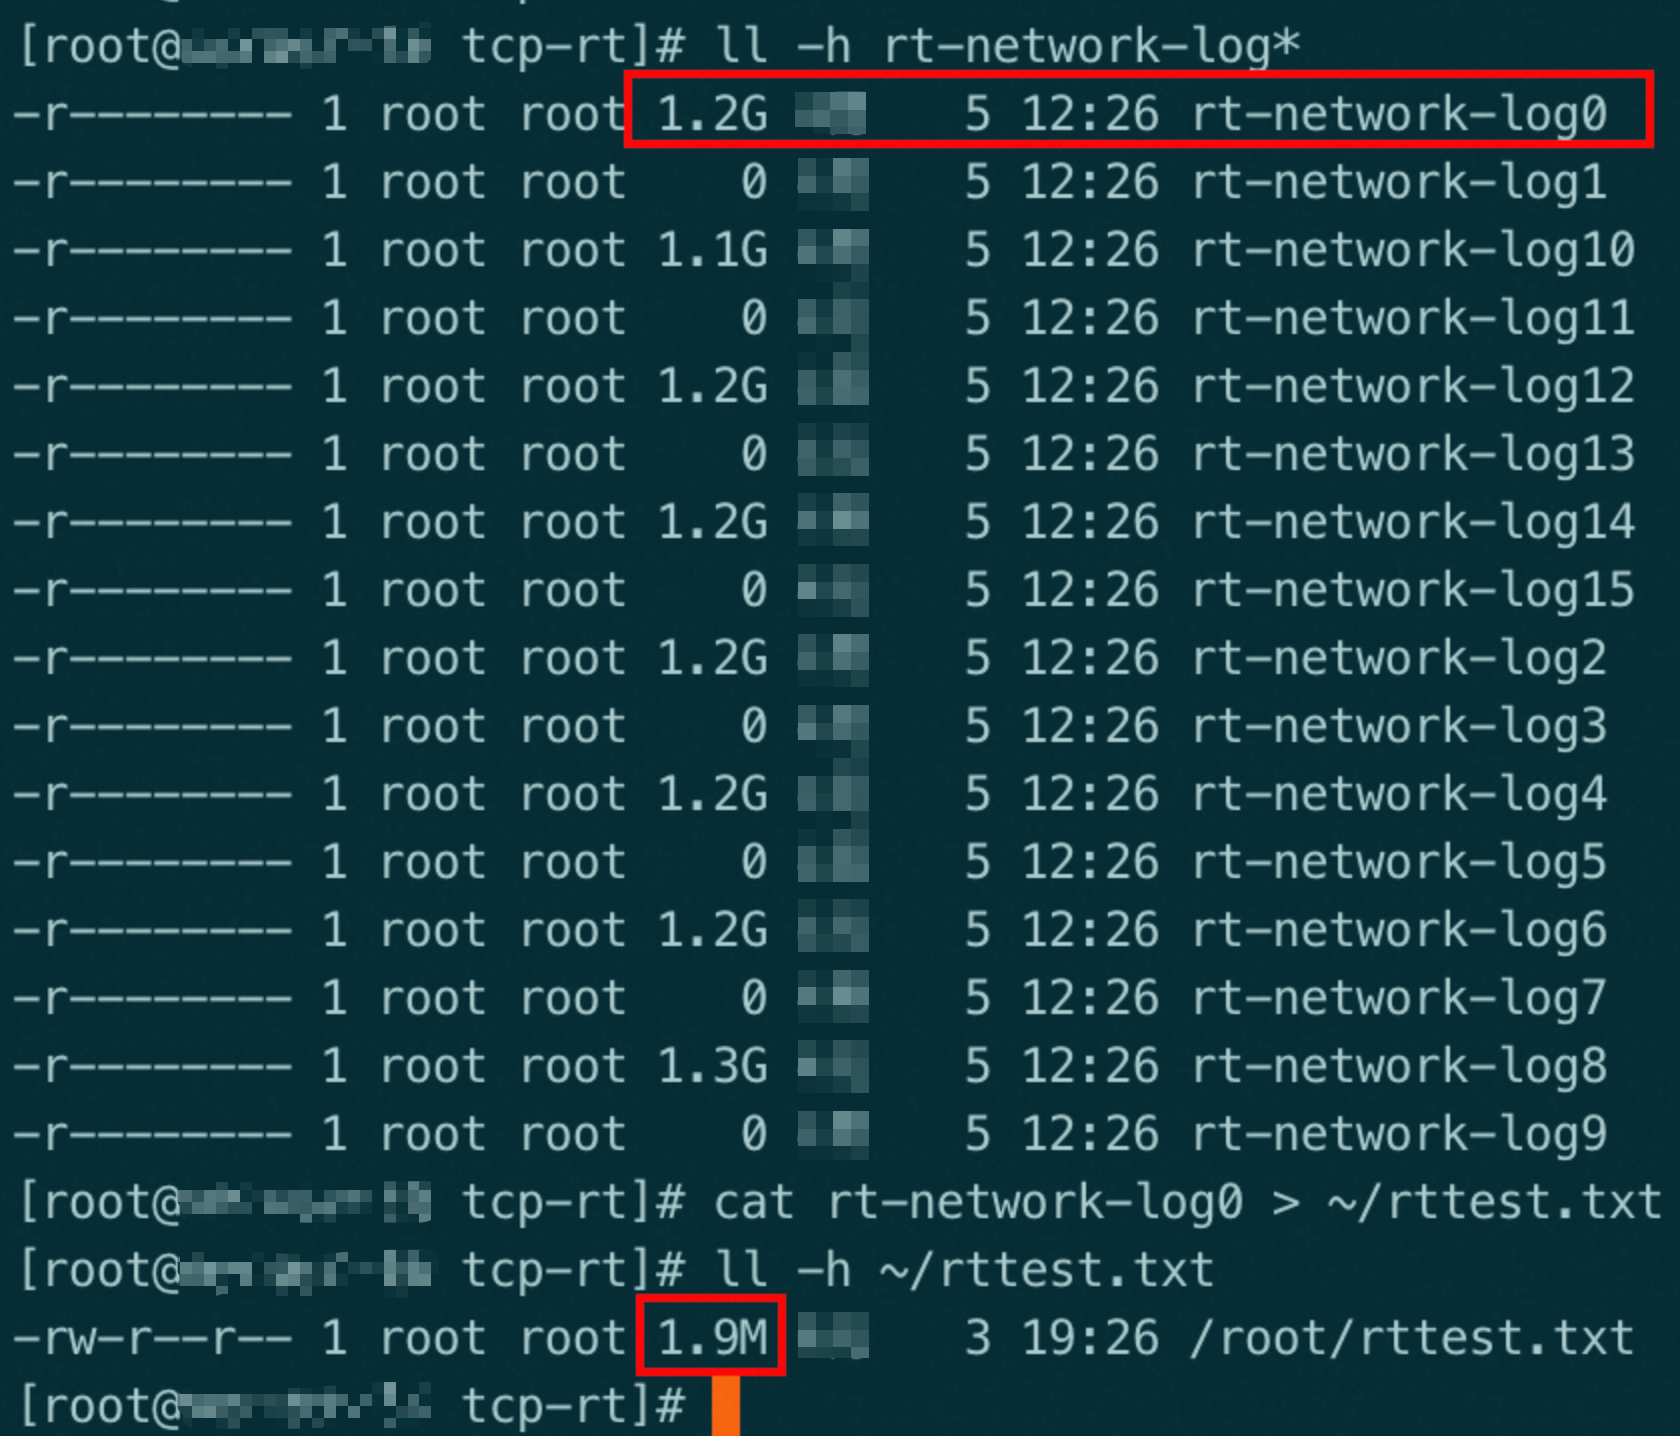
Log files are stored in the/sysvirtual filesystem and do not consume disk space. The size shown byls -lreflects cumulative log volume, not actual disk usage. To check the real log size, redirect the file to a regular file:cat rt-network-log0 > /tmp/sample.log.
Each CPU core gets its own log file. On a 32-core server, the files range from rt-network-log0 to rt-network-log31. Each file holds up to 2 MB; older data is purged when the limit is reached. Reading a log file is destructive — the data is cleared after each read.
Log file format
Each log record starts with eight fixed fields, followed by type-specific fields.
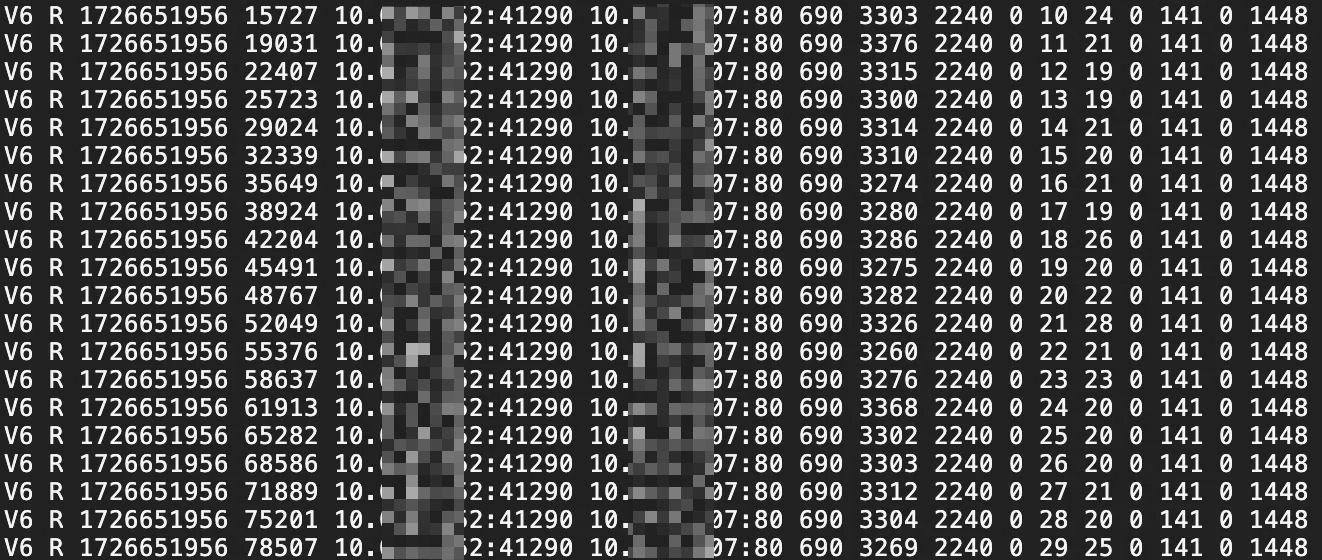
A log line has the following structure:
<version> <type> <time_sec> <time_usec> <remote_ip> <remote_port> <local_ip> <local_port> [type-specific fields...]Example R record:
V6 R 1693382120 450123 10.0.1.5 54321 192.168.1.10 80 1024 85432 312 0 3 12500 580 512 0 1448Fields in order: version (V6), type (R), TASK start seconds (1693382120), microseconds (450123), remote IP (10.0.1.5), remote port (54321), local IP (192.168.1.10), local port (80), then R-specific fields: data sent (1024 bytes), total duration (85432 us), minimum RTT (312 us), retransmissions (0), TASK sequence number (3), service delay (12500 us), upload delay (580 us), data received (512 bytes), receive reordering (0), MSS (1448 bytes).
Fixed fields (all record types):
| Position | Field | Description |
|---|---|---|
| 1 | Version | V6 (default) or V7 (for R-type records with extra fields) |
| 2 | Record type | R, E, W, N, or P (see below) |
| 3 | TASK start time (seconds) | Unix timestamp, seconds part |
| 4 | TASK start time (microseconds) | Microseconds part |
| 5 | Remote IP | Remote IP address of the TCP connection |
| 6 | Remote port | Remote port of the TCP connection |
| 7 | Local IP | Local IP address of the TCP connection |
| 8 | Local port | Local port of the TCP connection |
Sample log entry:
Record types and their additional fields:
R — normal TASK completion (server receives request, sends response)
A single TCP connection can have multiple R records.
| Field | Description | Unit |
|---|---|---|
| Data sent | Bytes sent by the TASK | Byte |
| Total duration | T0 to T3 (first request segment arrival to final ACK) | us |
| Minimum RTT | Minimum TCP round-trip time (RTT) during the TASK | us |
| Retransmissions | TCP segments retransmitted during the TASK | count |
| TASK sequence number | 1-based index; the first TASK after connection establishment is 1 | — |
Service delay (process_time) |
T1 to T2 (last request segment to first response segment) | us |
Upload delay (upload_time) |
T0 to T1 (first to last request segment) | us |
| Data received | Bytes received by the TASK | Byte |
| Receive reordering | 1 = out-of-order reception occurred; 0 = none |
— |
| MSS | Maximum segment size (MSS) used during the TASK | Byte |
| Smoothed RTT at end | Smoothed RTT at TASK end. Reported only in http/https mode (tcprt, V7). |
us |
| Congestion window at end | Congestion window size at TASK end. Reported only in http/https mode (tcprt, V7). |
segments |
Extended R record types (tcprt only, V7):
| Type | When it appears | What it means |
|---|---|---|
R.C |
http or https mode |
TASK triggered by an HTTP Expect: 100-continue request (no application data) |
R.Z |
https mode |
TASK belongs to a TLS 1.3 0-RTT handshake |
R.A |
https mode |
TASK contains a TLS Close Notify alert message |
R.H |
https mode |
TASK belongs to a TLS handshake phase. For TLS 1.2 (four-way handshake), two R.H records are generated. For TLS 1.3 (three-way handshake), one R.H record is generated and includes handshake duration. Trailing field format: H <time_us>. Example: H 151878 means the handshake took 151,878 us. |
R.F |
When first_frame is enabled |
Completion-time statistics by byte thresholds. Trailing field format: F <n> [bytes time] .... Example: F 6 7240 214 63698 311 98436 358 — n=6 is the total count of individual numbers (three pairs); completion times of 214, 311, and 358 us correspond to data volumes of 7,240, 63,698, and 98,436 bytes. |
Extended types can be combined. For example, R.AF means both A and F apply.
R.AandR.Cuse response data volume as the detection criterion and may have minor false positives.
P — outbound TASK completion (local server acts as client)
P records appear only when pports or pports_range is configured. A single TCP service can have multiple P records.
| Field | Description | Unit |
|---|---|---|
| Data sent | Bytes sent by the TASK | Byte |
| Total duration | From sending request to receiving the final remote response | us |
| Minimum RTT | Minimum TCP RTT during the TASK | us |
| Retransmissions | TCP segments retransmitted | count |
| TASK sequence number | 1-based index | — |
| Service time | From request completion to first response receipt | us |
| Response receive time | From first to last response packet receipt | us |
| Data received | Total response bytes received | Byte |
| Receive reordering | 1 = out-of-order occurred; 0 = none |
— |
| MSS | Maximum segment size used during the TASK | Byte |
E — connection closure
Each TCP connection produces exactly one E record. Connections with pports or pports_range configured also generate this record.
| Field | Description | Unit |
|---|---|---|
| Last TASK sequence number | Sequence number of the final TASK | — |
| Total data sent | Bytes sent across the full TCP lifecycle | Byte |
| Unacknowledged data | Bytes sent but not acknowledged at closure; 0 if none |
Byte |
| Total data received | Bytes received across the full TCP lifecycle | Byte |
| Retransmissions | TCP segments retransmitted across the lifecycle | count |
| Minimum RTT | Minimum TCP RTT across the lifecycle | us |
N — connection closed during request reception
A connection has at most one N record.
| Field | Description | Unit |
|---|---|---|
| Last TASK sequence number | Sequence number of the final TASK | — |
| Duration | Receive-only duration (connection closed before a response was sent) | us |
| Data received | Bytes received across the TCP lifecycle | Byte |
| Receive reordering | 1 = out-of-order occurred; 0 = none |
— |
| MSS | Maximum segment size used | Byte |
W — connection closed during response transmission
A connection has at most one W record.
| Field | Description | Unit |
|---|---|---|
| Response data sent | Bytes of response data already sent for the last TASK | Byte |
| Duration | Partial duration (connection closed before response was complete) | us |
| Minimum RTT | Minimum TCP RTT for the last TASK | us |
| Retransmissions | TCP segments retransmitted for the last TASK | count |
| Last TASK sequence number | Sequence number of the final TASK | — |
| Service delay | T1 to T2 for the last TASK | us |
| Upload delay | T0 to T1 for the last TASK | us |
| Unacknowledged response data | Response bytes sent but not acknowledged; 0 if none |
Byte |
| Receive reordering | 1 = out-of-order occurred; 0 = none |
— |
| MSS | Maximum segment size used for the last TASK | Byte |
For data-sent fields: if a TASK is the last one in a connection, the reported size is one byte less than the actual sent bytes (to account for the FIN flag). If the connection ends with an RST after a completed TASK, the actual bytes sent are one byte greater than the displayed value. The margin of error is always one byte.
Stats file format
The stats file aggregates metrics by port (server port or client port) and is output periodically. Fields appear left to right:
| Position | Field | Unit |
|---|---|---|
| 1 | Timestamp | — |
| 2 | Reserved field (always all) |
— |
| 3 | Port number | — |
| 4 | Average total TASK duration (from R records) | us |
| 5 | Average service delay (from R records) | us |
| 6 | Packet loss rate | per mille (‰) |
| 7 | Average RTT | us |
| 8 | Rate of TASKs closed during request transmission | per mille (‰) |
| 9 | Average data sent per TASK | Byte |
| 10 | Average upload delay | us |
| 11 | Average data received per TASK | Byte |
| 12 | Number of TASKs included in the statistics | count |
tcprt vs tcp_rt.ko
| tcprt | tcp_rt.ko | |
|---|---|---|
| Log file path | Same | Same |
| Log format | Extends V7 format (backward compatible with V6) | V6 only |
| Feature management | systemctl |
modprobe / rmmod |
| Configuration | /etc/tcprt-bpf/tcprt.yaml |
/sys/module/tcp_rt/parameters/* |
| System requirements | Alibaba Cloud Linux 3, kernel >= 5.10.134-17 | Alibaba Cloud Linux 2 (kernel >= 4.19.91-21.al7) or Alibaba Cloud Linux 3 |
| Parsing modes | default, http, https |
default only |
first_frame feature |
Supported | Not supported |
FAQ
Why does ls -l show a larger file size than I configured?
Log files live in the /sys virtual filesystem (via debugfs) and do not occupy disk space. The size reported by ls -l tracks cumulative log volume written over time, not current buffer usage, so it grows continuously and exceeds the configured buffer size. To check the actual log content size, redirect the file to a regular file and inspect it:
cat /sys/kernel/debug/tcp-rt/rt-network-log0 > /tmp/tcprt-sample.log
ls -lh /tmp/tcprt-sample.log
The redirected file reflects the actual data available (up to the configured 2 MB limit per default settings).