Service Mesh (ASM) integrates with Managed Service for OpenTelemetry to provide end-to-end visibility into your microservices. With distributed tracing enabled, you can view trace data, display trace topologies, analyze application dependencies, and track request counts across services.
How it works
Sidecar proxies in an ASM instance automatically generate and send spans for every request that passes through the mesh. However, proxies alone cannot correlate spans into a complete end-to-end trace. To connect the spans, your application must propagate trace context headers -- forwarding specific headers from each incoming request to all outgoing requests triggered by that incoming request.
Without header propagation, the tracing backend receives isolated spans that it cannot join into a single trace. Each proxy-generated span appears as a separate, unrelated entry.
Trace context headers
ASM supports two propagation formats: B3 and W3C Trace Context. The default format depends on the ASM instance version.
ASM instances of V1.18.0.124 or earlier use B3 propagators by default. ASM instances of versions later than V1.18.0.124 use W3C Trace Context propagators by default.
B3 propagation headers
Forward these headers when using B3 propagation:
-
x-request-id -
x-b3-traceid -
x-b3-spanid -
x-b3-parentspanid -
x-b3-sampled -
x-b3-flags -
x-ot-span-context
W3C Trace Context headers
Forward these headers when using W3C Trace Context propagation:
-
traceparent -
tracestate
Prerequisites
Before you begin, make sure that you have:
-
Managed Service for OpenTelemetry activated for your Alibaba Cloud account. For billing details, see Billing rules.
-
An ASM instance with Managed Service for OpenTelemetry enabled. For setup instructions, see Collect ASM tracing data to Managed Service for OpenTelemetry.
-
An application deployed in an ACK cluster that is added to the ASM instance. See Deploy an application in an ACK cluster that is added to an ASM instance.
Propagate trace context headers in your application
The Bookinfo sample application demonstrates how to propagate trace context headers in different languages.
productpage service (Python)
The productpage service uses OpenTracing libraries to extract and forward B3 headers:
def getForwardHeaders(request):
    headers = {}
    # x-b3-*** headers can be populated using the opentracing span
    span = get_current_span()
    carrier = {}
    tracer.inject(
        span_context=span.context,
        format=Format.HTTP_HEADERS,
        carrier=carrier)
    headers.update(carrier)
    # ...

    incoming_headers = ['x-request-id']

    # ...

    for ihdr in incoming_headers:
        val = request.headers.get(ihdr)
        if val is not None:
            headers[ihdr] = val
    return headers
reviews service (Java)
The reviews service extracts B3 headers from incoming requests and passes them to downstream calls:
@GET
@Path("/reviews/{productId}")
public Response bookReviewsById(@PathParam("productId") int productId,
                            @HeaderParam("end-user") String user,
                            @HeaderParam("x-request-id") String xreq,
                            @HeaderParam("x-b3-traceid") String xtraceid,
                            @HeaderParam("x-b3-spanid") String xspanid,
                            @HeaderParam("x-b3-parentspanid") String xparentspanid,
                            @HeaderParam("x-b3-sampled") String xsampled,
                            @HeaderParam("x-b3-flags") String xflags,
                            @HeaderParam("x-ot-span-context") String xotspan) {

  if (ratings_enabled) {
    JsonObject ratingsResponse = getRatings(Integer.toString(productId), user, xreq, xtraceid, xspanid, xparentspanid, xsampled, xflags, xotspan);
Access the Bookinfo application
Open the following URL in your browser:
http://{IP address of the ingress gateway}/productpageReplace {IP address of the ingress gateway} with the actual IP address of your ASM ingress gateway.
View trace data in the OpenTelemetry console
After you deploy your application with header propagation, view the trace data in the Managed Service for OpenTelemetry console.
View the applications list
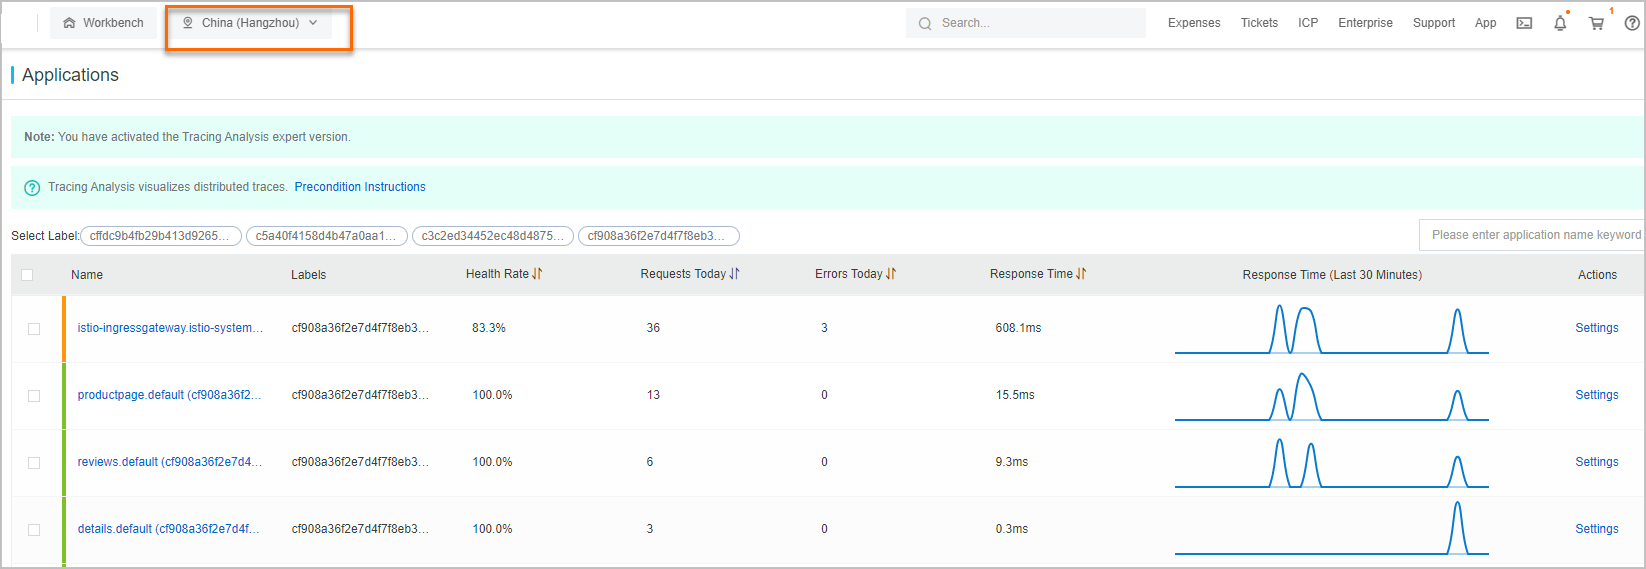
The Applications page shows requests, errors, and duration for all monitored applications. Use the Filter by Tag button to filter applications.
-
Log on to the Managed Service for OpenTelemetry console.
-
In the left-side navigation pane, click Applications. At the top of the page, select the target region.

View application details
The application details page shows call topology, traces, and key metrics for each server where the application is deployed.
-
Log on to the Managed Service for OpenTelemetry console.
-
In the left-side navigation pane, click Applications. Select the target region, then click the name of the application.
-
On the application details page, click the Overview tab to view key metrics, or click the Trace Explorer tab to view traces. A maximum of 100 traces are listed in descending order by time consumed.

View the waterfall chart of a trace
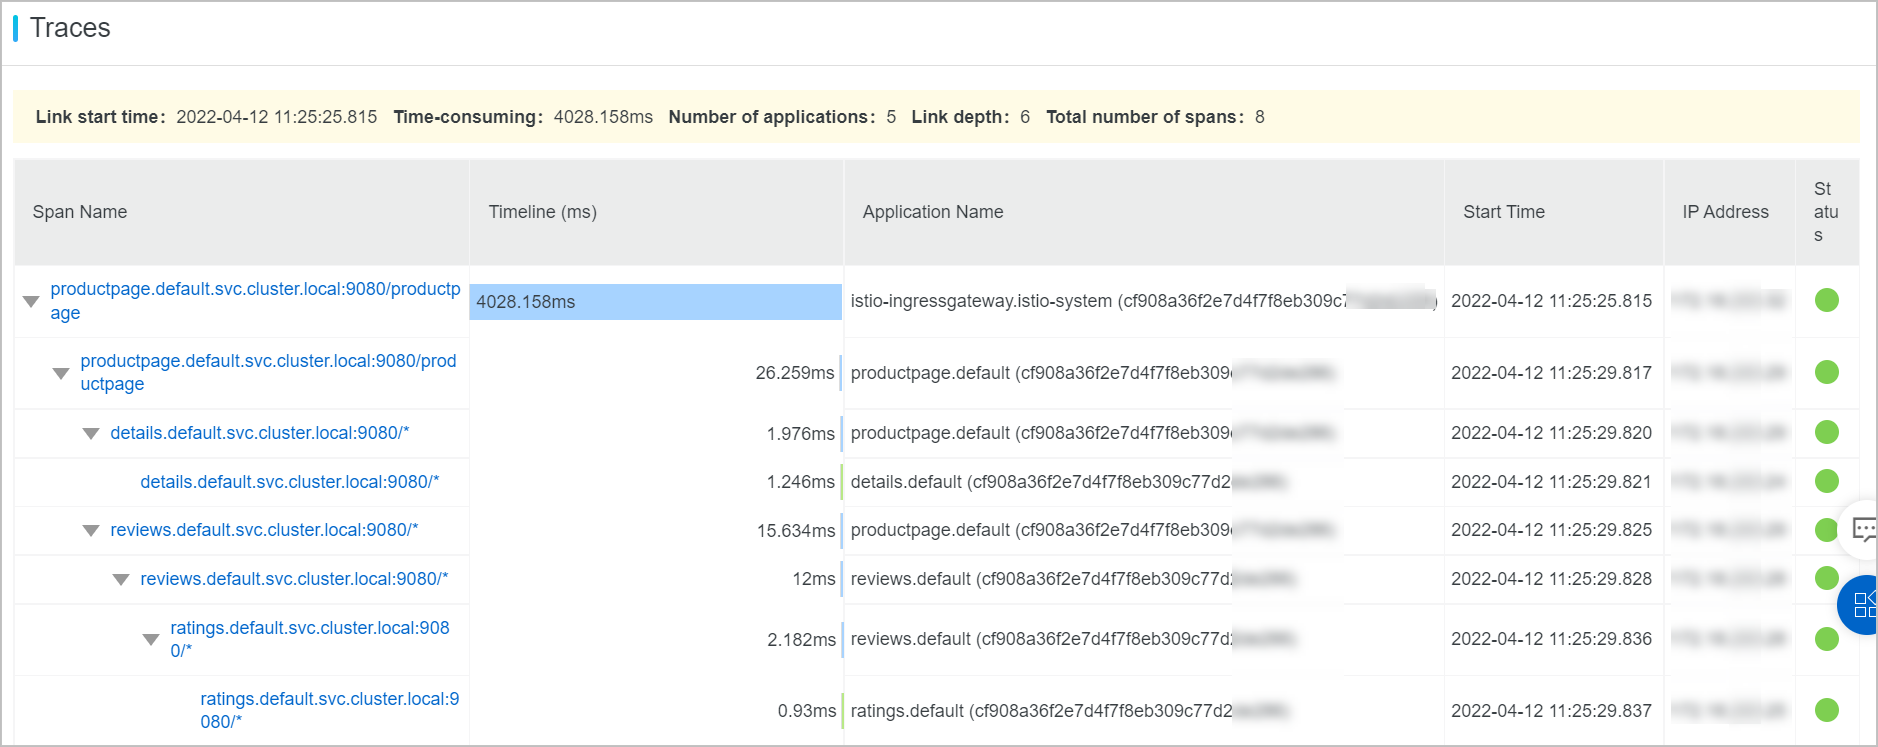
The waterfall chart displays each span in a trace with its log generation time, status, IP address or server name, service name, and timeline. Each sidecar proxy generates spans on both the inbound (server) and outbound (client) side of a request, so a single hop between two meshed services produces multiple proxy spans.
-
On the application details page, click the Trace Explorer tab. In the trace list, click the trace ID.
-
View the waterfall chart on the page that appears.
Note-
The IP Address column may display IP addresses or server names depending on the settings configured on the Application Settings page. For more information, see Manage applications and tags.
-
Hover over a service name to view span details including duration, start time, tags, and log events. For more information, see Application details.

-
FAQ
Why can't I see trace data after enabling tracing in the ASM console?
This can happen when the daily usage quota is exceeded. When actual data volume exceeds the configured limit, the system stops data writing and no traces are displayed.
To verify and fix this issue:
-
View the trace push logs.
-
Obtain the kubeconfig file of the cluster and use kubectl to connect to the cluster. For more information, see Obtain the kubeconfig file of a cluster and use kubectl to connect to the cluster.
-
Run the following command to view the trace push logs of the pods related to the tracing-on-external-zipkin deployment in the istio-system namespace:
kubectl logs "$(kubectl get pods -n istio-system -l app=tracing -o jsonpath='{.items[0].metadata.name}')" -n istio-system -c nginxThe status code 406 is recorded in the trace push logs.

-
-
View the quota usage.
-
Log on to the Managed Service for OpenTelemetry console.
-
In the left-side navigation pane, expand System Configuration, then click Cluster Configuration to view the quota usage.

If the actual usage exceeds the configured limit, the system stops data writing and no trace information is displayed.
-
-
Increase the quota.
-
On the Cluster Configuration page, increase the quota value under Quota Configuration, then click Save.
-
In the Note dialog that appears, click OK.
-
Why does the trace ID change after passing through the ingress gateway or sidecar?
The sidecar proxy regenerates propagation headers when it receives a request with incomplete trace context. To preserve your trace ID, include the minimum required headers:
-
B3 format:
x-b3-traceidandx-b3-spanid -
W3C Trace Context format:
traceparent