Feature configuration is a core step in setting up your recommendation solution. You define features through the user interface, which automatically generates the necessary MaxCompute and Flink SQL code. This process produces common statistical features, sequence features, MinMax features, and key-value features, and outputs them as samples for vector recall, coarse ranking, and fine ranking models.
1. Common period and behavior configuration
-
Common periods: Define custom statistical periods, such as short, medium, and long-term. Avoid using too many periods, as this generates an excessive number of features. For example, generating 200 features per period means three periods produce 600 features, while six periods produce 1,200.
-
Behaviors of interest: These are the enumerated behavior values from your behavior log table. Use five or fewer behaviors to avoid creating too many features. If you have many behavior types, you can merge less important or semantically similar ones during data preparation in the upstream tables. The order of behaviors is important. They should be listed in the sequence they occur, such as "exposure, click, praise" (corresponding to the
expr,click, andpraisevalues from theeventfield). An incorrect order affects ratio feature generation and requires manual correction.
On the configuration page, set statistical periods in the "Common periods" section and specify behavior enum values in the "Behaviors of interest" section. Click the Generate Feature button at the bottom of the page to automatically derive the statistical features.
2. Basic derived features
For example, on the user side, the basic attribute features might originally include fields like gender, city, follow_cnt, register_time, and age. You can add an elapsed time calculation feature, select register_time as the associated field, and generate the feature named user_register_time. Then, you can add a feature binning feature, select user_register_time as the associated field, set the split point to 3, and generate the feature named user_register_time_bin.
Some basic attribute features are derived automatically from your upstream table configurations, but you can click Add to create more. Note that you can derive basic attribute features on the user side, item side, and from the behavior log table.
-
IP address resolution: Derives features from an IP field configured in an upstream table. Based on your configuration, the system can resolve an IP address into its province, city, and country. Note that resolution results may be inaccurate.
-
Elapsed time calculation: Calculates the number of days since a user's or item's registration date.
-
Feature binning: Divides a numerical field into bins based on specified split points, converting it into a categorical feature.
-
Feature combination: This combines multiple categorical fields, such as category-category, category-tag, or tag-tag combinations. The combined fields must belong to the same table and be entirely on either the user side or the item side.
For the behavior log table, both hour of day extraction and day of week extraction are derived from the event_time field, generating features named day_h and week_day respectively.
For the behavior log table, these two derivations are also available:
-
Hour of day extraction: Derives the hour of the day from a log entry.
-
Day of week extraction: Derives the day of the week from a log entry.
After adding basic derived features, click Save in the upper-right corner to apply your changes.
3. Behavior preference features
The system automatically derives various statistical features for both the user side and item side, using user IDs and item IDs as the primary keys for aggregation. The following six types of statistics are available:
-
Behavior statistics
-
Conversion rate calculation
-
Top attribute behavior count
-
Top attribute behavior ratio
-
Preferred numerical features
-
Top category-numerical combination feature
To remove unnecessary features, click Delete, or click Edit to remove a specific attribute. Click Add in the lower-right corner to add more features. The following sections describe these statistical feature types in detail.
-
Behavior statistics
This counts the number of times a user performs specific behaviors (such as expr, click, or praise) within defined periods (for example, 3, 7, and 15 days). If a Deduplication ID is provided, the count is performed after deduplication by that ID. If a scenario is configured, only behaviors within that scenario are counted. With 3 statistical periods and 3 behaviors, this example generates 9 features (3 periods × 3 behaviors = 9).
-
Conversion rate calculation
In this example, 3 statistical periods (3, 7, and 15 days) and 2 conversion rate formulas (
click/exprandpraise/click) are configured.This feature calculates the conversion rate between behaviors. It computes the ratio of one behavior count to another over specific periods, such as dividing the
clickcount by theexprcount, or thepraisecount by theclickcount. You can modify, add, or delete these formulas. If a scenario is configured, only behaviors from that scenario are included. This example configuration generates 6 features (number of statistical periods × number of conversion rate formulas). -
Top attribute behavior count
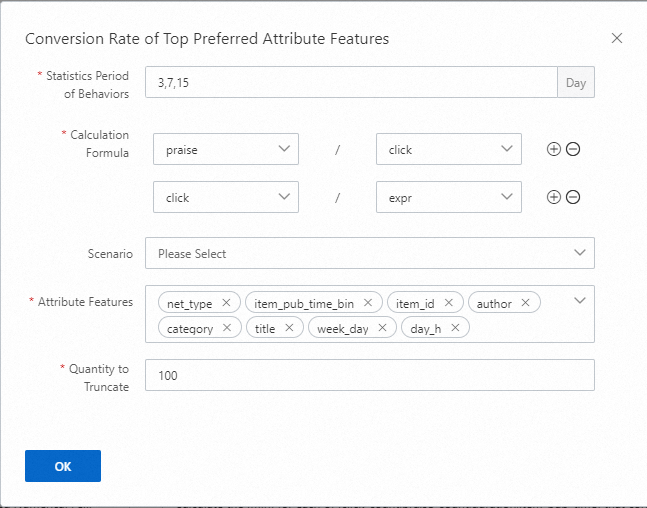
This feature counts how many times a user performs a behavior (like
expr,click, orpraise) for each value of a categorical or multi-valued attribute feature within a given period (e.g., 3, 7, or 15 days). The result is a key-value feature. For example, using the categoryday_hand theclickbehavior, a generated feature like "12:27.0,8:26.0,1:1.0" means that within the current period, the user clicked 27 times during hour 12, 26 times during hour 8, and 1 time during hour 1. If a scenario is configured, only data from that scenario is used. If the number of keys becomes too large, it is truncated to 100 by default. This example configuration generates 54 features (number of statistical periods × number of behaviors × number of attribute features). -
Top attribute behavior ratio
This feature calculates the ratio of behaviors, such as
click/expr(click-through rate, CTR) orpraise/click, for each value of a categorical or multi-valued attribute feature within a given period (e.g., 3, 7, or 15 days). The result is a key-value feature. For example, withcateas the category andclick/expras the formula, a generated feature like "12:0.27,8:0.26" means the user's CTR for category 12 is 0.27 and for category 8 is 0.26 within the current period. If a scenario is configured, only data from that scenario is used. If the number of keys is too large, it is truncated to 100 by default. This example configuration generates 36 features: 3 statistical periods (3, 7, 15 days) × 2 conversion rate formulas (click/expr,praise/click) × 6 attribute features. -
Preferred numerical features
In this example, the 4 selected numerical features are
click_count,praise_count,duration, anditem_pub_time.This feature aggregates a selected numerical attribute based on a specific behavior (like
expr,click, orpraise) and a calculation logic (such as sum, max, min, or average) within a given period (e.g., 3, 7, or 15 days). If a scenario is configured, only data from that scenario is used. This example configuration generates 36 features (number of statistical periods × number of behaviors × number of numerical features). -
Top category-numerical combination feature
In this example, the categorical features for the combination are
category,day_h, andweek_day. The numerical feature isplaytime, and the truncation quantity is set to 100.This feature calculates a user's preference for a numerical value within a specific category. It aggregates a numerical value based on a calculation logic (such as sum, max, min, or average) for each behavior (like
expr,click, orpraise) within a given period (e.g., 3, 7, or 15 days). If a scenario is configured, only data from that scenario is used. This example configuration generates 27 features (number of statistical periods × number of behaviors × number of categorical features in the combination).
4. Sequence feature
Sequence features can only be configured on the user side. Because sequence features are often unavailable at the beginning of a recommendation project, you can simulate them from historical behavior data. This accelerates experiments and deployment by reducing the time needed to collect online sequence features. The simulated event is typically an exposure (expr). The leakage prevention period excludes behaviors that occur within the last N seconds from the current sequence. This is crucial because log backflow during inference can cause data delays. If the simulation is too close to real-time, it can cause feature leakage during training. The sequence feature separator is the delimiter between items in a sequence, while the sub-feature separator is the delimiter between the sub-features of a single item.
In the general configuration, the Simulated event defaults to expr, the Sequence feature separator defaults to ;, and the Sub-feature separator defaults to #. The table below displays the configured sequence feature rules, with columns for Primary key, Category, Calculation logic, and Operations. Click Add to create a new rule, or use Edit and Delete to manage existing rules.
For example, set the Behavior period to 30 days, select expr for Behavior, select item_id for Deduplication ID, and select category, click_count, praise_count, and duration for Sub-feature. Set the Truncation quantity to 100.
-
Behavior period: The number of recent days from which to collect behaviors. If multiple sequences are configured, the longest period takes precedence.
-
Behavior: The type of behavior to be collected in the sequence.
-
Scenario: The scenario to filter behaviors by. If left unselected, behaviors from all scenarios are collected.
-
Deduplication ID: The sub-feature used for deduplication within the sequence. For a given ID, only the last occurrence of the behavior is retained.
-
Sub-feature: The sub-features that make up an item in the sequence. These are typically non-statistical features from the item side, including categorical, multi-valued categorical, and numerical features.
-
Truncation quantity: The maximum number of items to retain in the sequence.
5. Real-time feature
Real-time statistical features can be created with either user IDs or item IDs as the primary key. The leakage prevention period serves the same purpose as it does for sequence features: it prevents behaviors from the most recent N seconds from being included in the count. This setting is necessary because behavior logs are delayed as they are transmitted from the client, through the message-oriented middleware, and to the online storage service. Without this setting, online statistics may be inaccurate. For real-time features, the statistical period is measured in seconds. The following four statistical types are supported:
-
Behavior statistics
-
Conversion rate calculation
-
Top attribute behavior count
-
Top attribute behavior ratio
These four types have the same meaning as their counterparts in the behavior preference features section; only the statistical period unit is different.
In the configuration example, the Leakage prevention period is set to 10 seconds. With user_id as the primary key, statistics are calculated for the click and praise behaviors within a [1800, 3600] second window. The Top-N value is set to 100, and the preference attributes are category and duration_bin. Use the Edit and Delete actions in the operations column to manage rows. At the bottom, click Add to create a new configuration or View Details for more information.
6. Aggregation feature
Aggregation features can be configured on both the user side and the item side. You must select one or more aggregation conditions. Only categorical features can be used as aggregation conditions.
The system calculates features based on the current aggregation conditions. The available statistical types are the same as those for behavior preference features and have the same meanings. For example, the first row in the configuration means that the total number of click, praise, and exposure events is counted for different gender and age combinations. Taking lipstick as an example, it is more likely to be clicked by female users, so analyzing item sales statistics by gender is useful.
In the configuration table, the primary key is User ID:gender_age, and each statistical type is calculated within a [3, 10] day window based on the gender_age dimension. Manage the configuration using the Add, View Details, Add aggregation condition, and Delete aggregation condition links at the bottom of the page.