Data diagnostics analyzes user tables, item tables, and behavior tables to validate available features, guide discretization parameter settings, determine the data time window required for user preference and item feature statistics, and evaluate the data volume requirements for training samples. This ensures reasonable configuration of data quality and model training resources, improving the scientific nature of feature engineering, the efficiency of model training, and the accuracy of recommendation results.
Types of data diagnostics tasks
PAI-Rec data diagnostics includes the following task types:
Task type | Description |
Basic statistical analysis | Used to analyze the value distribution and missing rate of fields, screen effective features (exclude fields with high missing rates or abnormal fields), and investigate whether there are problems with log upload, storage, or cleaning for abnormal features. |
Analysis on item or user change rate | Used to analyze user tables or item tables. For example, you can analyze the user_id field in a user table to calculate the number and percentage of daily increases and decreases. If there are many new users, you need to consider recommendation strategies for new users. If there are many new items added daily, you need to consider recommendation strategies for cold start items. |
Analysis on statistical period of user preferences |
|
Two-table join analysis | Used to check the availability of behavioral data, ID uniqueness, and whether features are available. It is possible that when a behavior table is joined with an item table, many item feature fields are empty. You need to analyze the reasons for these empty values. |
Exception analysis | Analyzes user behavior tables by first defining upstream and downstream behaviors. Upstream behavior refers to exposure, and downstream behavior refers to click or add to cart. If the upstream behavior is click, then downstream behavior is like or comment. If you need to analyze both sets of upstream and downstream behaviors simultaneously, you need to create two diagnostics tasks. If the number of exposures or conversion rate of specific users or items is too high, analyze the user logs. |
Prerequisites
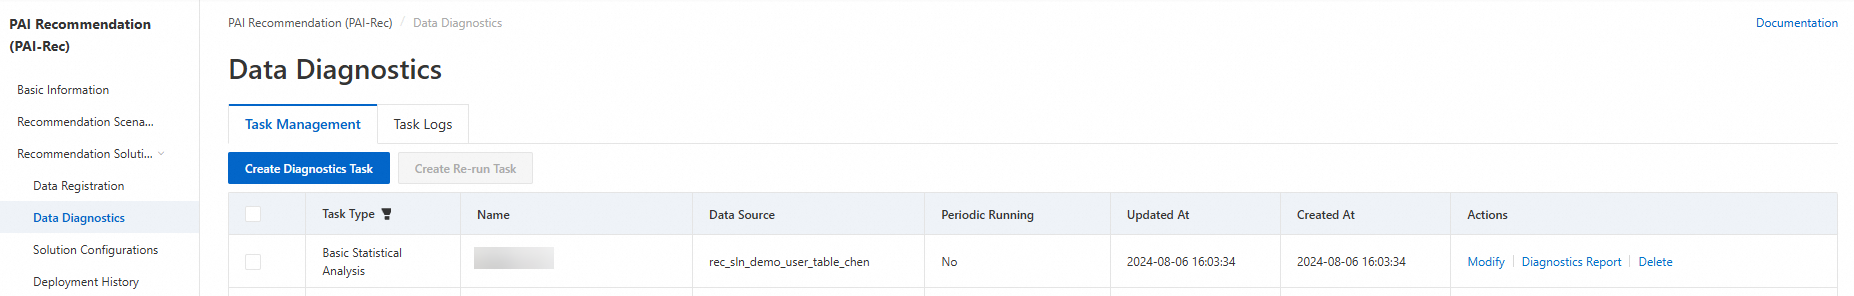
Create a diagnostics task
Log on to the PAI-Rec console, and choose in the left-side navigation pane.
On the Task Management tab, click Create Diagnostics Task. In the Create Diagnostics Task panel, select the corresponding task type and complete the relevant configurations.
Basic statistical analysis
Parameter
Description
Partition Field
Select the corresponding ds field. The yyyymmdd and yyyy-mm-dd formats are supported.
Tag Field
Select the field to analyze.
Tag Field Delimiter
Select the delimiter for the Tag fields.
KV Field
Select the fields of the KV type (such as descriptions of user category preferences). This will analyze the number of keys and the distribution of values. If there are none, you can leave this parameter empty.
KV Delimiter
Specify the delimiter for each group of KV data.
Text Field
Select data of the text type. If there is no title, you can leave this parameter empty.
Null Value of STRING Type
Specify what values are considered null values, which will be used for null value count/rate statistics.
For example, a space.
Data Percentile Distribution
Specify which data value positions need to be analyzed. Use commas (,) to separate multiple data sets.
The default percentiles for data percentile distribution are: 0%, 1%, 25%, 50%, 75%, 99%, 100%.
Periodic Running
No (default): Does not perform periodic analysis on the data table. The default business time for rerunning tasks is 7 days.
Yes: Set Periodic Running Time to perform periodic analysis on the data table.
Analysis on item or user change rate
Parameter
Description
Partition Field
Select the corresponding ds field. The yyyymmdd and yyyy-mm-dd formats are supported.
Analysis Field
Select a field with unique identification information.
Periodic Running
No (default): Does not perform periodic analysis on the data table. The default business time for rerunning tasks is 7 days.
Yes: Set Periodic Running Time to perform periodic analysis on the data table.
Analysis on statistical period of user preference
Parameter
Description
Partition Field
Select the corresponding ds field. The yyyymmdd and yyyy-mm-dd formats are supported.
User ID Field
Select a field that uniquely identifies users.
Statistical Period of Recurrence Rate
Enter the number of days for the period to calculate. If there are multiple periods to calculate, separate them with commas (,).
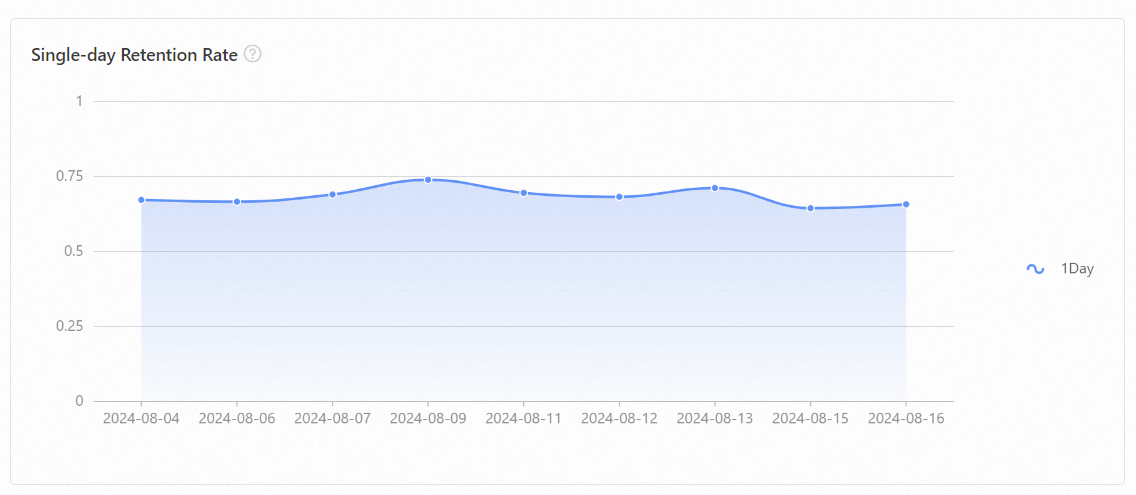
Statistical Period of Single-day Retention Rate
Enter the number of days for the period to calculate. If there are multiple periods to calculate, separate them with commas (,).
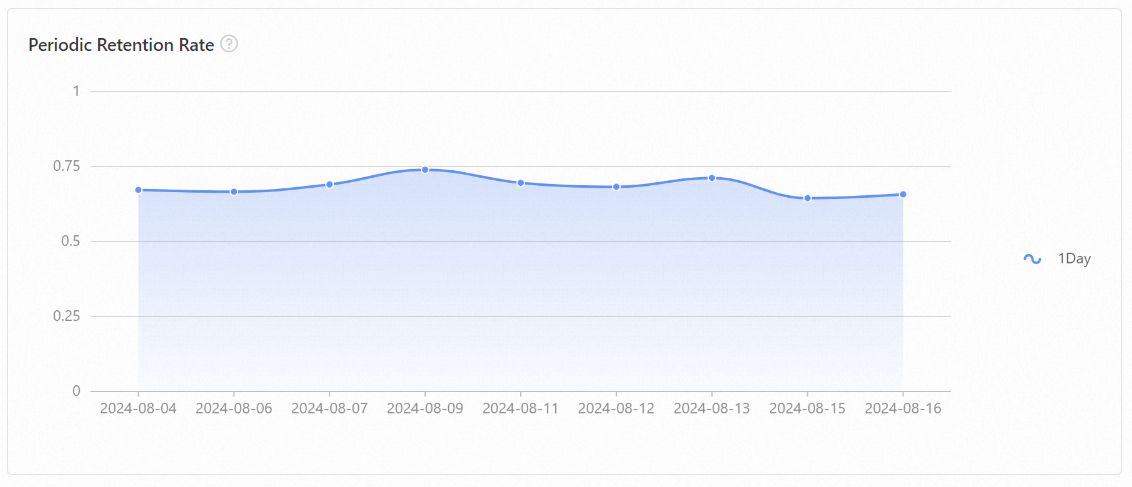
Statistical Period of Periodic Retention Rate
Specify the retention rate from one period to another, such as the retention rate of January users in February.
You can select By Week (1 week, 4 weeks, or 12 weeks) or By Month (1 month or 2 months).
Periodic Running
No (default): Does not perform periodic analysis on the data table. The default business time for rerunning tasks is 7 days.
Yes: Set Periodic Running Time to perform periodic analysis on the data table.
Two-table join analysis
Parameter
Description
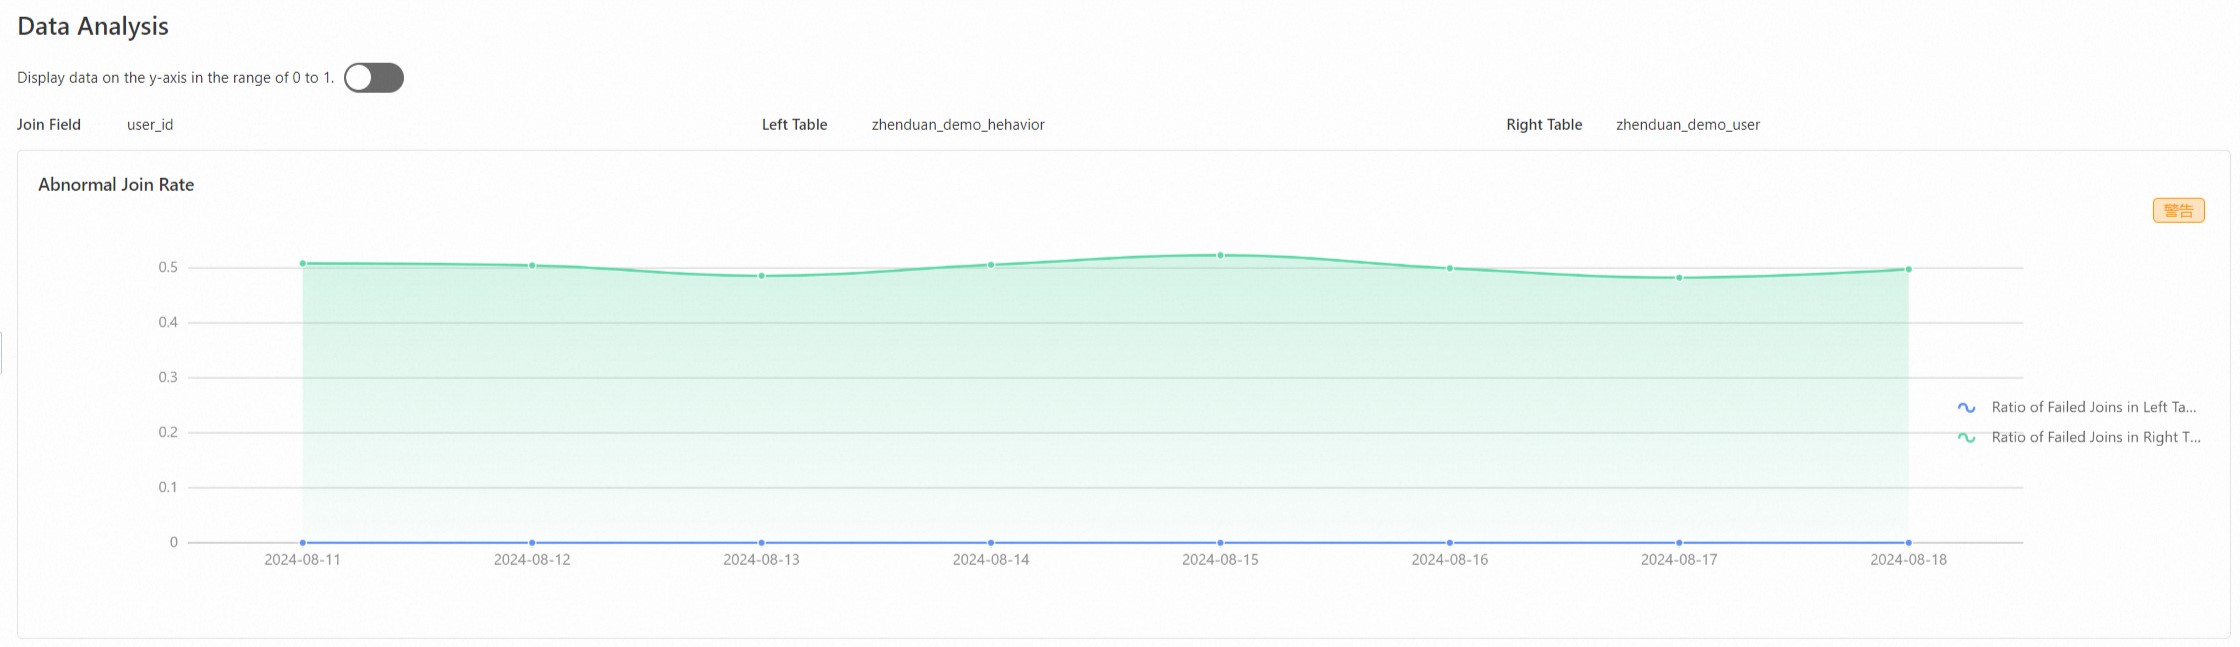
Left Table
Select the data table to be joined. The left table is typically the behavior table.
Left Table Partition Field
Select the corresponding ds field. The yyyymmdd and yyyy-mm-dd formats are supported.
Left Table Analysis Field
Select the field to analyze.
Right Table
Select the data table to be joined.
Right Table Partition Field
Select the corresponding ds field. The yyyymmdd and yyyy-mm-dd formats are supported.
Right Table Analysis Field
Select the field to analyze.
Task Name
Specify a name for the node.
Join Field
Select fields that are consistent between the left and right tables.
Join Failures Displayed
Enter the number of abnormal data records you want to see, which is used to display data that failed to join.
Example: 10.
Periodic Running
No (default): Does not perform periodic analysis on the data table. The default business time for rerunning tasks is 7 days.
Yes: Set Periodic Running Time to perform periodic analysis on the data table.
Exception analysis
Parameter
Description
Partition Field
Select the corresponding ds field. The yyyymmdd and yyyy-mm-dd formats are supported.
User ID Field
Select a field that uniquely identifies users.
Item ID Field
Select a field that uniquely identifies items.
Behavior Field
Select a field that distinguishes different behavior events.
Upstream Behaviors
Enter the upstream behavior events to analyze. If there are multiple behaviors, separate them with commas (,).
Downstream Behaviors
Enter the downstream behavior events to analyze. If there are multiple behaviors, separate them with commas (,).
Buckets
Enter the number of buckets needed for equal-interval segmentation analysis of behavioral data to analyze user distribution in each segment.
Periodic Running
No (default): Does not perform periodic analysis on the data table. The default business time for rerunning tasks is 7 days.
Yes: Set Periodic Running Time to perform periodic analysis on the data table.
Click Save And Calculate.
View diagnostics reports
After you create a diagnostics task, perform the following operations to view the reports: Choose . On the Task Management tab, click Diagnostics Report in the Actions column of the desired diagnostics task.
The following diagnostics reports are for reference only. Refer to the actual data diagnostics results.
Basic statistical analysis
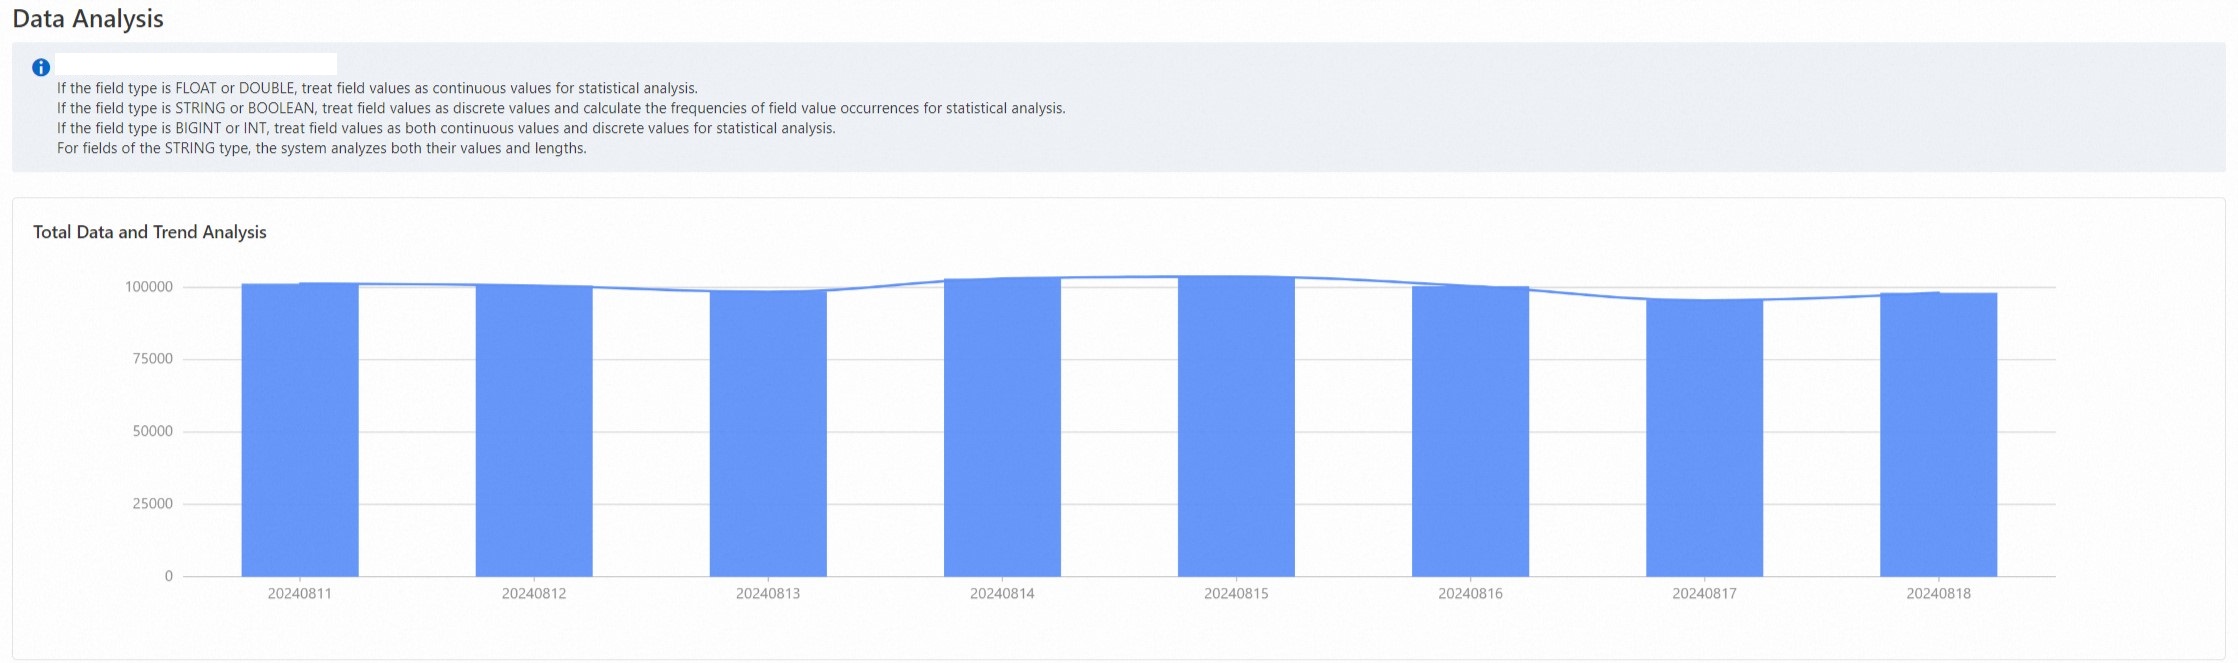
The basic statistical analysis report shows daily user volume, and information such as maximum value, minimum value, percentiles, and frequency statistics for multiple bigint features.
The diagnostic results show a missing rate greater than 0.4, requiring attention to the
cityfield.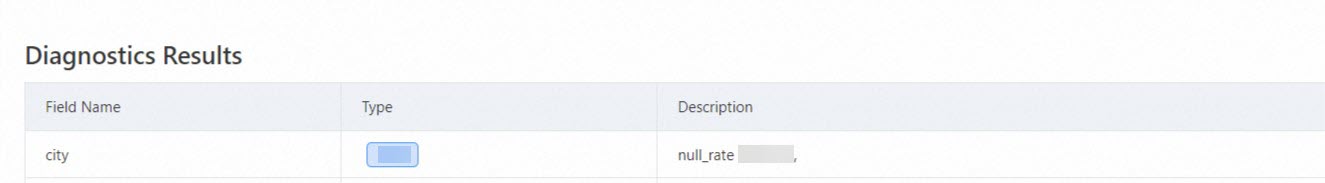
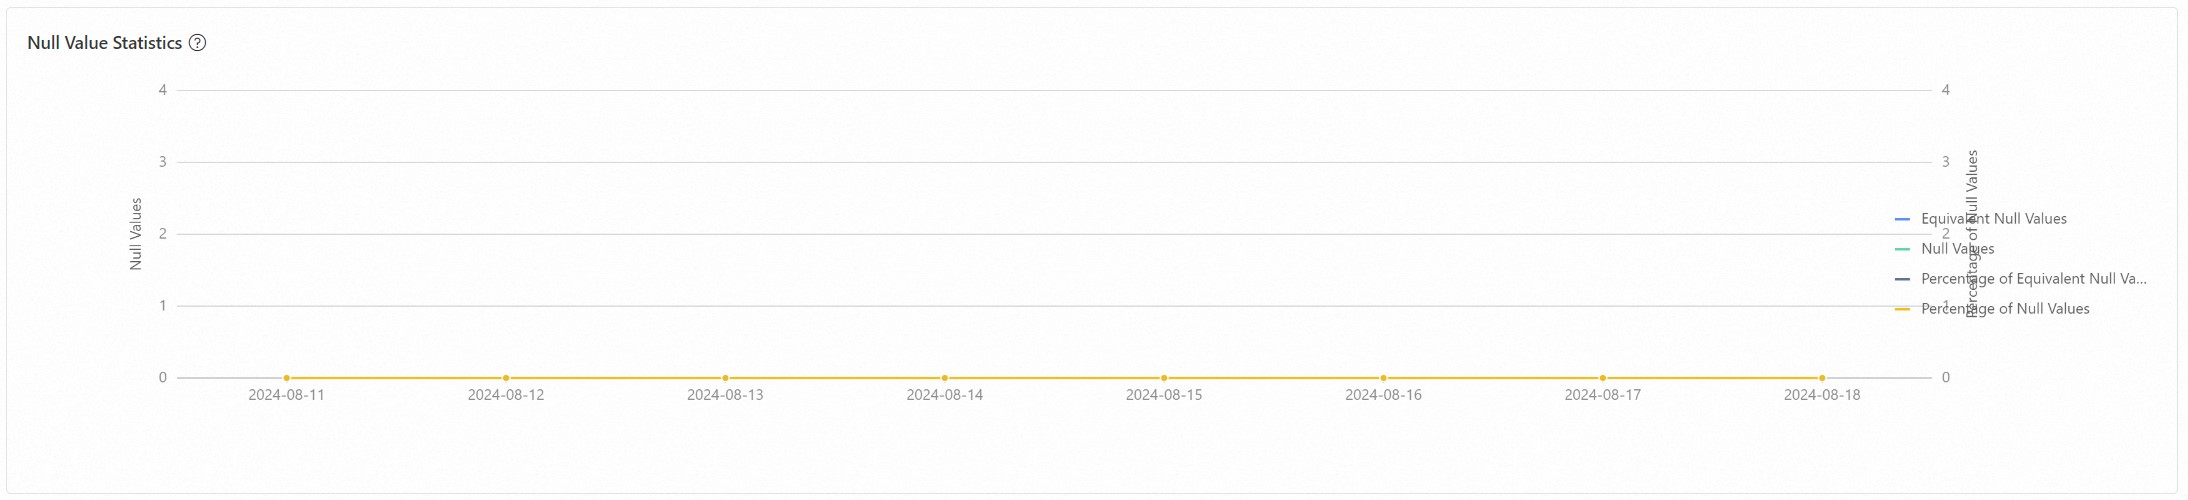
Daily data volume
Unique value statistics, showing the number of unique values in each field.
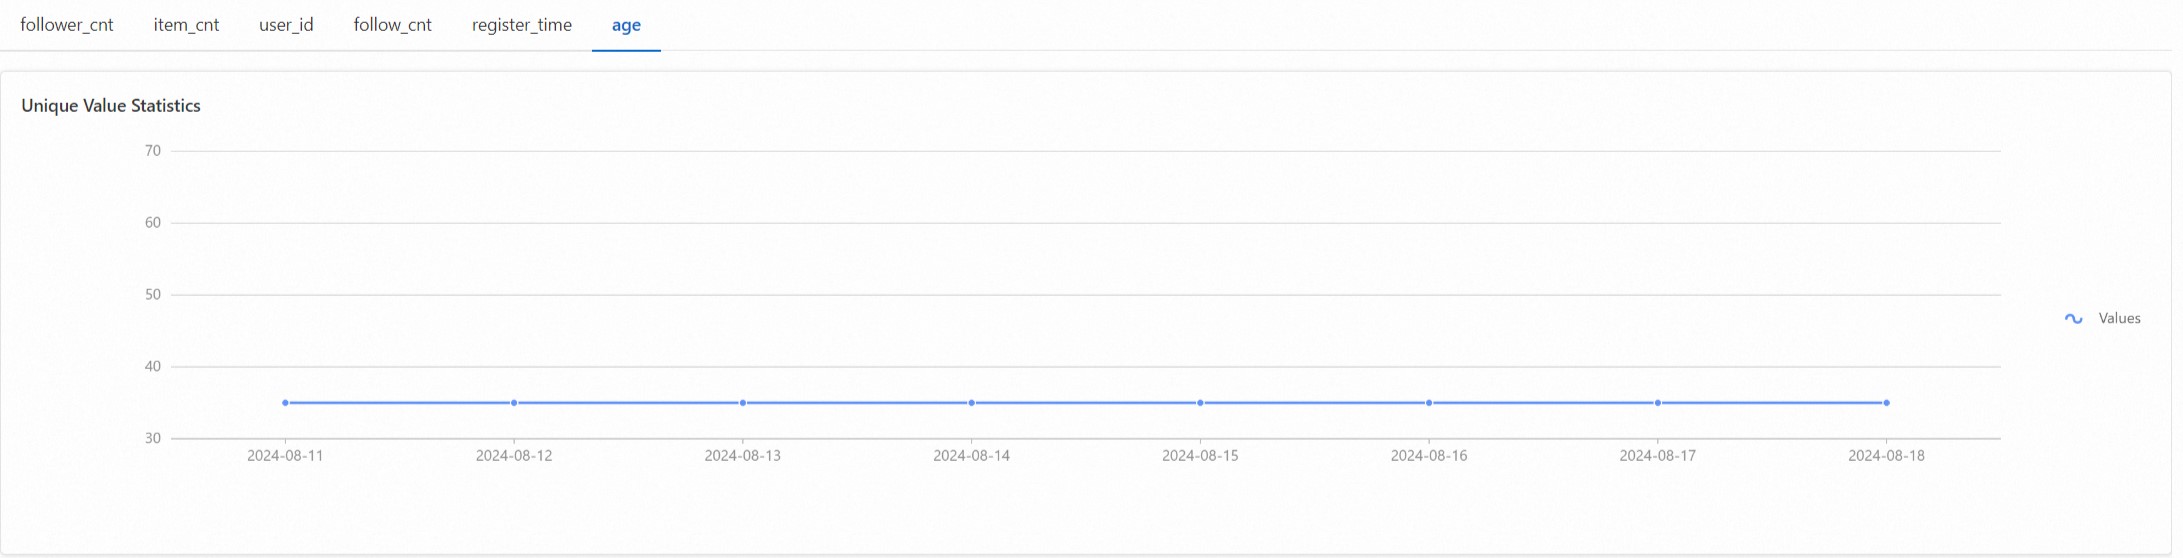
Percentile statistics. Use the age as an example. The 95th percentile is 50 years old, the maximum value is 52 years old, and the minimum value is 18 years old.

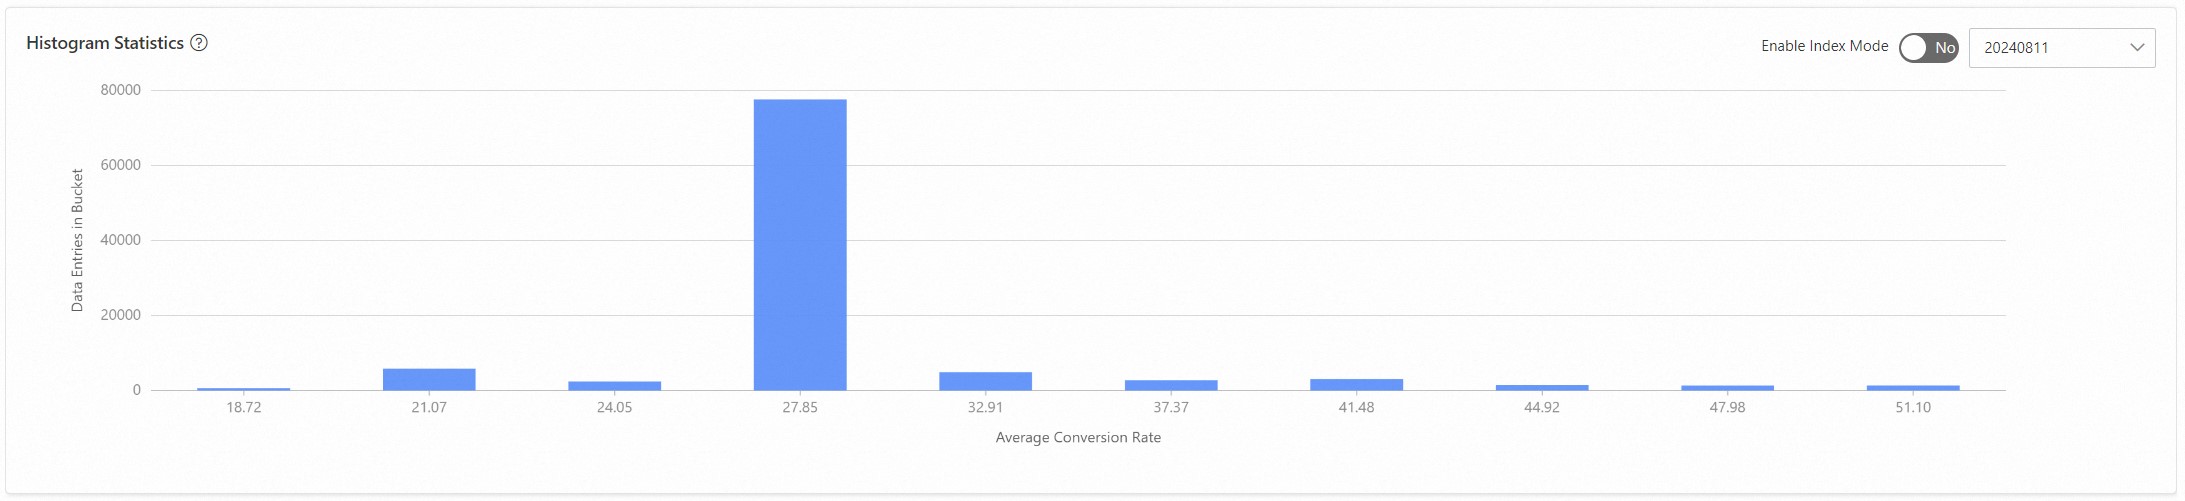
Histogram statistics, dividing the data into 10 buckets to see the number in each bucket.
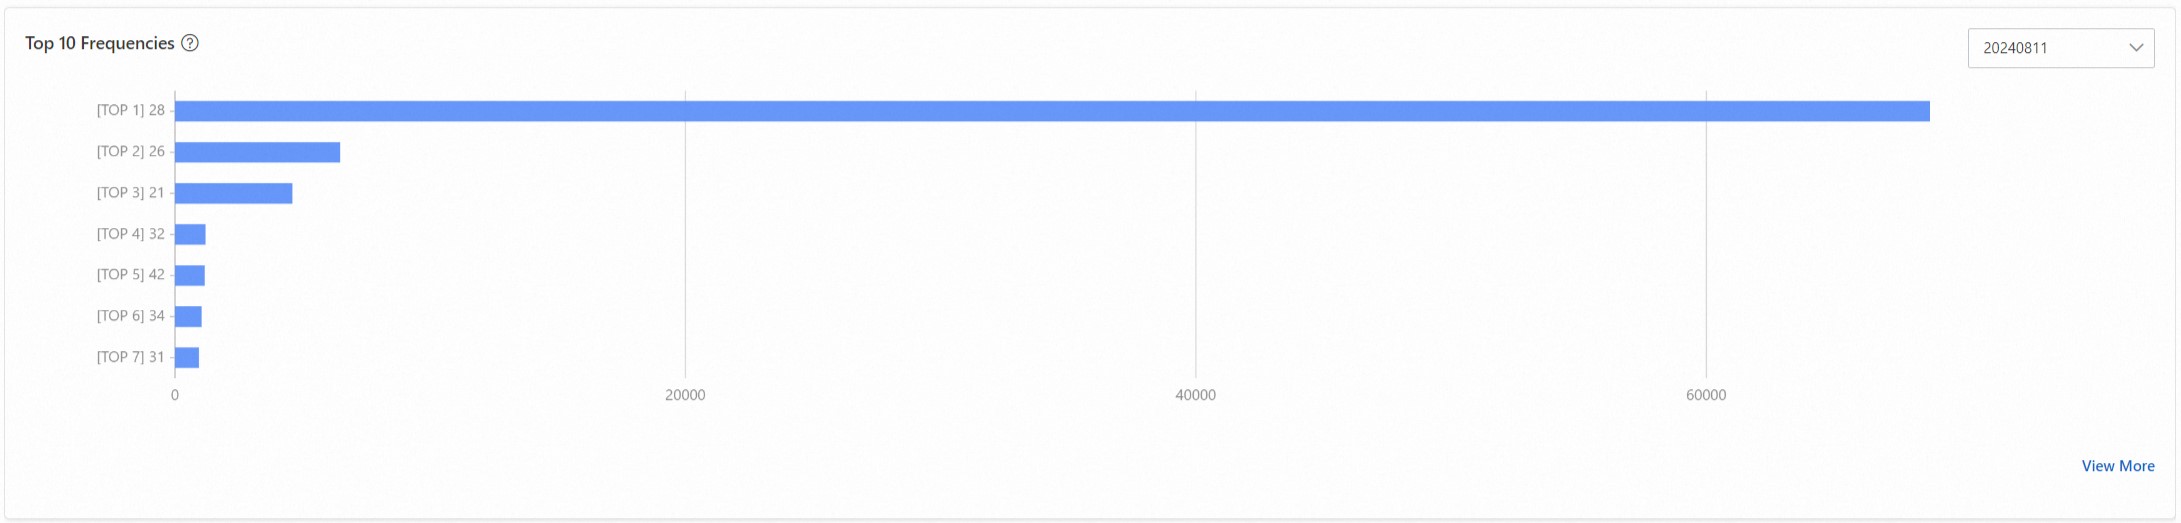
Top 10 frequency statistics. Use the age as an example. The following figure shows the top 10 ages with the highest frequency of occurrence.
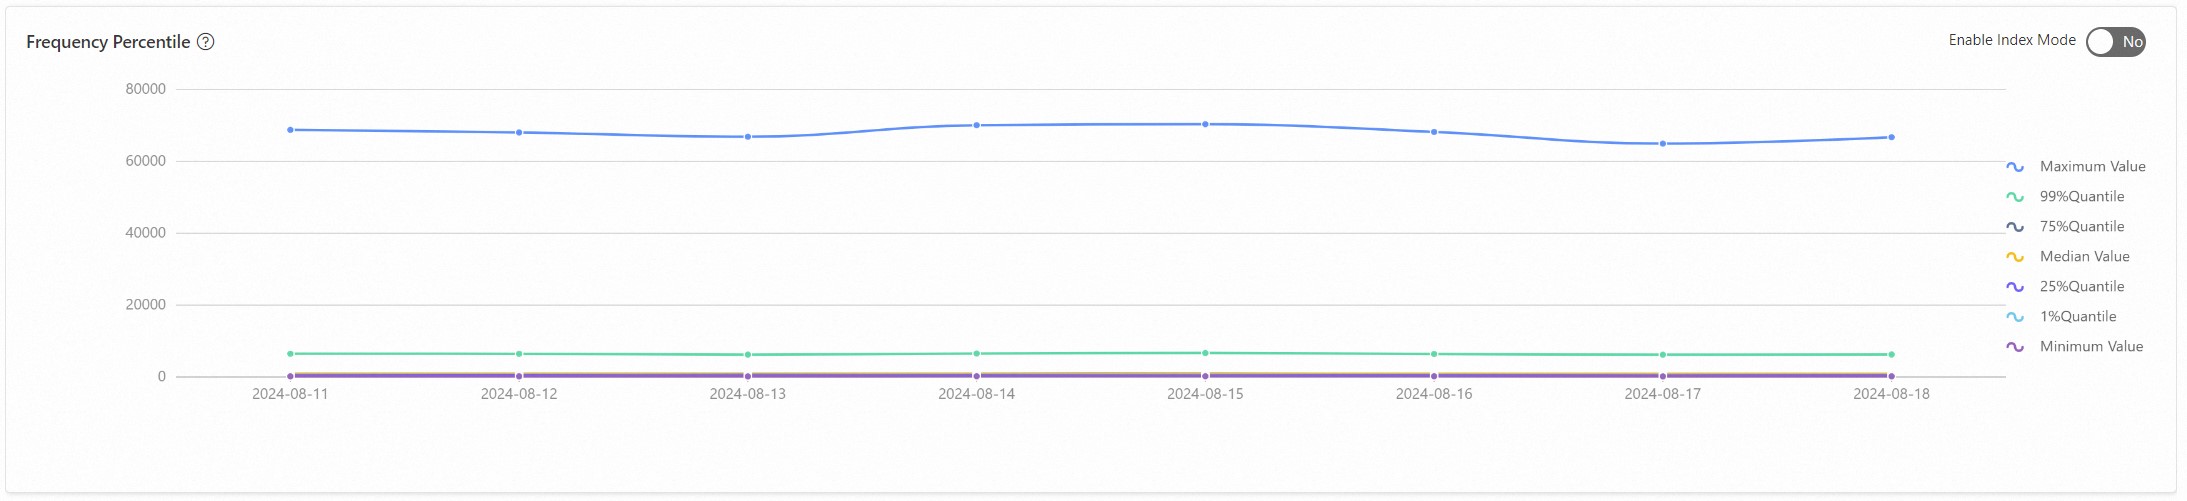
Frequency percentiles. Check whether the maximum value is consistent with the most frequent one in the Top 10 frequency statistics.
Analysis on item or user change rate
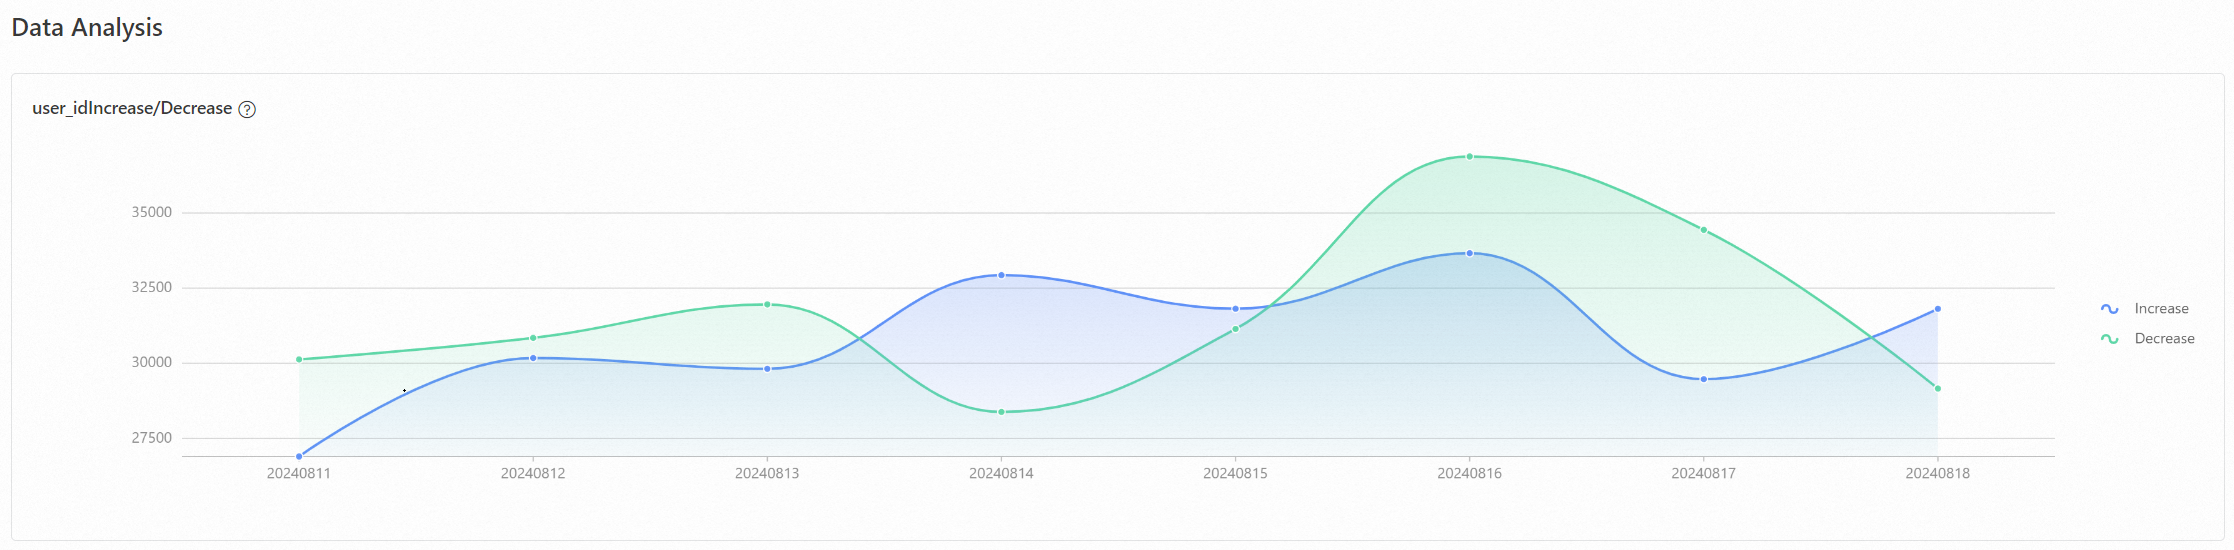
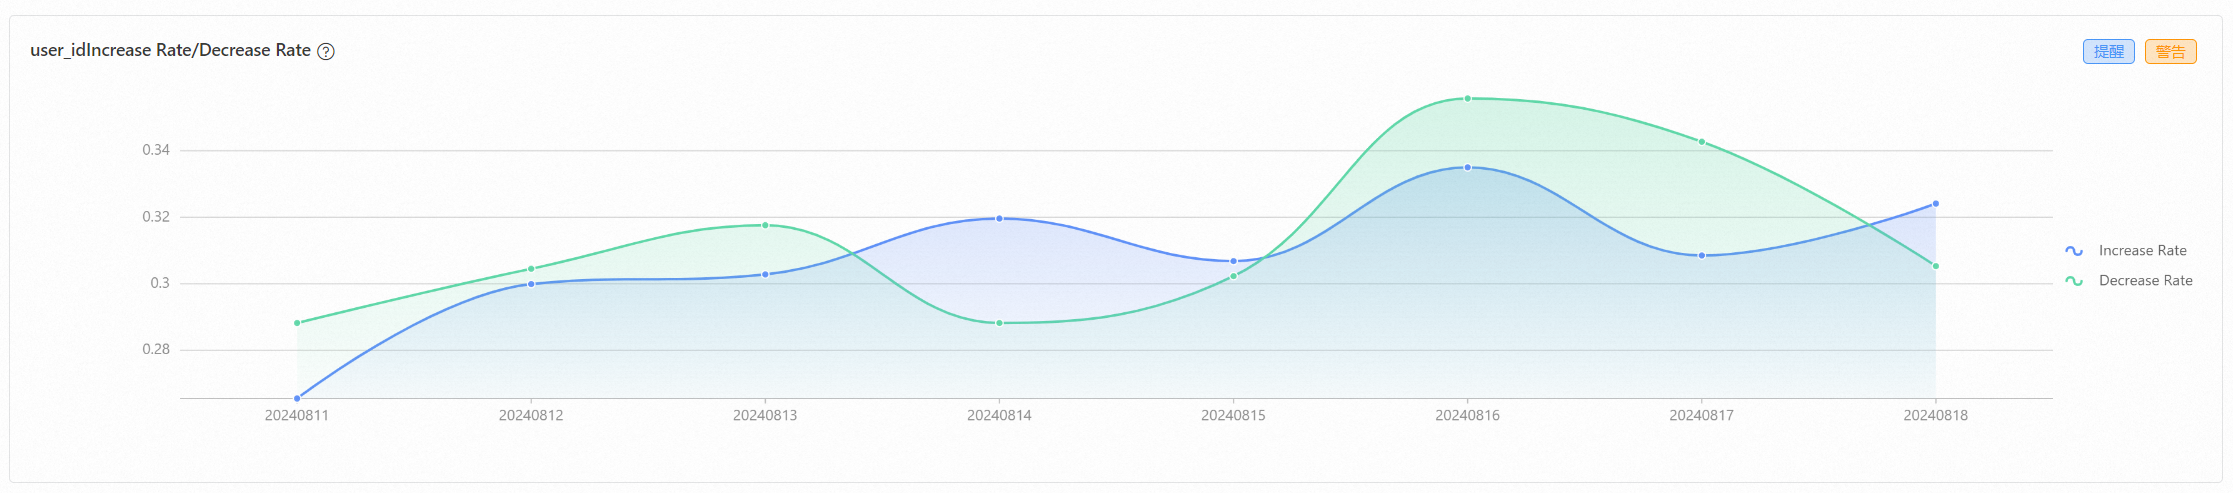
The item or user change rate analysis report shows the number of items or users added and reduced over a period of time, and the changes in addition and reduction rates. Use user table analysis as an example, the report analyzes the number of users added and reduced, and the changes in user addition and reduction rates.
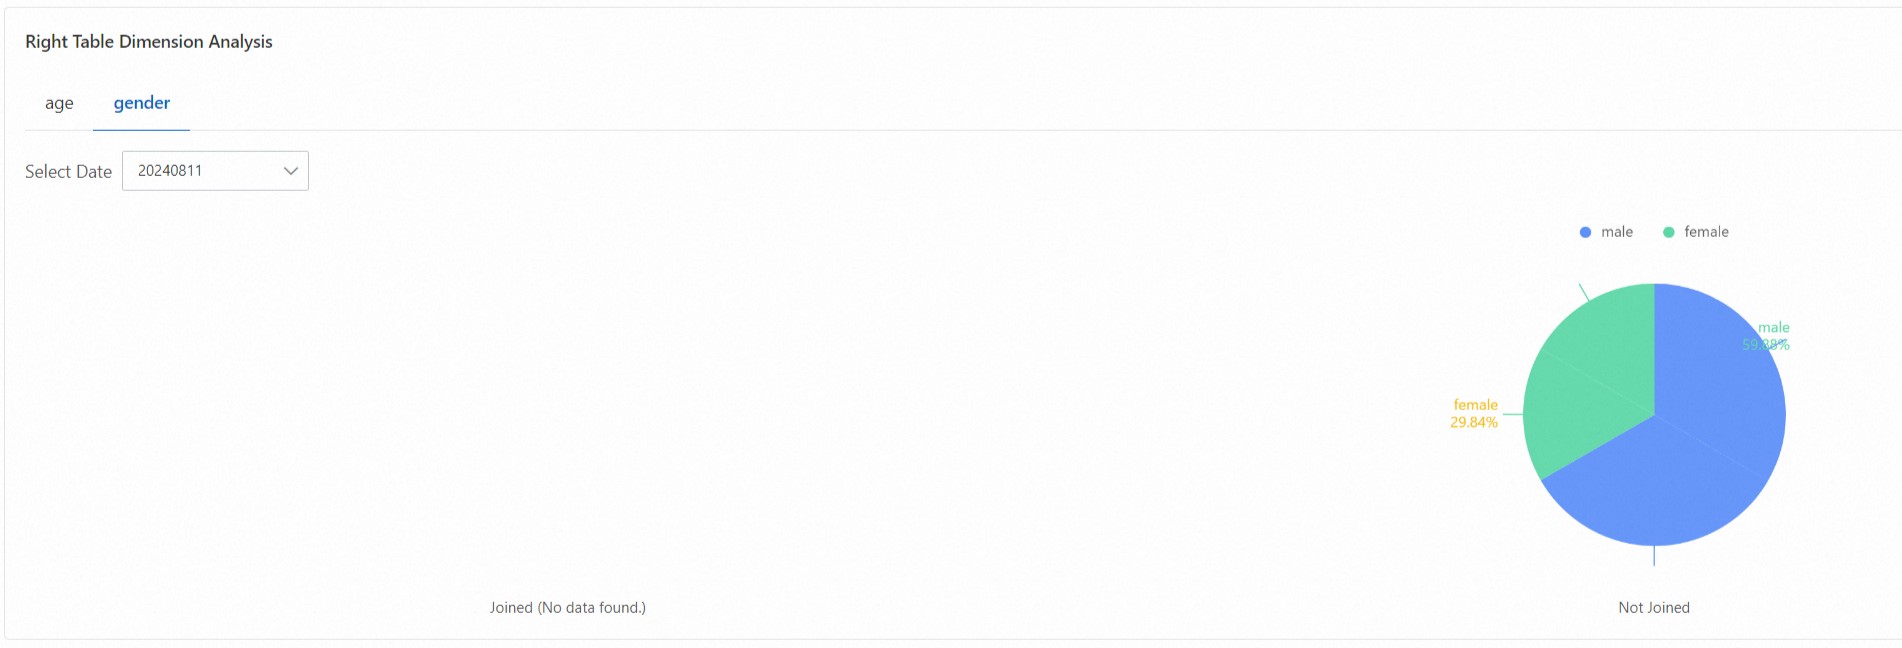
Analysis on statistical period of user preference
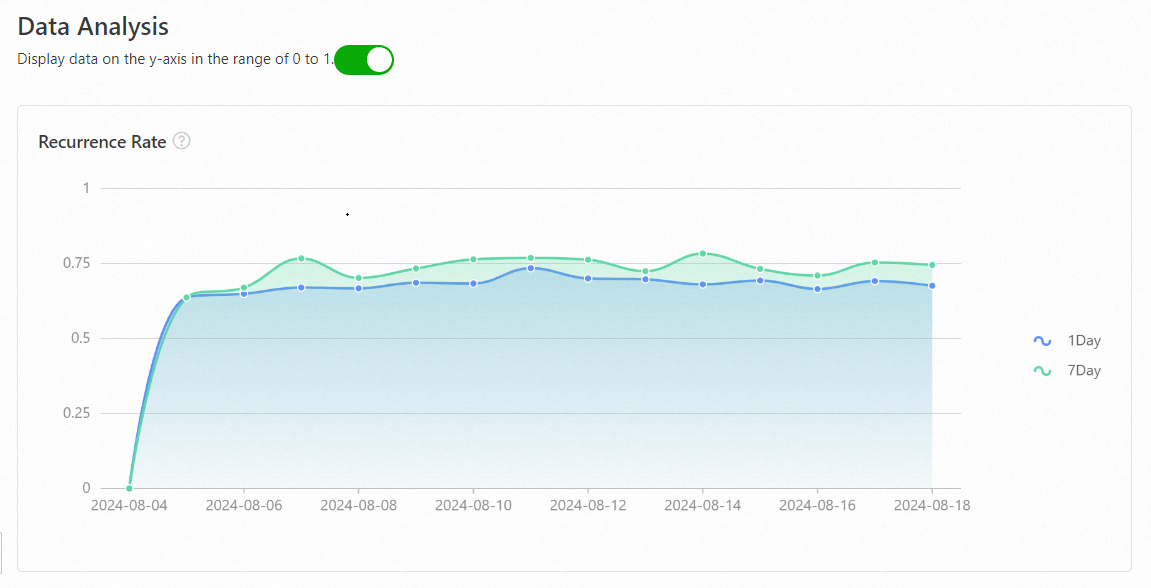
The analysis on statistical period of user preference report conducts statistical analysis on user behavior preferences and shows user retention.
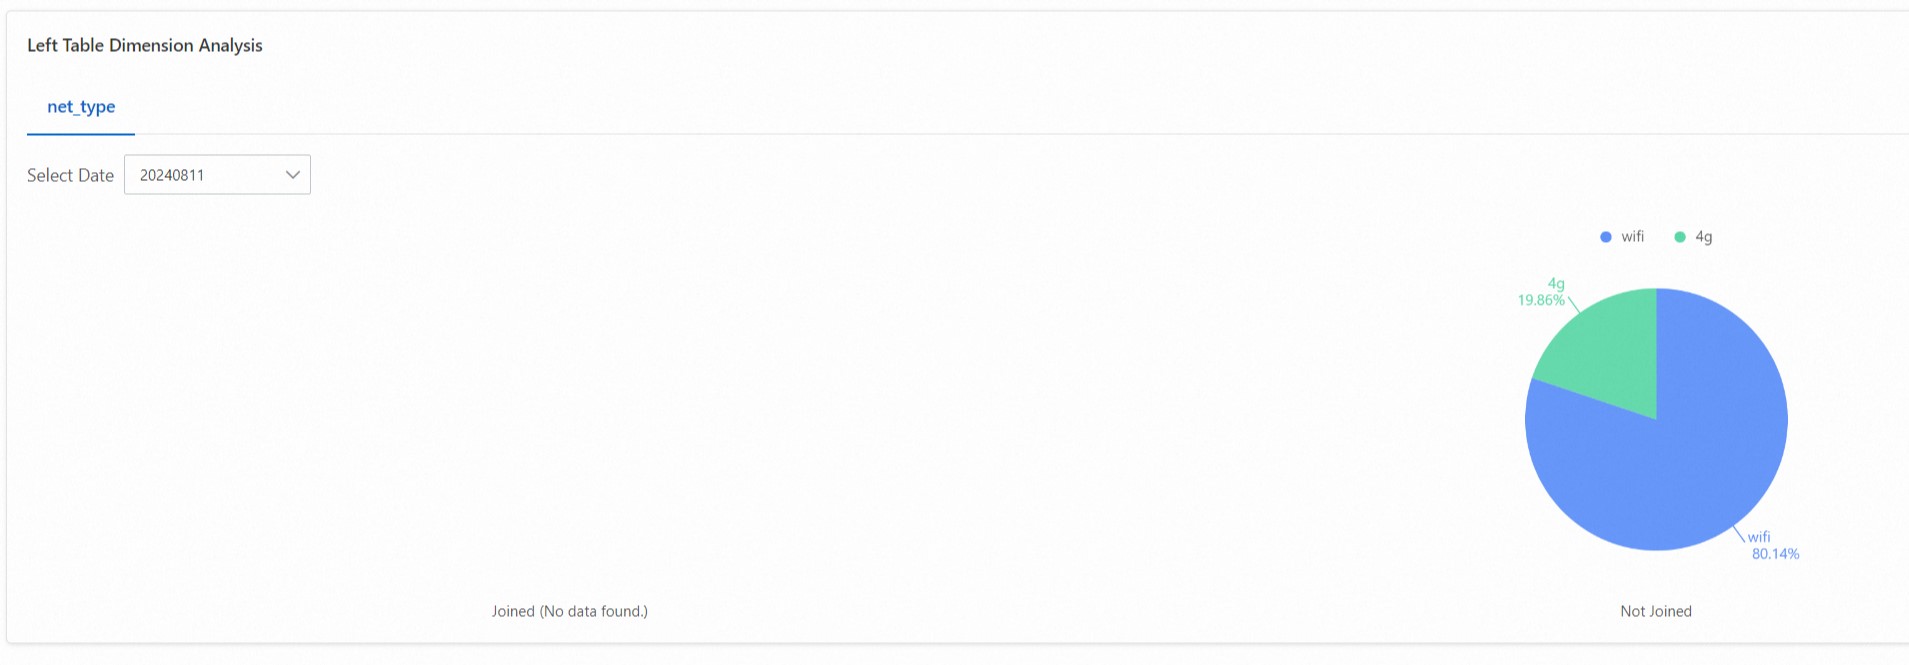
Two-table join analysis
The two-table join analysis report analyzes the correlation between data in two related data tables and shows the association rate of the right table in the left table.
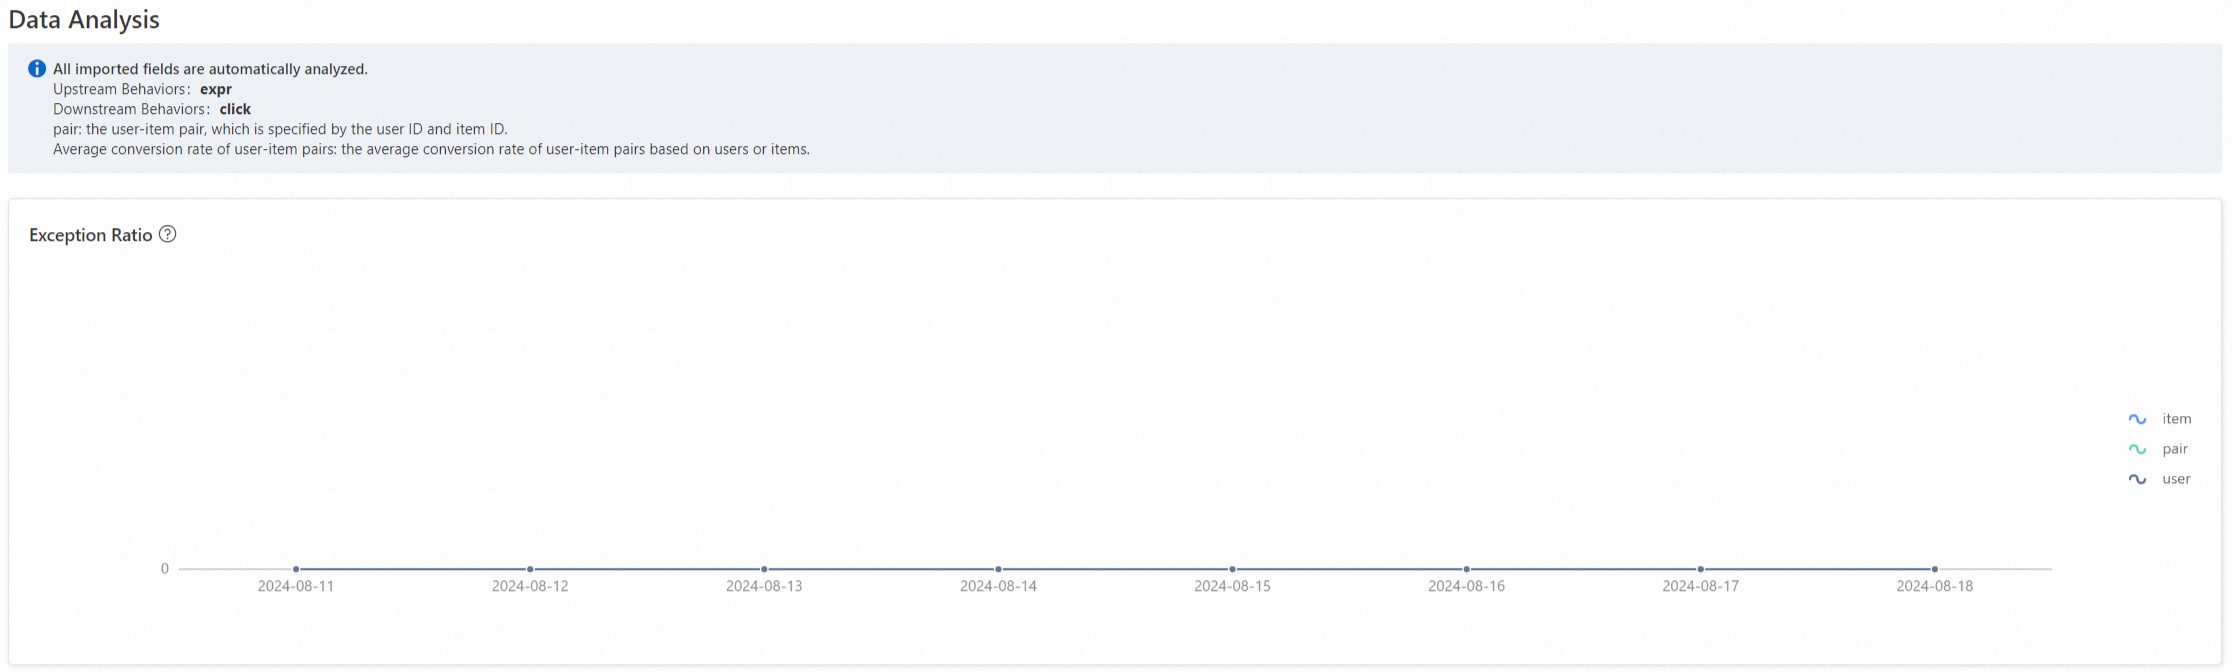
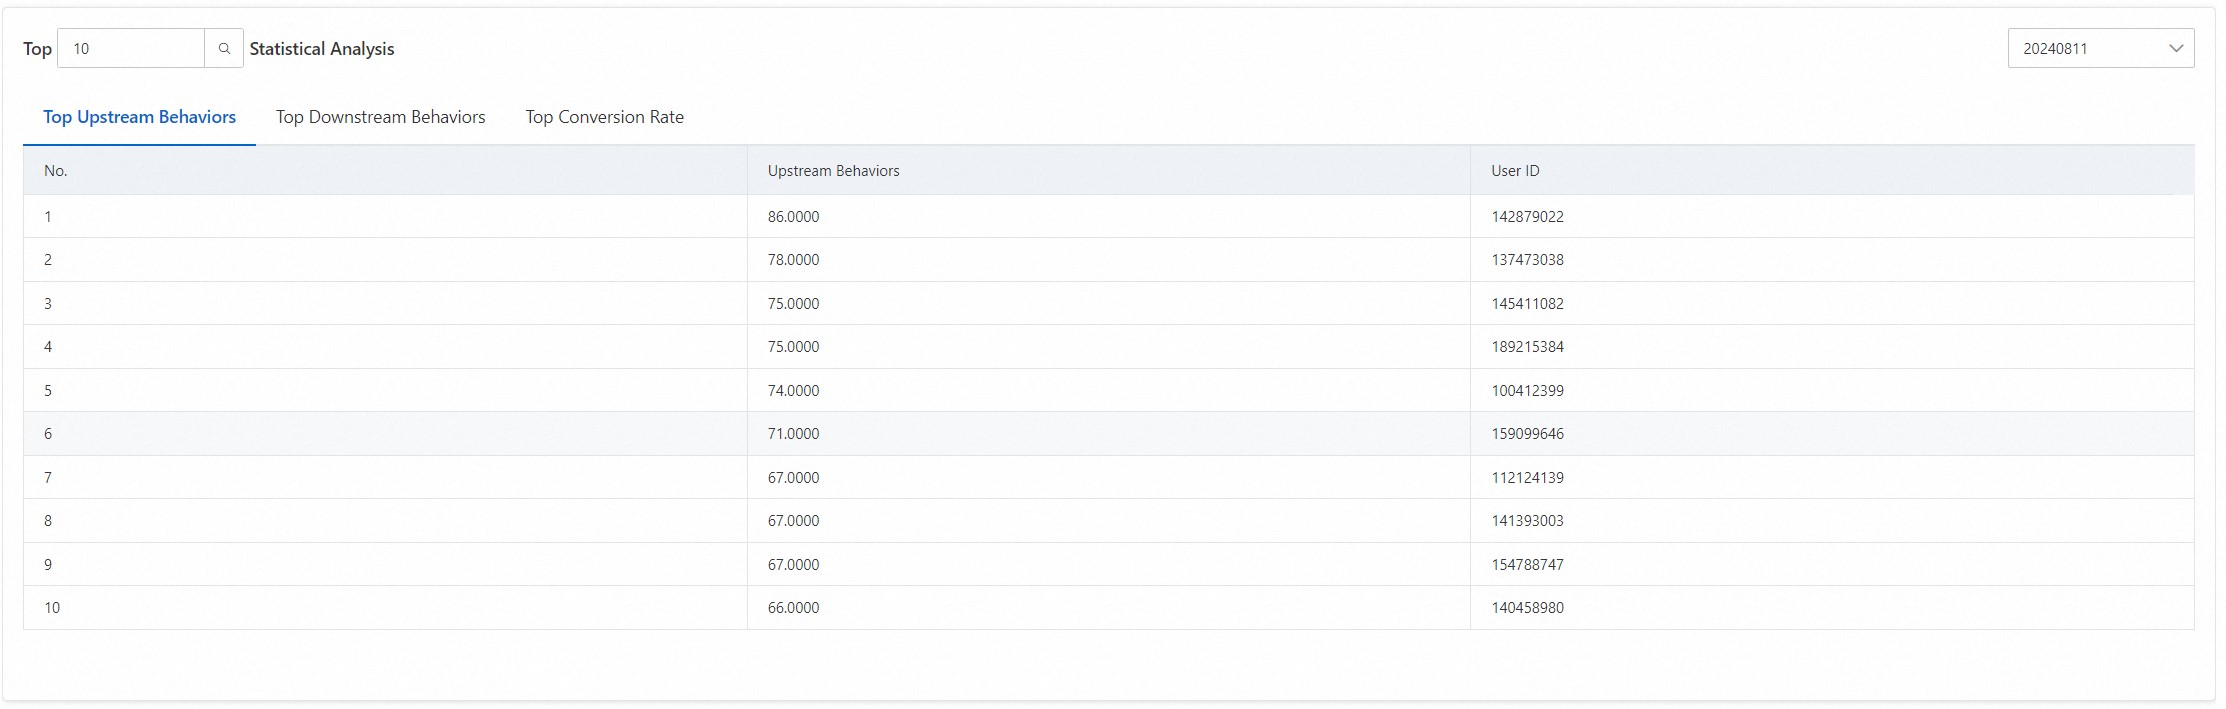
Exception analysis
The exception analysis report analyzes upstream and downstream behaviors and shows whether there are abnormalities where downstream behaviors exceed upstream behaviors.
A low abnormal ratio indicates that there are no cases where downstream behaviors exceed upstream behaviors.
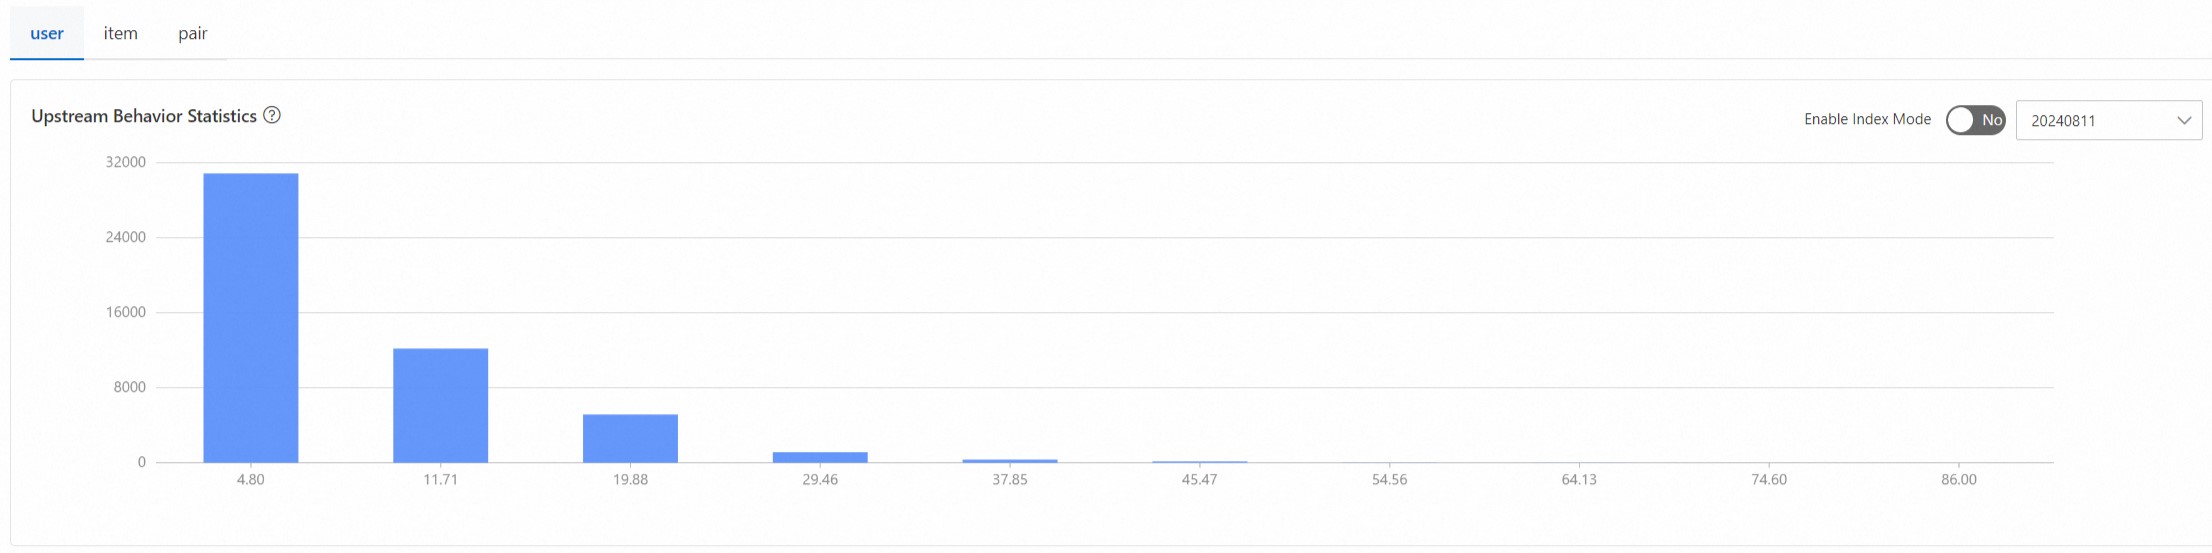
Upstream behavior count statistics show the count of exposures, divided into 10 buckets. The x-axis represents the mean of upstream behavior counts, and the y-axis represents the frequency. Downstream behavior count statistics follow the same principle.
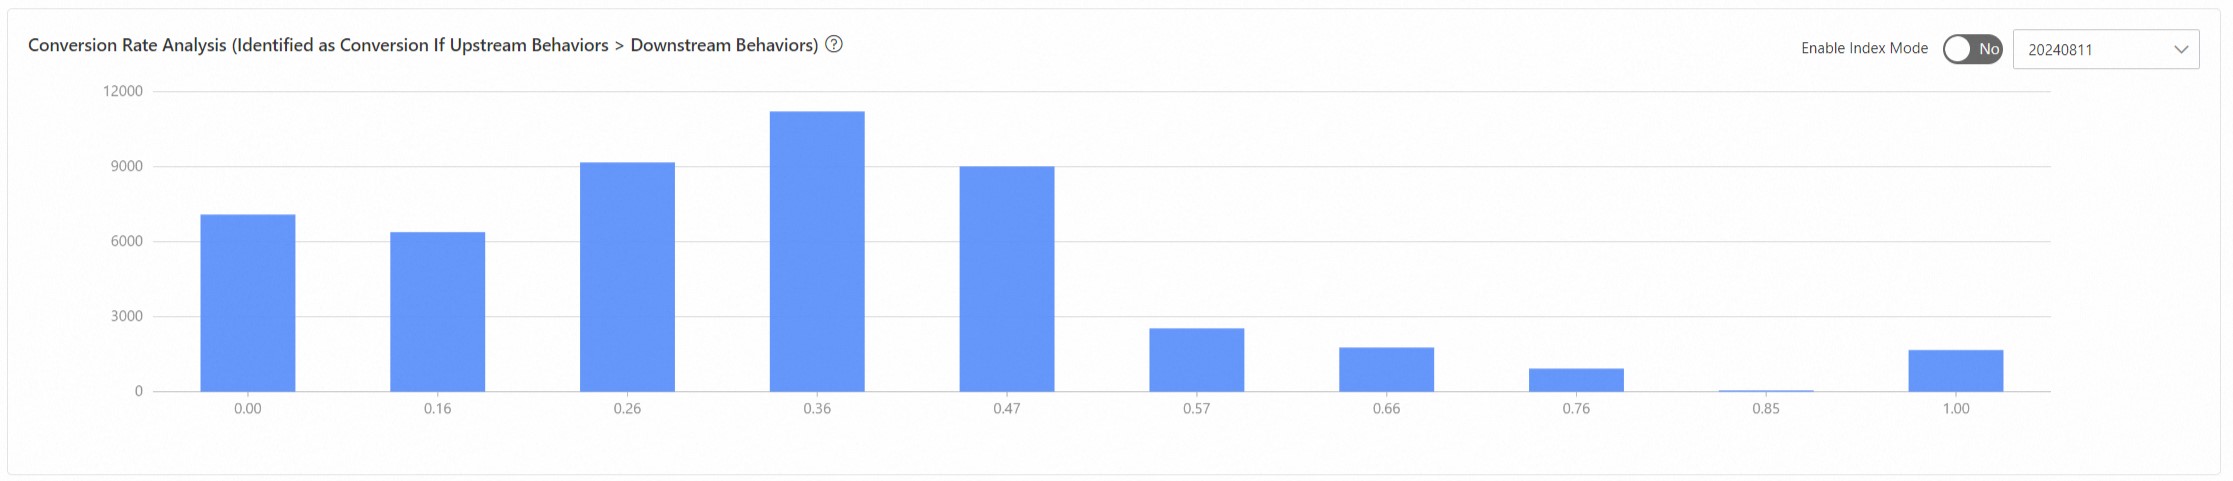
Conversion rate analysis divides the conversion rate into 10 intervals and shows the number in each interval.
Top statistics analysis displays the top values for upstream behaviors, downstream behaviors, and conversion rates, allowing you to identify the corresponding user IDs for more detailed analysis.
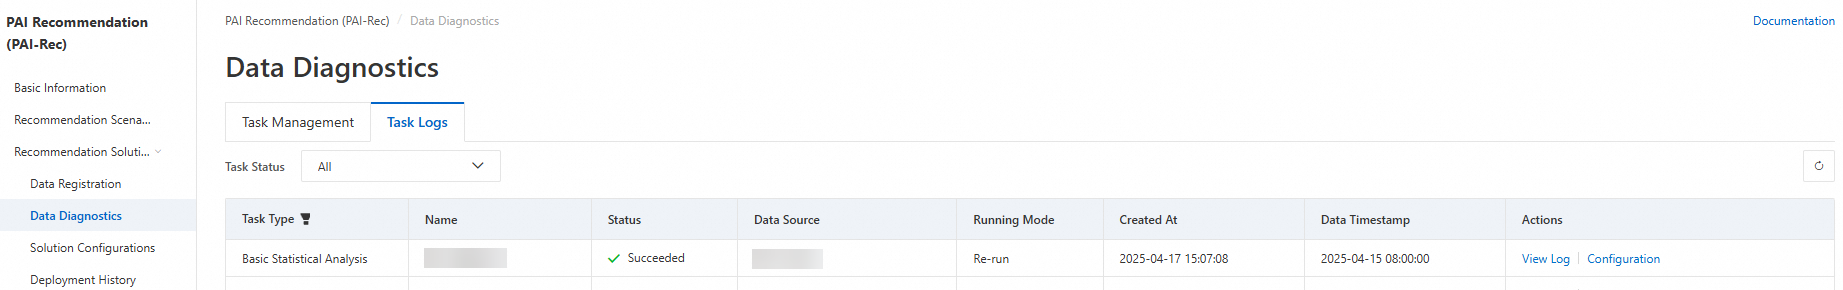
View task logs
After you create a diagnostics task, you can view the task progress on the Task Logs tab. To go to the tab, choose .
Click View Log in the Actions column of the desired task to view the log code.
Click Configuration in the Actions column of the desired task to view the configuration code used when you create the task.