GPU inference services like Stable Diffusion face two production challenges: a single pod can handle only so many concurrent requests before quality degrades, and GPU instances are expensive to keep running during idle periods. Knative solves both by enforcing a hard concurrency limit per pod—triggering scale-out the moment demand rises—and scaling pods to zero when traffic stops.
This guide walks you through deploying Stable Diffusion on an ACK Serverless cluster with Knative, running a load test to observe auto scaling in action, and using Knative monitoring dashboards to inspect service health.
Prerequisites
Before you begin, make sure you have:
-
You have an ACK cluster that contains GPU nodes and runs Kubernetes 1.24 or later. For more information, see Create an ACK managed cluster.
Recommended instance types are ecs.gn5-c4g1.xlarge, ecs.gn5i-c8g1.2xlarge, and ecs.gn5-c8g1.2xlarge.
-
Knative deployed in the cluster. See Deploy Knative
-
The Knative monitoring dashboard enabled. See
-
The
heyload testing tool installed:go install github.com/rakyll/hey@latest
You must comply with the user agreements, usage specifications, and applicable laws and regulations governing the third-party model Stable Diffusion. Alibaba Cloud does not guarantee the legitimacy, security, or accuracy of Stable Diffusion, and is not liable for any damages arising from its use.
How it works
The following diagram shows the production deployment architecture for Stable Diffusion with Knative on ACK.

Knative uses the Kubernetes Pod Autoscaler (KPA) to track concurrent requests and adjust the replica count to meet the configured target.
With containerConcurrency: 1 and targetUtilizationPercentage: 100, each pod accepts exactly one request at a time. When five concurrent requests arrive, KPA scales to five pods. The targetUtilizationPercentage value controls when scaling triggers: at 100%, a new pod starts only when the current pod reaches its full concurrency limit. This predictable 1:1 mapping makes Stable Diffusion—which is CPU- and GPU-intensive per request—straightforward to capacity-plan.
containerConcurrency is a hard limit enforced by Knative that controls the maximum number of concurrent requests a pod can process. A low hard limit improves throughput predictability but can increase tail latency and cold-start frequency under burst traffic.
Step 1: Deploy the Stable Diffusion service
Ensure that the Stable Diffusion service is deployed on a GPU node. Otherwise, the service will not work.
-
Log on to the ACK console. In the left navigation pane, click Clusters.
-
On the Clusters page, click the name of your cluster. In the left navigation pane, choose Applications > Knative.
-
Deploy the Stable Diffusion service using one of the following methods.
Application template (recommended)
Click the Popular Apps tab, then click Quick Deployment on the stable-diffusion card. After deployment, click Services to check the status in the service list. The following figure shows the Stable Diffusion service after successful deployment.

YAML
On the Services tab, select default from the Namespace drop-down list, then click Create from Template. Paste the following YAML into the editor and click Create.
apiVersion: serving.knative.dev/v1
kind: Service
metadata:
  name: knative-sd-demo
  annotations:
    serving.knative.dev.alibabacloud/affinity: "cookie"
    serving.knative.dev.alibabacloud/cookie-name: "sd"
    serving.knative.dev.alibabacloud/cookie-timeout: "1800"
spec:
  template:
    metadata:
      annotations:
        autoscaling.knative.dev/class: kpa.autoscaling.knative.dev
        autoscaling.knative.dev/maxScale: '10'
        autoscaling.knative.dev/targetUtilizationPercentage: "100"
        k8s.aliyun.com/eci-use-specs: ecs.gn5-c4g1.xlarge,ecs.gn5i-c8g1.2xlarge,ecs.gn5-c8g1.2xlarge
    spec:
      containerConcurrency: 1
      containers:
      - args:
        - --listen
        - --skip-torch-cuda-test
        - --api
        command:
        - python3
        - launch.py
        image: yunqi-registry.cn-shanghai.cr.aliyuncs.com/lab/stable-diffusion@sha256:62b3228f4b02d9e89e221abe6f1731498a894b042925ab8d4326a571b3e992bc
        imagePullPolicy: IfNotPresent
        ports:
        - containerPort: 7860
          name: http1
          protocol: TCP
        name: stable-diffusion
        readinessProbe:
          tcpSocket:
            port: 7860
          initialDelaySeconds: 5
          periodSeconds: 1
          failureThreshold: 3
The key annotations in this YAML are:
Annotation Value Effect autoscaling.knative.dev/classkpa.autoscaling.knative.devUses KPA (request-based) instead of HPA (CPU-based) autoscaling.knative.dev/maxScale10Caps the number of pods at 10 autoscaling.knative.dev/targetUtilizationPercentage100Triggers scale-out when a pod reaches 100% of its concurrency limit containerConcurrency1Each pod processes one request at a time (hard limit) k8s.aliyun.com/eci-use-specsGPU instance types Specifies GPU instance types for Elastic Container Instance (ECI) scheduling cookie-timeout1800Pins a session to the same pod for 30 minutes using cookie-based affinity After the service is created, the Services tab shows the
knative-sd-demoservice:
Step 2: Access the Stable Diffusion service
-
On the Services tab, record the gateway IP address and default domain name of the
knative-sd-demoservice. -
Add the following entry to your local hosts file, replacing the IP address and domain name with the actual values:
47.xx.xxx.xx knative-sd-demo.default.example.com # Replace the IP address and domain name with the actual values. -
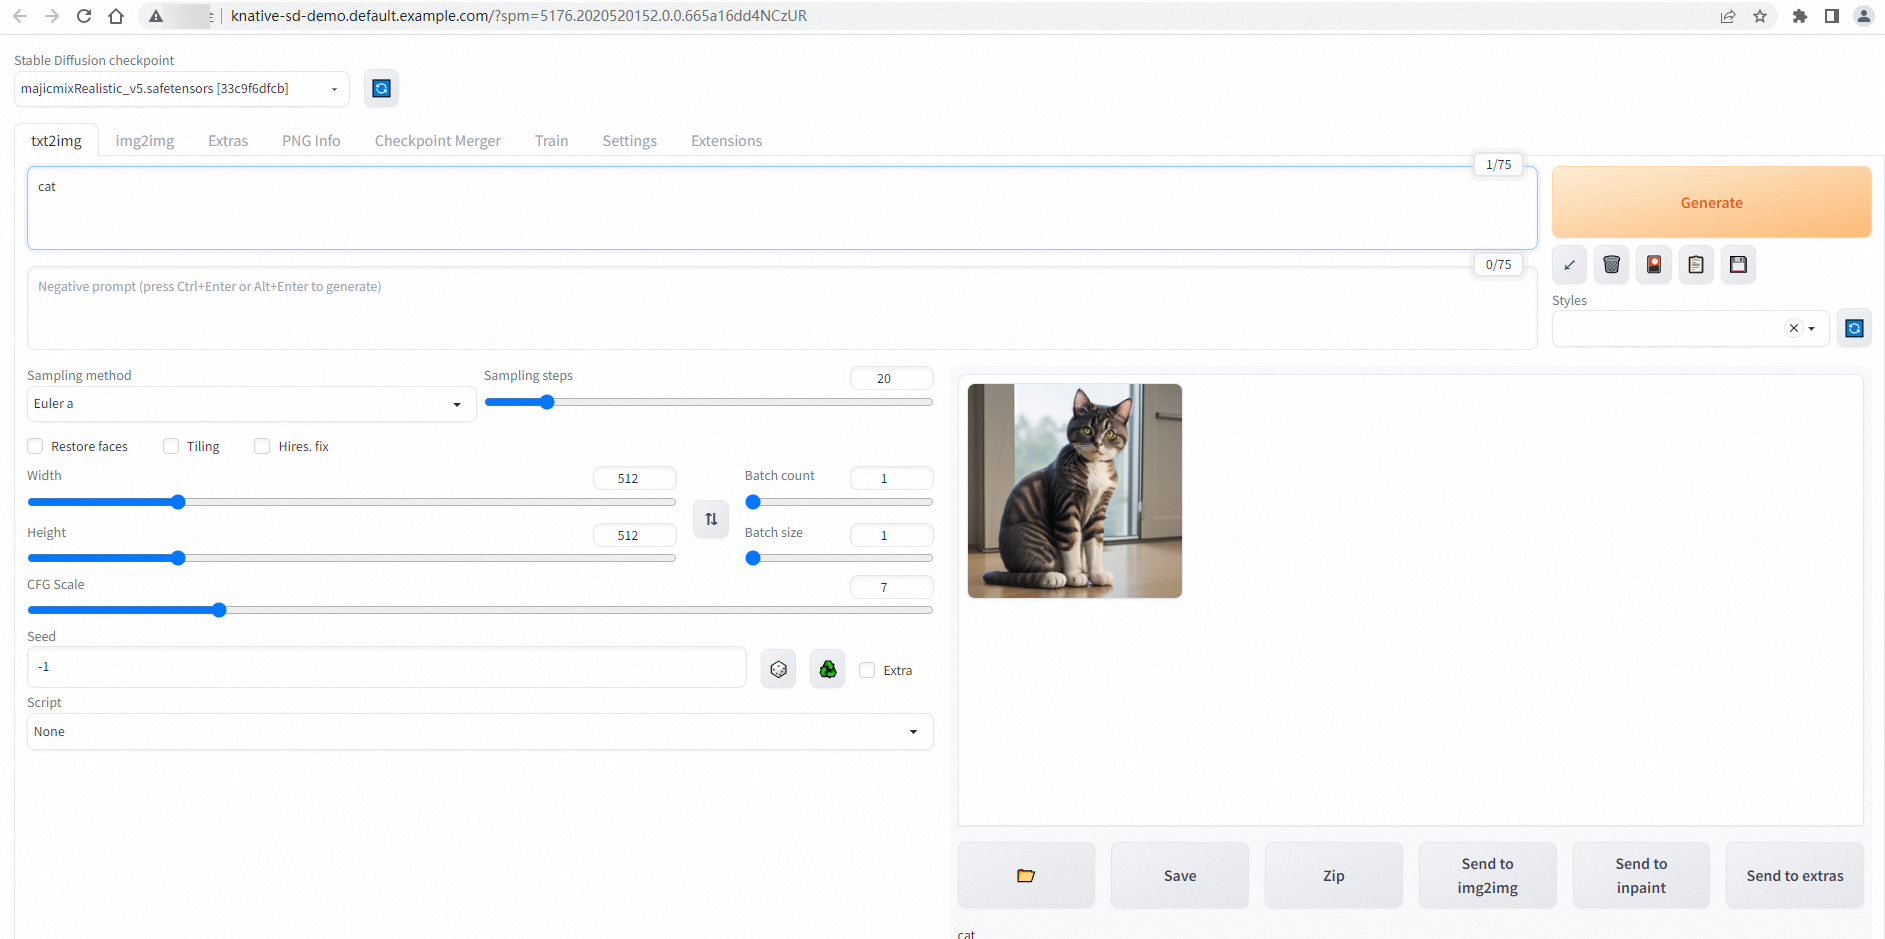
After saving the hosts file, go to the Services tab and click the default domain name to open the Stable Diffusion web UI. A successful connection shows the following page:
Step 3: Test auto scaling
Use hey to send 50 requests with 5 concurrent connections to confirm that Knative scales pods to match demand.
GPU pods take time to start. Expect pod readiness to take a few minutes during cold starts. The 180-second timeout in the test command accounts for this delay.
-
Run the following load test:
hey -n 50 -c 5 -t 180 -m POST -H "Content-Type: application/json" -d '{"prompt": "pretty dog"}' http://knative-sd-demo.default.example.com/sdapi/v1/txt2imgThis command sends 50 requests in batches of 5 concurrent requests, with a per-request timeout of 180 seconds. Expected output:
Summary:
  Total:	252.1749 secs
  Slowest:	62.4155 secs
  Fastest:	9.9399 secs
  Average:	23.9748 secs
  Requests/sec:	0.1983


Response time histogram:
  9.940 [1]	|■■
  15.187 [17]	|■■■■■■■■■■■■■■■■■■■■■■■■■■■■■■■■■■■■■■■■
  20.435 [9]	|■■■■■■■■■■■■■■■■■■■■■
  25.683 [11]	|■■■■■■■■■■■■■■■■■■■■■■■■■■
  30.930 [1]	|■■
  36.178 [1]	|■■
  41.425 [3]	|■■■■■■■
  46.673 [1]	|■■
  51.920 [2]	|■■■■■
  57.168 [1]	|■■
  62.415 [3]	|■■■■■■■


Latency distribution:
  10% in 10.4695 secs
  25% in 14.8245 secs
  50% in 20.0772 secs
  75% in 30.5207 secs
  90% in 50.7006 secs
  95% in 61.5010 secs
  0% in 0.0000 secs

Details (average, fastest, slowest):
  DNS+dialup:	0.0424 secs, 9.9399 secs, 62.4155 secs
  DNS-lookup:	0.0385 secs, 0.0000 secs, 0.3855 secs
  req write:	0.0000 secs, 0.0000 secs, 0.0004 secs
  resp wait:	23.8850 secs, 9.9089 secs, 62.3562 secs
  resp read:	0.0471 secs, 0.0166 secs, 0.1834 secs

Status code distribution:
  [200]	50 responses
All 50 requests completed with HTTP 200. The latency range (10–62 seconds) reflects GPU inference time for each image.
-
While the test runs, watch the pod count in a separate terminal:
watch -n 1 'kubectl get po'Five pods are created because
containerConcurrency: 1means each pod can concurrently process at most one request at a time.
Step 4: View monitoring data
Knative's built-in observability features provide request metrics and pod scaling trends out of the box. To access the dashboards, go to Applications > Knative, then click Monitoring Dashboards. For setup instructions, see .
-
The Overview (average over the selected time range) section shows request volume, success rate, client errors (4xx), server errors (5xx), and the pod scaling trend.

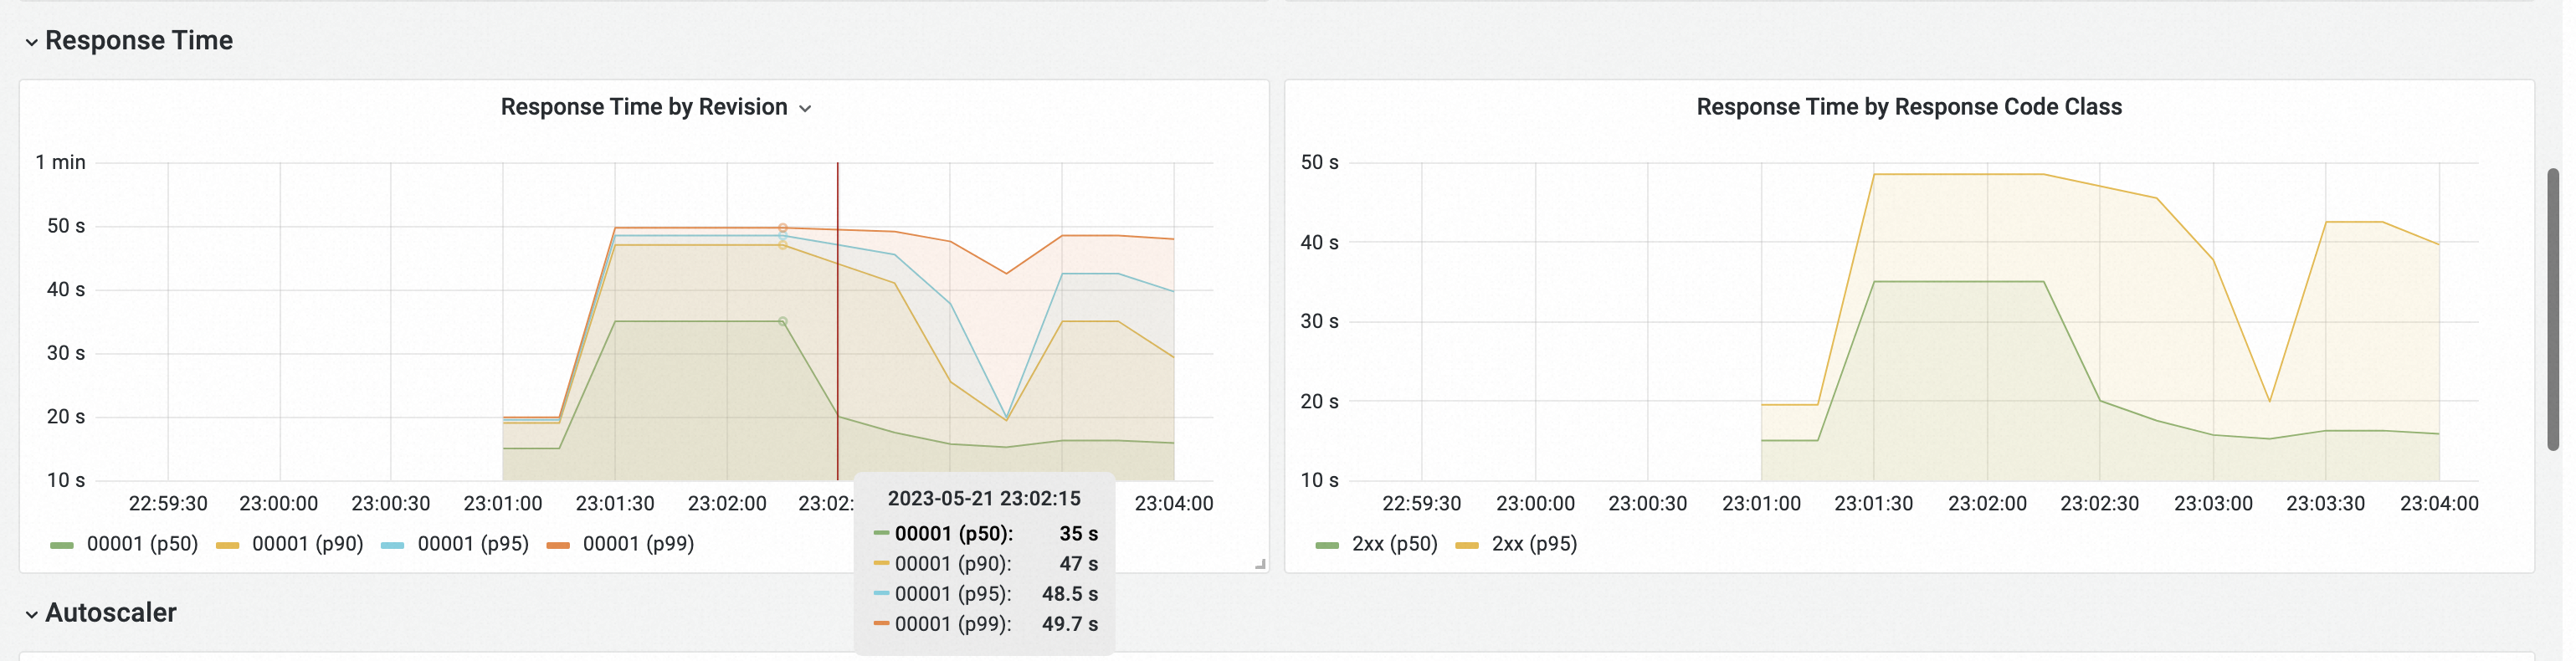
-
The Response Time section shows P50, P90, P95, and P99 response latency.