Event monitoring
Event monitoring is a Kubernetes monitoring method that complements resource monitoring by offering improved real-time performance, accuracy, and broader scenario coverage. You can use kube-eventer to send cluster events to external systems such as DingTalk, Log Service (SLS), and EventBridge. It also provides filtering capabilities at different levels to enable real-time event collection, targeted alerting, and asynchronous archiving.
Background
ACK Serverless provides an out-of-the-box event monitoring solution for containerized environments. The kube-eventer component, maintained by the ACK team, provides this capability.

kube-eventer is an open source tool maintained by the ACK team for exporting Kubernetes events. It can send cluster events to systems such as DingTalk, SLS, and EventBridge, and provides multi-level filtering for real-time collection, targeted alerting, and asynchronous archiving. For more information, see kube-eventer.
This topic describes event monitoring through the following three use cases:
Prerequisites
The kube-eventer add-on is installed.
On your cluster management page, in the left-side navigation pane, choose . On the Logs and Monitoring tab, install the kube-eventer add-on. The add-on is free but consumes pod resources.
Use case 1: Store Kubernetes events with SLS
Alibaba Cloud Log Service (SLS) allows you to persistently store Kubernetes events for enhanced archiving and auditing. For more information, see Create and use the K8s Event Center.
-
Create a project and a Logstore.
-
Log on to the Simple Log Service console.
-
In the Projects section, click Create Project. Fill in the basic project information and click Create.
This example creates a project named k8s-log4j in the same region as the Kubernetes cluster, China (Hangzhou).
NoteTo reduce costs and improve efficiency, we recommend that you create your SLS project in the same region as your Kubernetes cluster. This allows log data to be transmitted over the internal network. This avoids data transfer fees for public network traffic and reduces latency for real-time log collection and querying.
-
After creation, the k8s-log4j project appears in the project list. Click the project name to open the project details page.
-
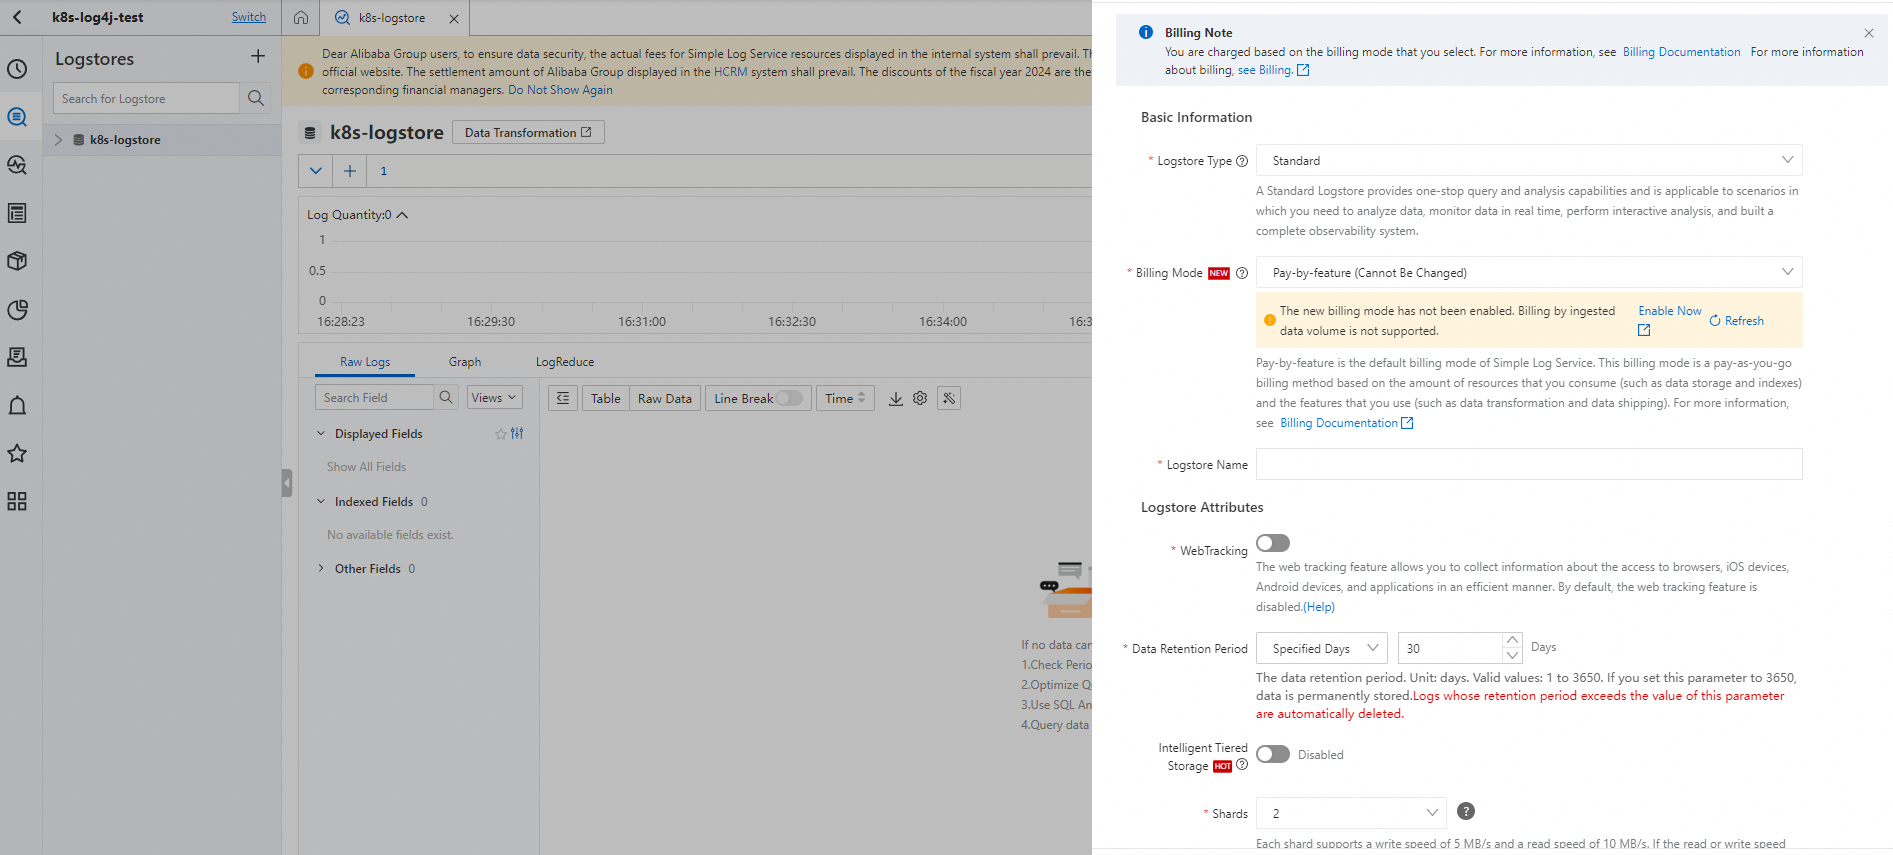
By default, you are on the Logstore page. In the left-side pane, click the plus sign (+) to open the Create Logstore dialog box.
-
Enter the Logstore configuration information and click OK.
This example creates a Logstore named k8s-logstore.
-
After the Logstore is created, a prompt appears to guide you through data import. Click Data Import Wizard to open the Import Data dialog box.
-
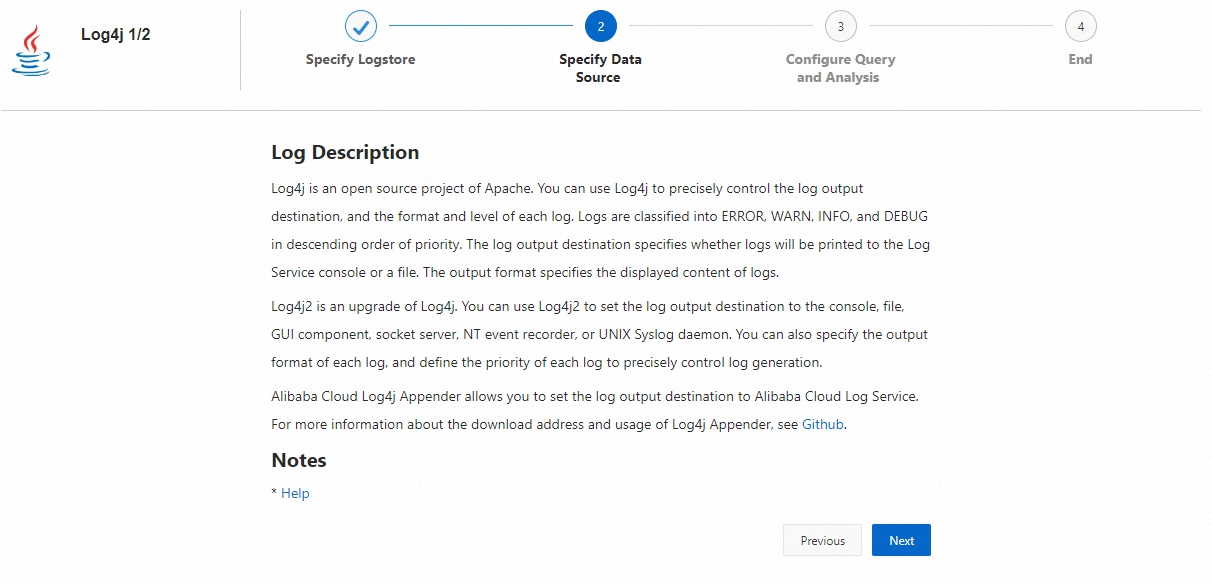
Select Log4j 1/2 and follow the on-screen instructions to configure it.
This example uses the default settings. You can customize the configuration for your specific log data use case.
-
-
Configure log4j in the Kubernetes cluster.
On the Clusters page, click the name of your cluster. In the left navigation pane, click .
-
On the Helm page, find the kube-eventer component. In the Actions column, click Update. Modify the following parameters and click OK.
-
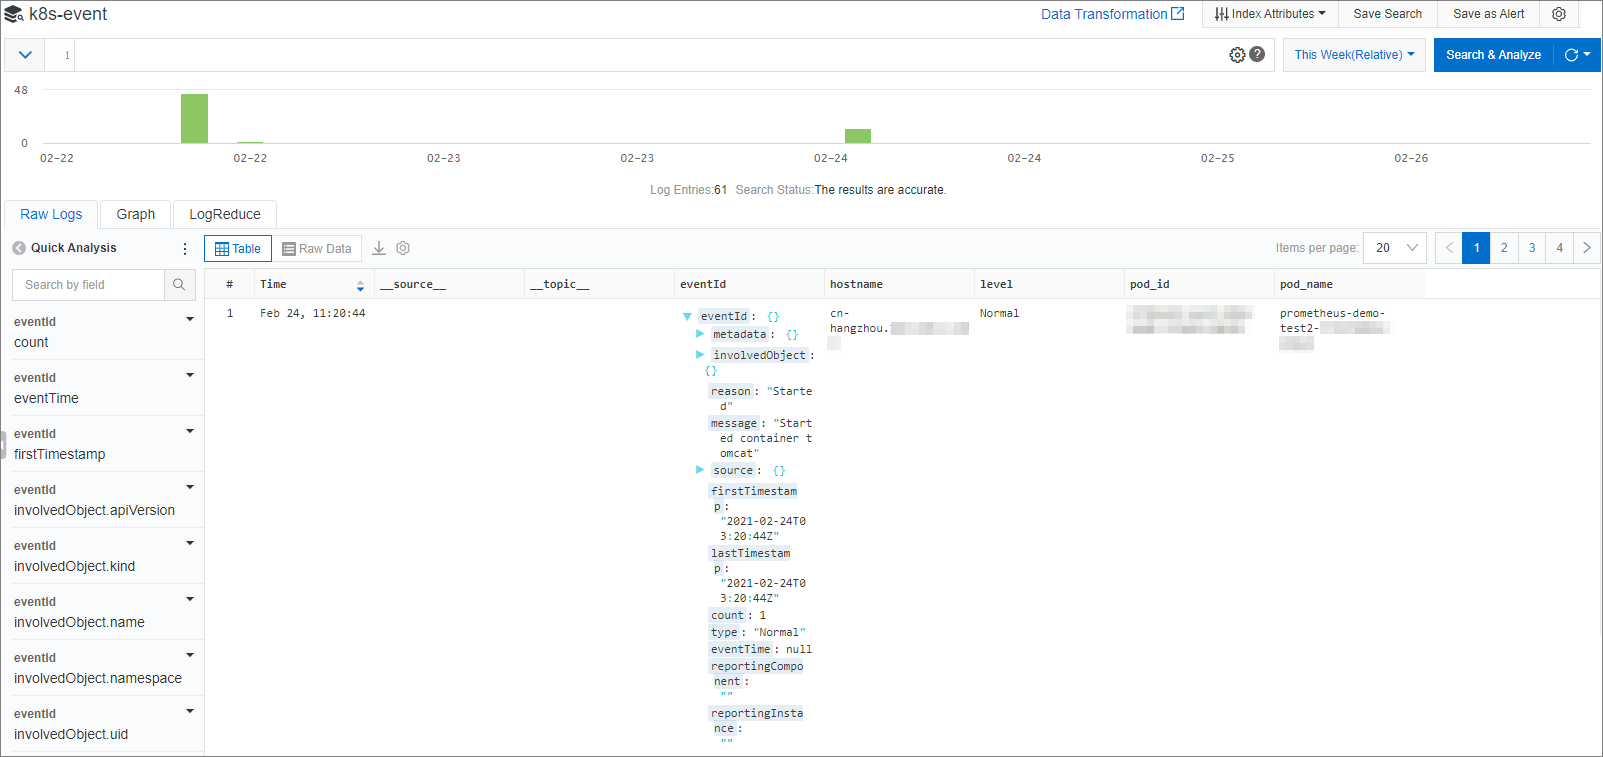
After you perform an operation on the cluster that generates an event, such as deleting a pod or creating an application, log on to the SLS console to view the collected data. For more information, see Consume log data by using an API.
-
Configure indexing and archiving. For more information, see Create an index.
-
In the SLS console, go to the Projects section and click the name of your project.
-
Click the
 icon next to the Logstore name and choose Search & Analysis.
 -
In the upper-right corner, click Enable Index.
-
In the Search & Analysis dialog box, configure the index and click OK.
The log query and analysis page appears.
 Note
Note-
The index configuration takes effect within one minute.
-
After you enable or modify an index, the new configuration applies only to data written after the change.
-
-
(Optional) For offline archiving and computing, you can ship data from the Logstore to MaxCompute or OSS. For more information, see Create a MaxCompute shipping task (new) and Create an OSS shipping task (new).
-
Use case 2: Store Kubernetes events with EventBridge
EventBridge is a serverless event bus service provided by Alibaba Cloud. It allows Alibaba Cloud services, custom applications, and SaaS applications to connect through a standard, centralized hub. You can send ACK events to EventBridge to build loosely coupled, distributed, event-driven architectures. For more information about EventBridge, see What is EventBridge?.
-
Activate EventBridge. For more information, see Activate EventBridge and grant permissions.
On the Clusters page, click the name of your cluster. In the left navigation pane, click .
-
On the Helm page, find the kube-eventer component. In the Actions column, click Update. Set
eventer.sinks.eventbridge.enabletotrueto enable the EventBridge sink, and then click OK.eventer: accessKeyId: "" accessKeySecret: "" enabled: true env: - TZ: Asia/Shanghai image: pullPolicy: Always repository: registry-cn-hangzhou-vpc.ack.aliyuncs.com/acs/kube-eventer tag: v1.2.11-0620284-aliyun othersinks: null resources: limits: cpu: "1.0" memory: 1024Mi requests: cpu: 100m memory: 200Mi sinks: dingtalk: enabled: false label: "" level: Warning monitorkinds: Node,Pod monitornamespaces: "" token: "" eventbridge: enabled: false -
After the data sink is enabled, view the container events in the EventBridge console.
-
Log on to the EventBridge console.
-
In the left-side navigation pane, click Event Buses.
-
On the Event Buses page, click the name of the target event bus.
-
In the left-side navigation pane, click Event Trace.
-
Select an event query method, set the query conditions, and click Search.
-
In the event list, find the event you want to view and click Event Details in the Actions column.
For more information, see Query events.
-
Use case 3: Kubernetes monitoring with a DingTalk chatbot
Monitoring Kubernetes events and sending alerts with a DingTalk chatbot is a typical implementation of ChatOps. Follow these steps:
-
Configure a DingTalk chatbot.
-
In a DingTalk group, click the
icon in the upper-right corner to go to the Group Settings page. -
Click Chatbot, then click Add Robot, and select the type of robot to add. For this example, select a Custom robot.
-
On the Robot details page, click Add to open the Add Robot page.
Configure the chatbot based on the information below, read and agree to the terms of service, and then click Finish.
Parameter
Description
Edit profile picture
(Optional) Set a profile picture for the chatbot.
Chatbot name
The name of the chatbot to add.
Add to Group
The group where the chatbot will be added.
Security settings
Three types of security settings are supported: Custom Keywords, Signature, and IP Address (or CIDR block).
For cluster event monitoring, only the Custom Keywords security setting is currently supported.
Select Custom Keywords and enter
Warningto receive all monitoring alerts. If the chatbot sends messages too frequently, you can add more keywords to filter the alerts. You can set up to 10 keywords. To be delivered, messages sent from ACK Serverless must contain one of these keywords. -
Click Copy to copy the webhook URL.
NoteOn the ChatBot page, select the target chatbot and click the
icon to perform the following operations:-
Modify the chatbot's profile picture and name.
-
Enabled or Close message notifications.
-
Reset the webhook URL.
-
Delete the chatbot.
-
-
-
Update the configuration of the kube-eventer component.
-
On the Clusters page, click the name of the target cluster. In the left-side navigation pane, choose .
-
On the Helm page, find the kube-eventer component. In the Actions column, click Update. Modify the following parameters and click OK.
-
Under
npd, setenabledtofalse. -
Set
eventer.sinks.dingtalk.enabledtotrue. -
In the Token field, enter the access token from the webhook URL that you created in Step 1.
-
-
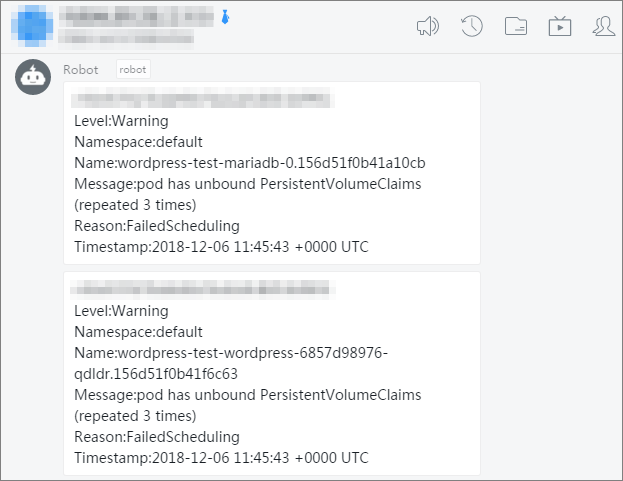
Expected result:
Thirty seconds after a successful deployment, the kube-eventer component takes effect. When an event's severity level exceeds the configured threshold, an alert like the following is sent to the DingTalk group.