When you run multiple Kubernetes clusters for resource isolation, high availability (HA), or disaster recovery (DR), monitoring becomes fragmented across clusters. ACK One global monitoring aggregates metrics from all associated clusters into a single dashboard, powered by Managed Service for Prometheus, so you can view and compare cluster metrics without switching between consoles.
This topic describes how to enable global monitoring for a Fleet instance and add clusters to the dashboard.
Prerequisites
Before you begin, make sure you have:
Fleet management enabled. For more information, see Enable Fleet management.
A service provider cluster and a service consumer cluster associated with the Fleet instance. For more information, see Associate clusters with a Fleet instance.
Key concepts
Associated cluster: All associated clusters within your Alibaba Cloud account. You can add associated clusters to global monitoring or remove associated clusters from global monitoring. To add a cluster, the Managed Service for Prometheus agent must be installed in that cluster.
Enable global monitoring and add clusters
Step 1: Enable global monitoring
Log on to the ACK One console. In the left-side navigation pane, choose Fleet > Global Monitoring.
On the Global Monitoring page, click Enable Global Monitoring. In the dialog box that appears, click OK.
You need to enable global monitoring only once for the first time you use the feature.
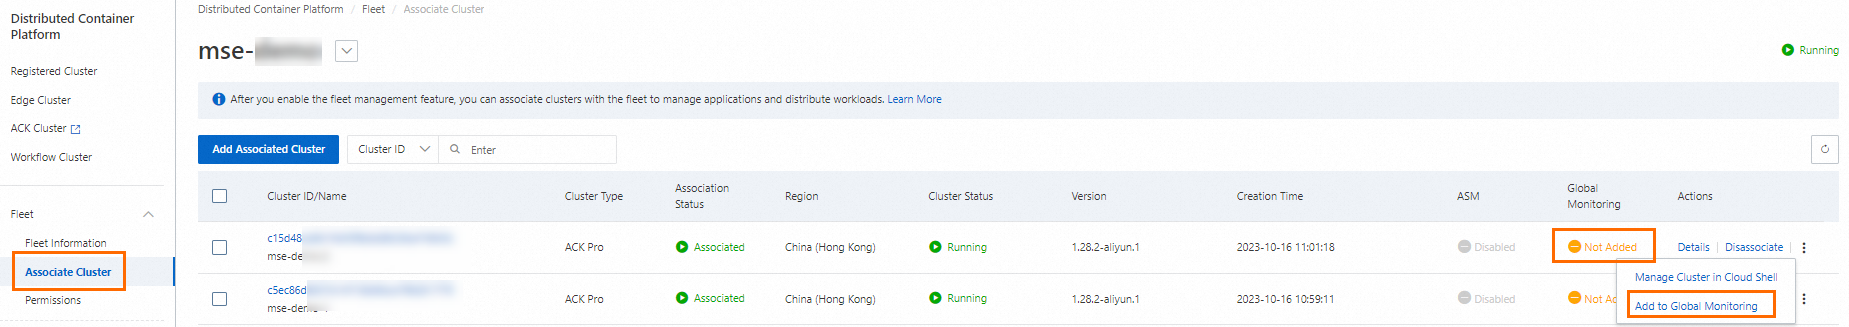
Step 2: Add clusters to global monitoring
In the left-side navigation pane, click Fleet > Associated Clusters. If no cluster has been added to global monitoring, click Add to Global Monitoring in the Actions column.
After a cluster is added, the Global Monitoring column for that cluster displays Added.