LLM online services that handle unpredictable traffic spikes benefit from a multi-cluster architecture. This tutorial shows how to deploy a vLLM inference service using an ACK One fleet and scale it across clusters with FederatedHPA (Federated Horizontal Pod Autoscaler).
How it works
In large-scale inference scenarios, LLM online services face sharp and unpredictable traffic spikes. A multi-cluster architecture is a common solution for handling peak traffic:
-
Users with on-premises data centers typically use a hybrid cloud architecture. During traffic peaks, they scale out workloads to cloud clusters.
-
Cloud users often deploy multiple clusters across different regions to avoid resource shortages in a single region.
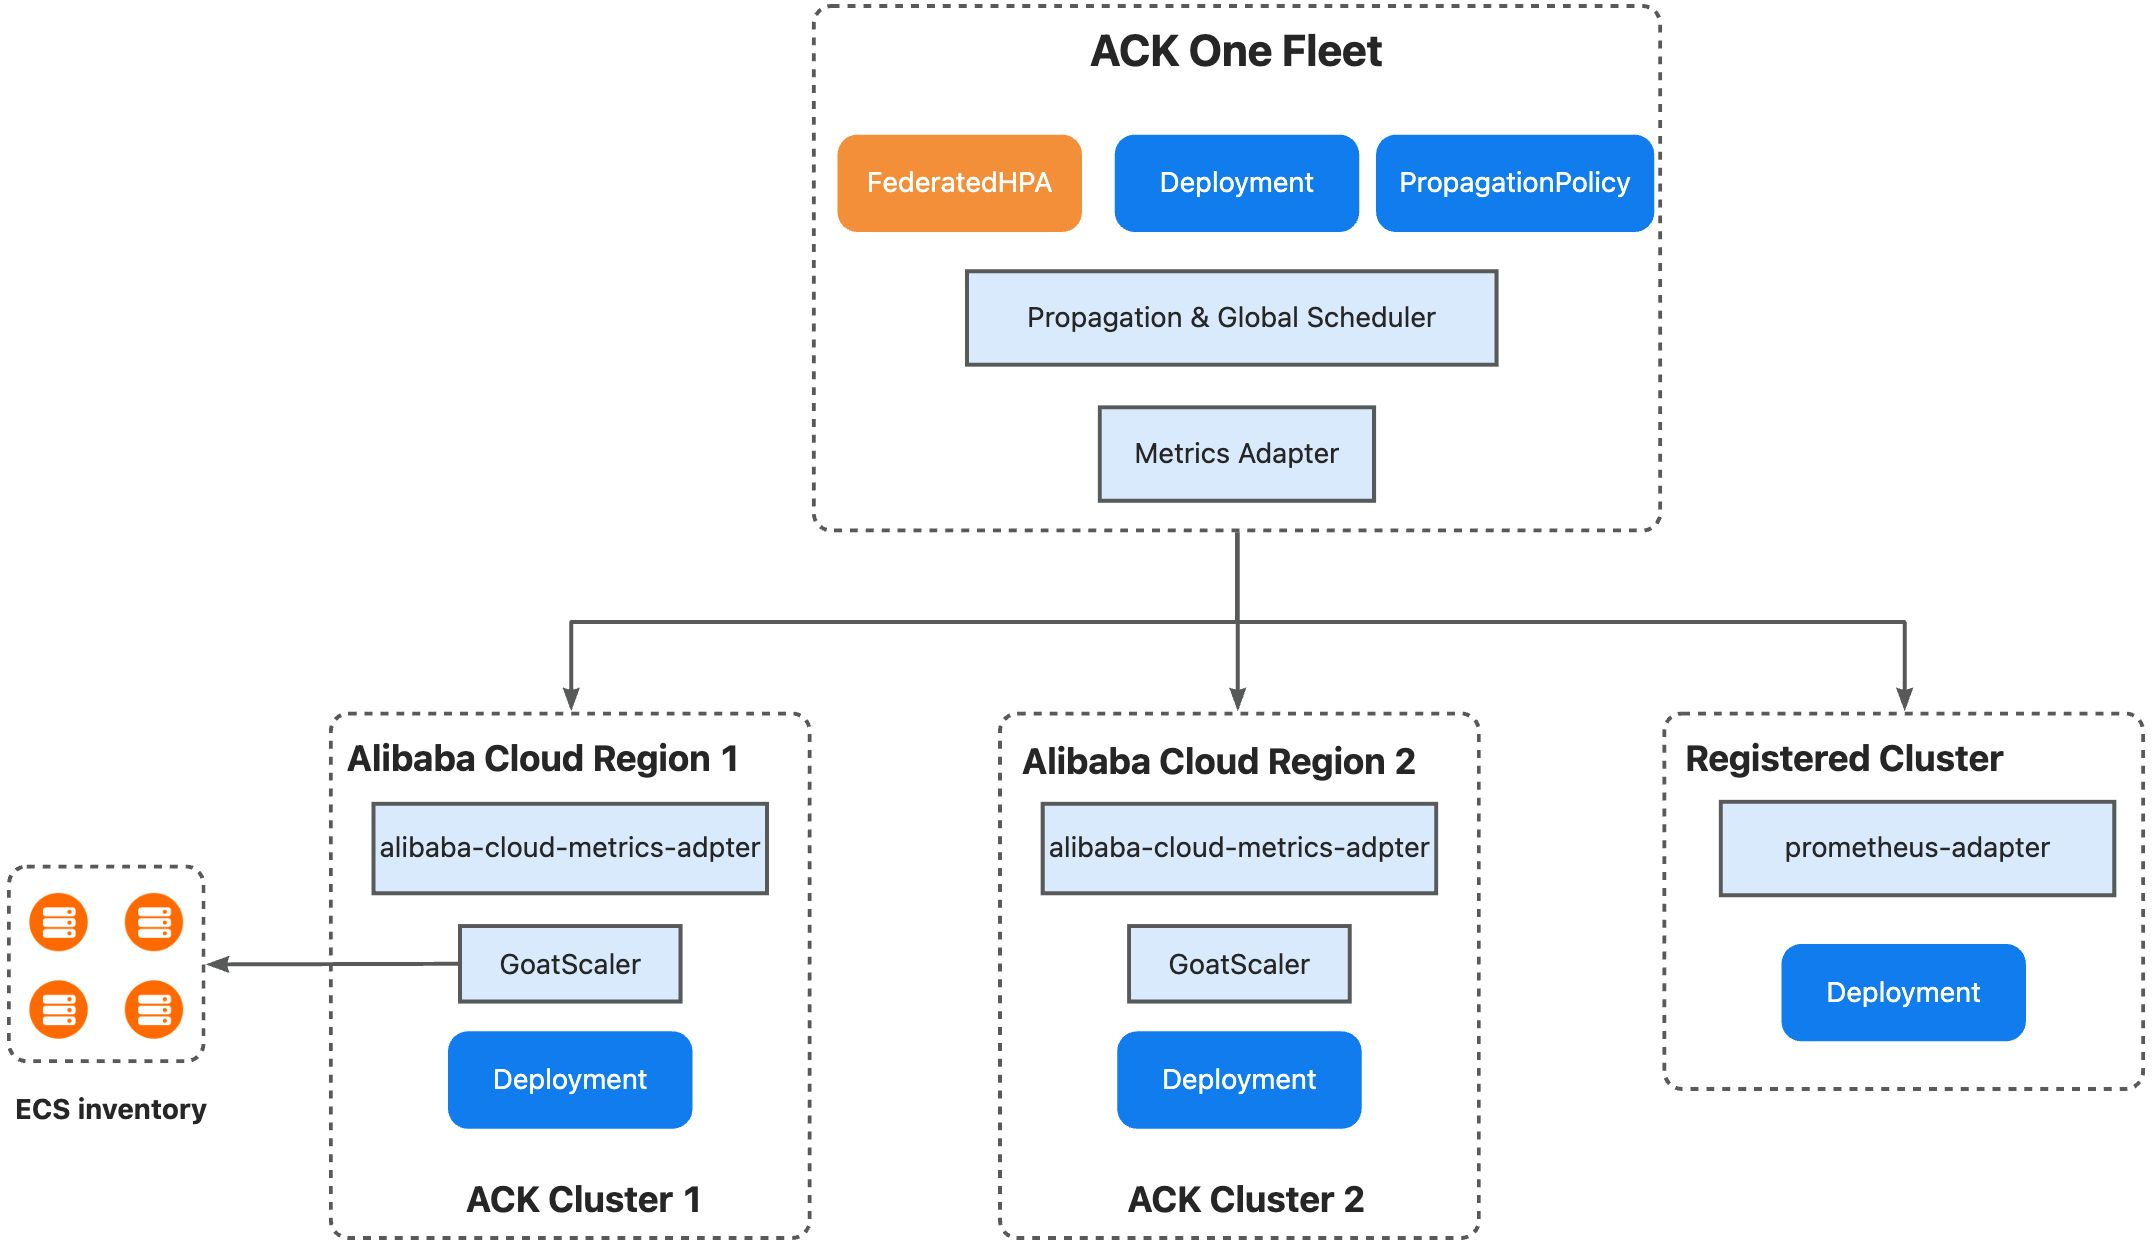
The ACK One fleet manages resources across multiple clusters and supports cross-cluster scheduling and Auto Scaling. It supports both deployment models through three mechanisms:
-
Multi-cluster priority-based scheduling: Set scheduling priorities for clusters. Replicas go to high-priority clusters first. When resources run low, the fleet scales out to low-priority clusters and scales in by removing replicas from low-priority clusters first.
-
Inventory-aware intelligent scheduling: The fleet cluster works with GoatScaler in child clusters and uses ECS inventory to schedule replicas intelligently.
-
Unified centralized Auto Scaling: Create a FederatedHPA to scale workloads across clusters from a central point. The fleet cluster's Metrics Adapter collects and aggregates metrics from child clusters (which also support Prometheus Adapter), then scales workloads based on the aggregated metrics.
This tutorial demonstrates the following scenario:
-
cluster1 is the high-priority cluster; cluster2 is the low-priority cluster.
-
When traffic increases, FederatedHPA triggers a scale-out event.
-
New replicas are scheduled to cluster2 based on available capacity.
-
After traffic subsides, FederatedHPA scales the deployment back to the minimum replica count.
Prerequisites
Before you begin, make sure you have:
-
Two ACK clusters, each with a GPU node pool and at least one initialized GPU instance
-
Both clusters added to an ACK One fleet, with the ack-alibaba-cloud-metrics-adapter component installed (for registered clusters, install the open-source Prometheus Adapter instead)
-
The kubectl amc plugin installed
The multi-cluster Horizontal Pod Autoscaler (HPA) feature is in invitational preview. Contact us to apply for whitelist access before you use it.
Step 1: Configure metric collection in child clusters
Configure the ack-alibaba-cloud-metrics-adapter component in both ACK clusters to expose vLLM custom metrics.
-
Log on to the Container Service Management Console. In the left navigation pane, click Clusters.
-
On the Clusters page, click the name of your cluster. In the left navigation pane, click Applications > Helm.
-
Locate ack-alibaba-cloud-metrics-adapter and click Update in the Actions column. In the
prometheus.adapter.rulesfield, add the following metric collection rules:-
vllm:num_requests_waiting: Number of requests waiting to be processed, exposed asnum_requests_waiting -
vllm:num_requests_running: Number of requests currently being processed, exposed asnum_requests_running
Variable Description <<.Series>>The metric series name matched by seriesQuery<<.LabelMatchers>>Label filters generated from the resource overrides (namespace, Pod name) <<.GroupBy>>The grouping labels for aggregation rules: - seriesQuery: 'vllm:num_requests_waiting' resources: overrides: kubernetes_namespace: {resource: "namespace"} kubernetes_pod_name: {resource: "pod"} name: matches: 'vllm:num_requests_waiting' as: 'num_requests_waiting' metricsQuery: 'sum(<<.Series>>{<<.LabelMatchers>>}) by (<<.GroupBy>>)' - seriesQuery: 'vllm:num_requests_running' resources: overrides: kubernetes_namespace: {resource: "namespace"} kubernetes_pod_name: {resource: "pod"} name: matches: 'vllm:num_requests_running' as: 'num_requests_running' metricsQuery: 'sum(<<.Series>>{<<.LabelMatchers>>}) by (<<.GroupBy>>)'The template variables in
metricsQuerywork as follows: -
-
Click OK.
-
Verify that the custom metrics are registered correctly:
kubectl get --raw "/apis/custom.metrics.k8s.io/v1beta1/namespaces/test/pods/qwen3-xxxxx/num_requests_waiting"
kubectl get --raw "/apis/custom.metrics.k8s.io/v1beta1/namespaces/test/pods/qwen3-xxxxx/num_requests_running"
If the output includes vLLM metric values, the configuration succeeded.
Step 2: Deploy the vLLM inference service in the fleet
Save the following YAML as deployment.yaml and run kubectl apply -f deployment.yaml.
The Deployment uses the Qwen/Qwen3-0.6B model downloaded from ModelScope, served on port 8000. Prometheus scrape annotations on the Pod enable automatic metric collection without a separate PodMonitor.
apiVersion: apps/v1
kind: Deployment
metadata:
  name: qwen3
  namespace: test
spec:
  progressDeadlineSeconds: 600
  replicas: 1
  revisionHistoryLimit: 10
  selector:
    matchLabels:
      app: qwen3
  template:
    metadata:
      annotations:
        # Enables Prometheus scraping — equivalent to a PodMonitor
        prometheus.io/path: /metrics
        prometheus.io/port: "8000"
        prometheus.io/scrape: "true"
      labels:
        app: qwen3
    spec:
      containers:
      # Serves Qwen3-0.6B downloaded from ModelScope
      - command:
        - sh
        - -c
        - export VLLM_USE_MODELSCOPE=True; vllm serve Qwen/Qwen3-0.6B --served-model-name
          qwen3-0.6b --port 8000 --trust-remote-code --tensor_parallel_size=1 --max-model-len
          2048 --gpu-memory-utilization 0.8
        image: kube-ai-registry.cn-shanghai.cr.aliyuncs.com/kube-ai/vllm-openai:v0.9.1
        imagePullPolicy: IfNotPresent
        name: vllm
        ports:
        - containerPort: 8000
          name: restful
          protocol: TCP
        readinessProbe:
          failureThreshold: 3
          initialDelaySeconds: 30
          periodSeconds: 10
          successThreshold: 1
          tcpSocket:
            port: 8000
          timeoutSeconds: 1
        resources:
          limits:
            nvidia.com/gpu: "1"
          requests:
            nvidia.com/gpu: "1"
      dnsPolicy: ClusterFirst
      restartPolicy: Always
      schedulerName: default-scheduler
      securityContext: {}
      terminationGracePeriodSeconds: 30
Step 3: Configure multi-cluster distribution policy in the fleet
Save the following YAML as propagationpolicy.yaml and run kubectl apply -f propagationpolicy.yaml.
Key fields:
-
autoScaling.ecsProvision: Enables inventory-aware intelligent scheduling. The fleet provisions ECS instances automatically when existing GPU instances are insufficient. -
clusterAffinities: Defines priority-based cluster groups. The scheduler fills groups in order—high-priority first, then low-priority when the high-priority group runs out of capacity.
apiVersion: policy.one.alibabacloud.com/v1alpha1
kind: PropagationPolicy
metadata:
  name: vllm-deploy-pp
  namespace: test
spec:
  autoScaling:
    ecsProvision: true
  placement:
    clusterAffinities:
    - affinityName: high-priority
      clusterNames:
      - ${cluster1_id}
    - affinityName: low-priority
      clusterNames:
      - ${cluster2_id}
    replicaScheduling:
      replicaSchedulingType: Divided
      replicaDivisionPreference: Weighted
      weightPreference:
        dynamicWeight: AvailableReplicas
  preserveResourcesOnDeletion: false
  resourceSelectors:
  - apiVersion: apps/v1
    kind: Deployment
    namespace: test
  - apiVersion: v1
    kind: Service
    namespace: test
  schedulerName: default-scheduler
Step 4: Create a FederatedHPA in the fleet
FederatedHPA monitors CPU, memory, custom metrics, and external metrics for Pods. This example uses the vLLM custom metrics num_requests_waiting and num_requests_running to trigger scaling.
Save the following YAML as federatedhpa.yaml and run kubectl apply -f federatedhpa.yaml.
apiVersion: autoscaling.one.alibabacloud.com/v1alpha1
kind: FederatedHPA
metadata:
  name: vllm-fhpa
  namespace: test
spec:
  scaleTargetRef:
    apiVersion: apps/v1
    kind: Deployment
    name: qwen3
  minReplicas: 1
  maxReplicas: 10
  behavior:
    scaleDown:
      stabilizationWindowSeconds: 30
    scaleUp:
      stabilizationWindowSeconds: 10
  metrics:
    - type: Pods
      pods:
        metric:
          name: num_requests_waiting
        target:
          type: AverageValue
          averageValue: ${waiting_size} # Optimal value varies by GPU and model
    - type: Pods
      pods:
        metric:
          name: num_requests_running
        target:
          type: AverageValue
          averageValue: ${running_size} # Optimal value varies by GPU and model
Key fields in the metrics block:
| Field | Description |
|---|---|
type: Pods |
Aggregates the metric across all Pods in the target Deployment and computes a per-Pod average |
target.type: AverageValue |
Scales when the per-Pod average exceeds averageValue |
averageValue |
The target threshold per Pod. The optimal value varies by GPU and model |
behavior.scaleDown.stabilizationWindowSeconds |
How long FederatedHPA waits before scaling down after metrics drop. Set to 30 seconds in this example |
behavior.scaleUp.stabilizationWindowSeconds |
How long FederatedHPA waits before scaling up after metrics rise. Set to 10 seconds in this example |
Verify results
Verify priority-based scheduling
Scale out the workload manually:
kubectl scale deployment -n test qwen3 --replicas=2Because cluster1 has only one GPU instance, the second replica is scheduled to cluster2 in the low-priority group.
Verify FederatedHPA
-
Expose the service using a multi-cluster ALB, as described in Manage north-south traffic, and get the Ingress address.
-
Run a load test against the service (replace the ALB address):
hey -n 600 -c 60 -m POST -H "Content-Type: application/json" \ -d '{"messages": [{"role": "user", "content": "Test it"}]}' \ http://alb-xxxxxx.cn-hangzhou.alb.aliyuncsslb.com:8000/v1/chat/completions -
Check that
num_requests_runningrises and the replica count increases:Current Metrics: Pods: Current: Average Value: 0 Metric: Name: num_requests_waiting Type: Pods Pods: Current: Average Value: 58 Metric: Name: num_requests_running Type: Pods Current Replicas: 2 Desired Replicas: 3 -
After the load test ends, verify scale-down. The FederatedHPA is configured with a 30-second scale-down stabilization window. Wait about one minute, then run:
kubectl get fhpa -n test vllm-fhpaThe desired replica count should return to the minimum (1) once
num_requests_runningdrops below the threshold. A healthy output looks similar to:NAME REFERENCE MINPODS MAXPODS REPLICAS AGE vllm-fhpa Deployment/qwen3 1 10 1 10m
Verify inventory-aware intelligent scheduling
After scaling the inference application to three replicas, the new replica starts successfully—even though cluster1 and cluster2 together have only two GPU instances. This confirms that inventory-aware intelligent scheduling provisioned the additional ECS instance automatically.
FAQ
kubectl get fhpa shows empty values in the REPLICAS column. Why?
The FederatedHPA did not match the target workload. Check the workload name and namespace in spec.scaleTargetRef.
kubectl get fhpa -o yaml returns a replica count error. Why?
The condition error reads the HPA was unable to compute the replica count: unable to obtain metric xxx. FederatedHPA cannot fetch metrics from child clusters.
-
Confirm that ack-alibaba-cloud-metrics-adapter is installed in all child clusters.
-
Confirm that the component parameters are correct in each child cluster. In the child cluster dashboard, run:
kubectl get --raw "/apis/custom.metrics.k8s.io/v1beta1" | jq .A healthy response lists all registered custom metrics. If the output is empty, review the Helm application parameter settings and check whether the metrics rules match the actual vLLM metric names exposed by your Pods.
-
Check the FederatedHPA status conditions directly:
kubectl describe fhpa -n test vllm-fhpaLook for the
ScalingActivecondition in the output:Conditions: Type Status Reason Message ---- ------ ------ ------- AbleToScale True ReadyForNewScale the last scale time was sufficiently old... ScalingActive False FailedGetScale the HPA was unable to compute the replica count...ScalingActive: Falsewith reasonFailedGetScaleorInvalidSelectorindicates a metrics fetch failure or target mismatch. Review the adapter configuration and confirm thatspec.scaleTargetRefpoints to the correct Deployment name and namespace.
Why can't I see metrics in child clusters?
Run the following command to check whether custom metrics are registered:
kubectl get --raw "/apis/custom.metrics.k8s.io/v1beta1" | jq .If no metrics appear, review the Helm application parameter settings for ack-alibaba-cloud-metrics-adapter.