Fluid is a Kubernetes-native distributed dataset orchestration and acceleration engine that serves data-intensive applications, such as big data applications and AI applications, in cloud-native scenarios. Fluid provides application-oriented dataset abstraction, a scalable data engine plug-in, automated data operations, data acceleration, and runtime platform agnostic. You can install the Fluid monitoring component on Prometheus instances of Managed Service for Prometheus with a few clicks and use the out-of-the-box dashboards provided by Managed Service for Prometheus to monitor Fluid. This topic describes how to enable Managed Service for Prometheus for Fluid.
Prerequisites
Managed Service for Prometheus is enabled for a Container Service for Kubernetes (ACK) cluster or ACK Serverless cluster. For more information, see Managed Service for Prometheus.
The cloud-native AI suite is deployed and Fluid data acceleration is enabled. For more information, see Deploy the cloud-native AI suite.
To use all features of the Fluid control plane dashboard, make sure that ack-fluid 0.9.7 or later is installed in the cluster.
To use all features of the Fluid JindoRuntime cache system dashboard, make sure that ack-fluid 1.0.11 or later is installed.
Limits
The cache system dashboard supports only cache runtime components of the JindoRuntime type (JindoCache engine).
Step 1: Integrate Fluid with ARMS
Log on to the ARMS console.
In the left-side navigation pane, click Integration Center. In the AI section, click the Fluid card.
In the Select a Kubernetes cluster section of the Fluid page, select the desired cluster. If the page shows that Fluid is already installed, skip the steps in this section.
In the Configuration Information section, configure the parameters and click OK.
Parameter
Description
Name (Not required)
The unique name of the Fluid exporter. You can leave it empty.
metrics collection interval (seconds)
The interval at which you want the service to collect monitoring data.
You can view integrated components on the Integration Management page of the ARMS console.
Log on to the ARMS console.
In the left-side navigation pane, click Integration Management. On the Integrated Addons tab, click the Fluid card.
On the Environments tab, click View Details in the Actions column to view the Fluid component in the cluster and alert rules.
Step 2: View the Fluid dashboard
View the Fluid dashboard from the ACK console (recommended)
Log on to the ACK console. In the left-side navigation pane, click Clusters.
On the Clusters page, click the ACK cluster or ACK Serverless cluster in which the Fluid component is installed. In the left-side pane, choose .
On the Prometheus Monitoring page, choose to view the monitoring data of Fluid control planes.
In the Fluid control plane dashboard, you can view detailed information about the Fluid control plane components, such as the status of the components, the Fluid controller processing time, the QPS of the Fluid webhook, the request processing latency, and the resource usage of each component. For more information, see Fluid dashboard parameters.
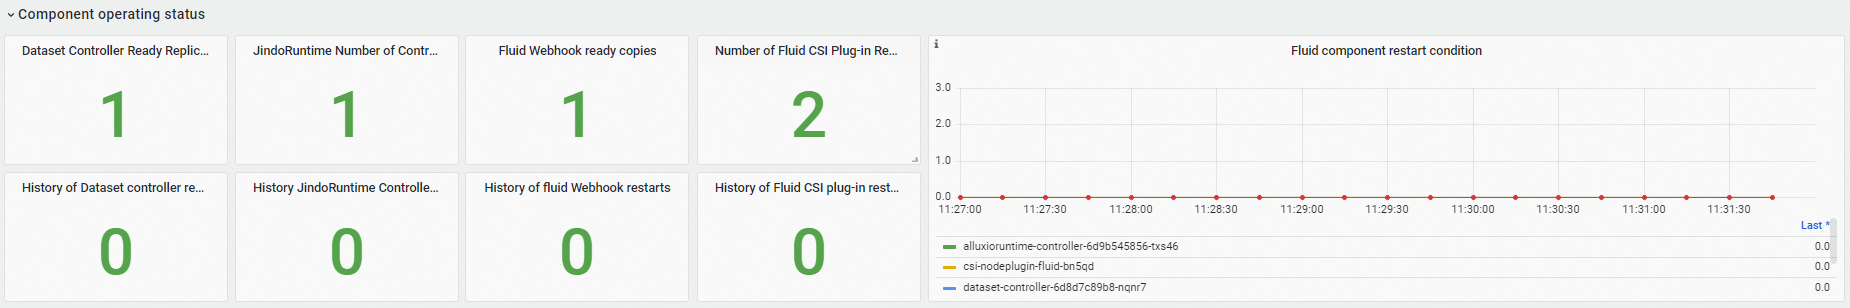
In the Component running status section, you can view the number of Fluid control plane pods that are in the Running state, the number of restarts, and the time of each restart.
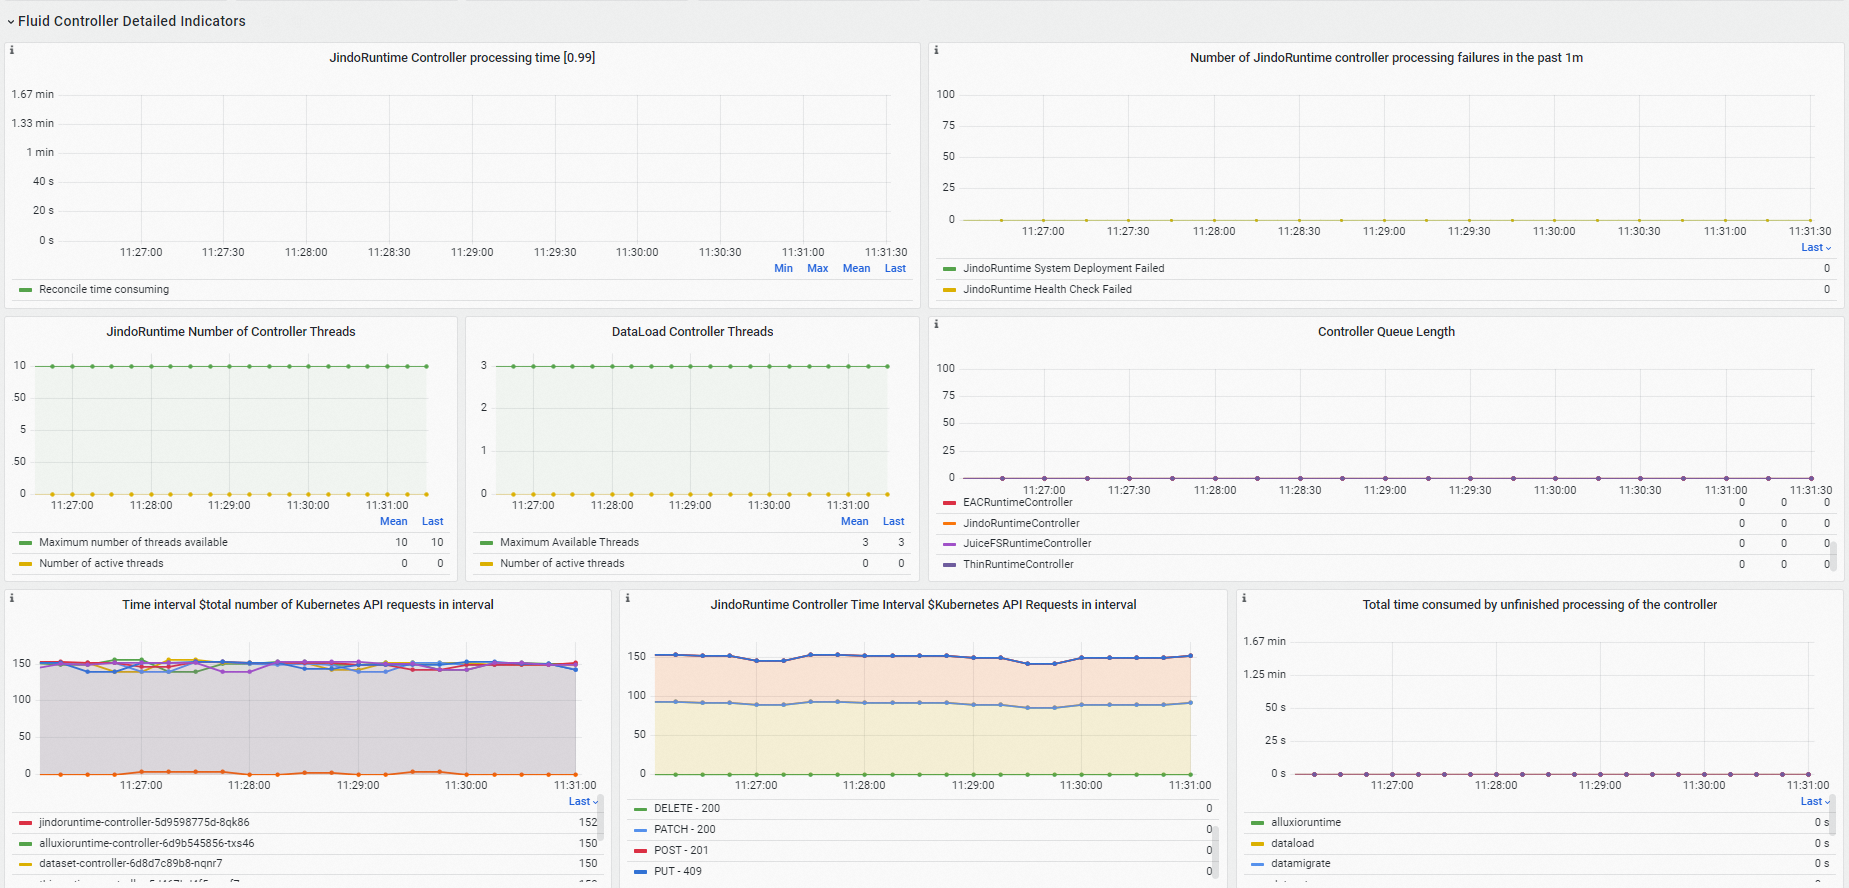
In the Fluid Controller Detailed Indicators section, you can check whether the Fluid controllers are busy and view information about processing failures and Kubernetes API requests.
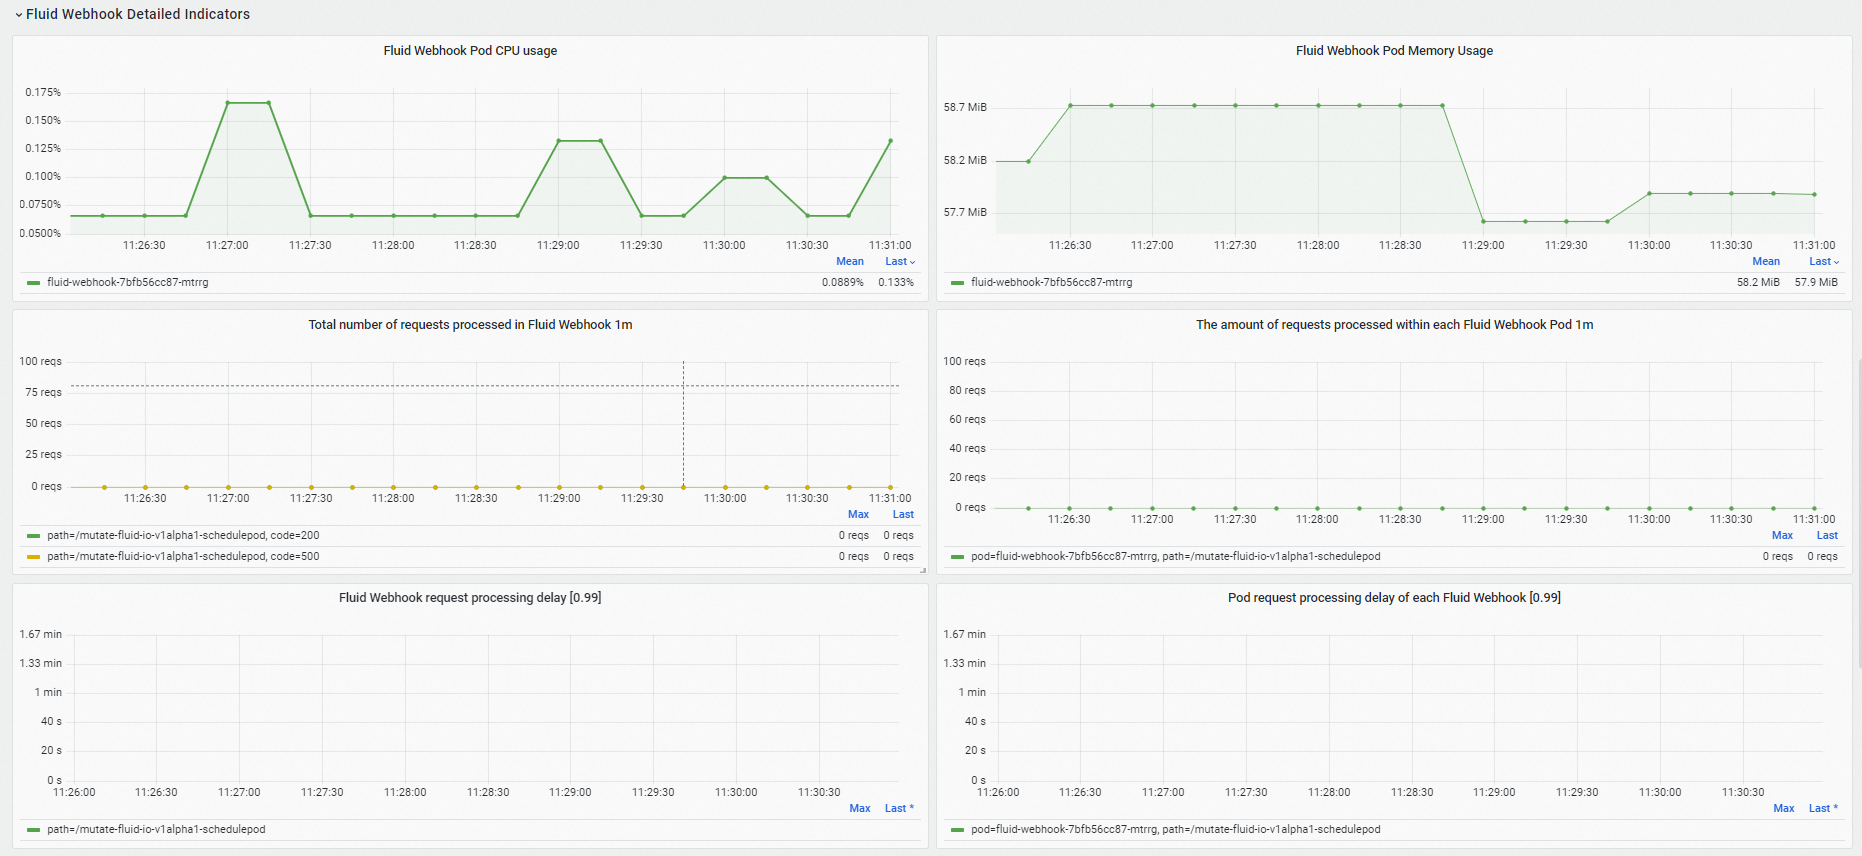
In the Fluid Webhook Detailed Indicators section, you view the resource usage of the Fluid webhook, the number of processed requests, and the request processing latency.
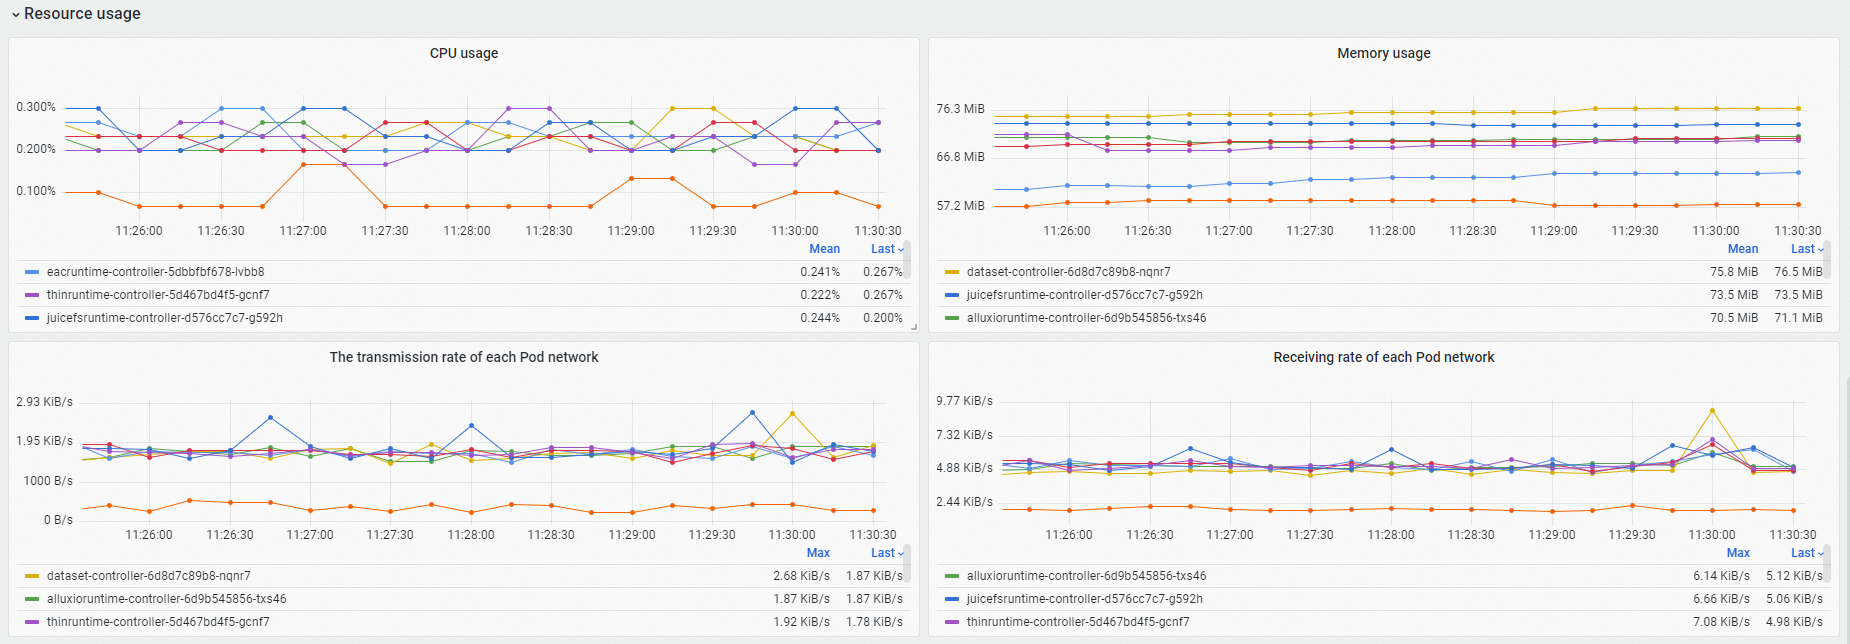
In the Resource usage section, you can view the resource usage of each Fluid control plane component, the network transmit rate, and the network receive rate.
On the Prometheus Monitoring page, choose to view the monitoring data of the Fluid JindoRuntime cache system.
In the Fluid JindoRuntime cache system dashboard, you view the overview of Fluid Datasets, metrics of the cache system, and metrics of the FUSE client. For more information, see Fluid dashboard parameters.
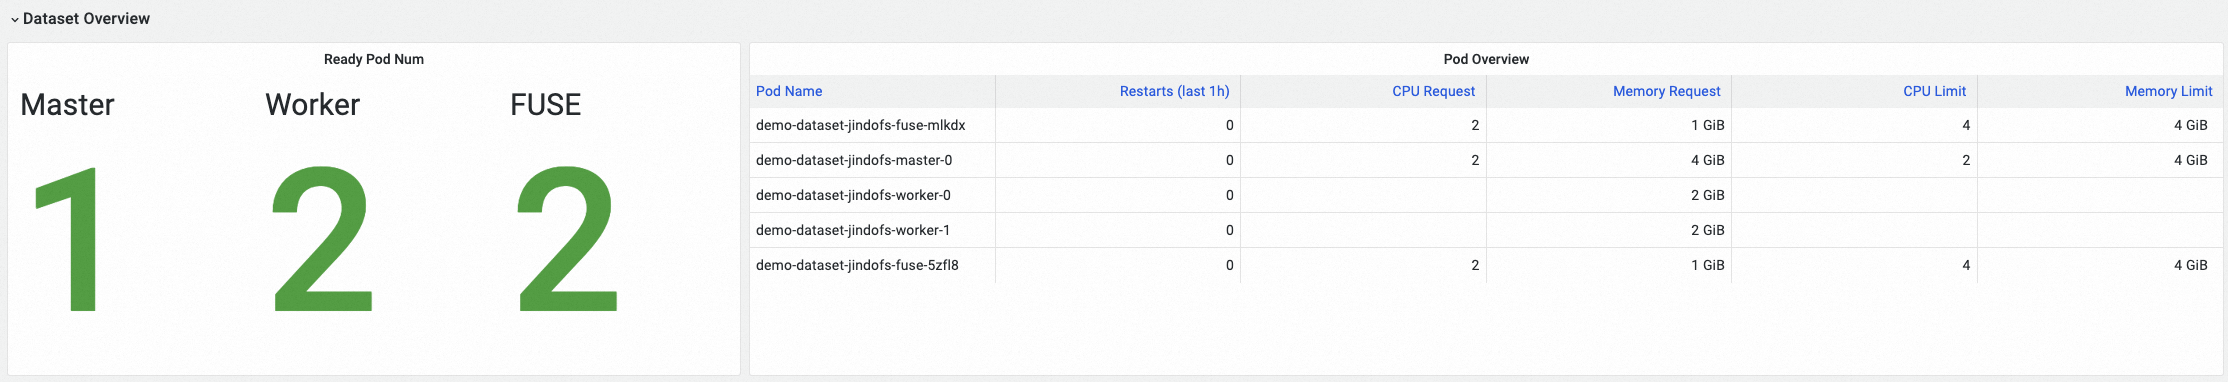
In the Dataset Overview section, you can view the overview information of a Fluid Dataset, including the number of healthy pods for the master, worker, and FUSE components and the resource configuration of each pod.
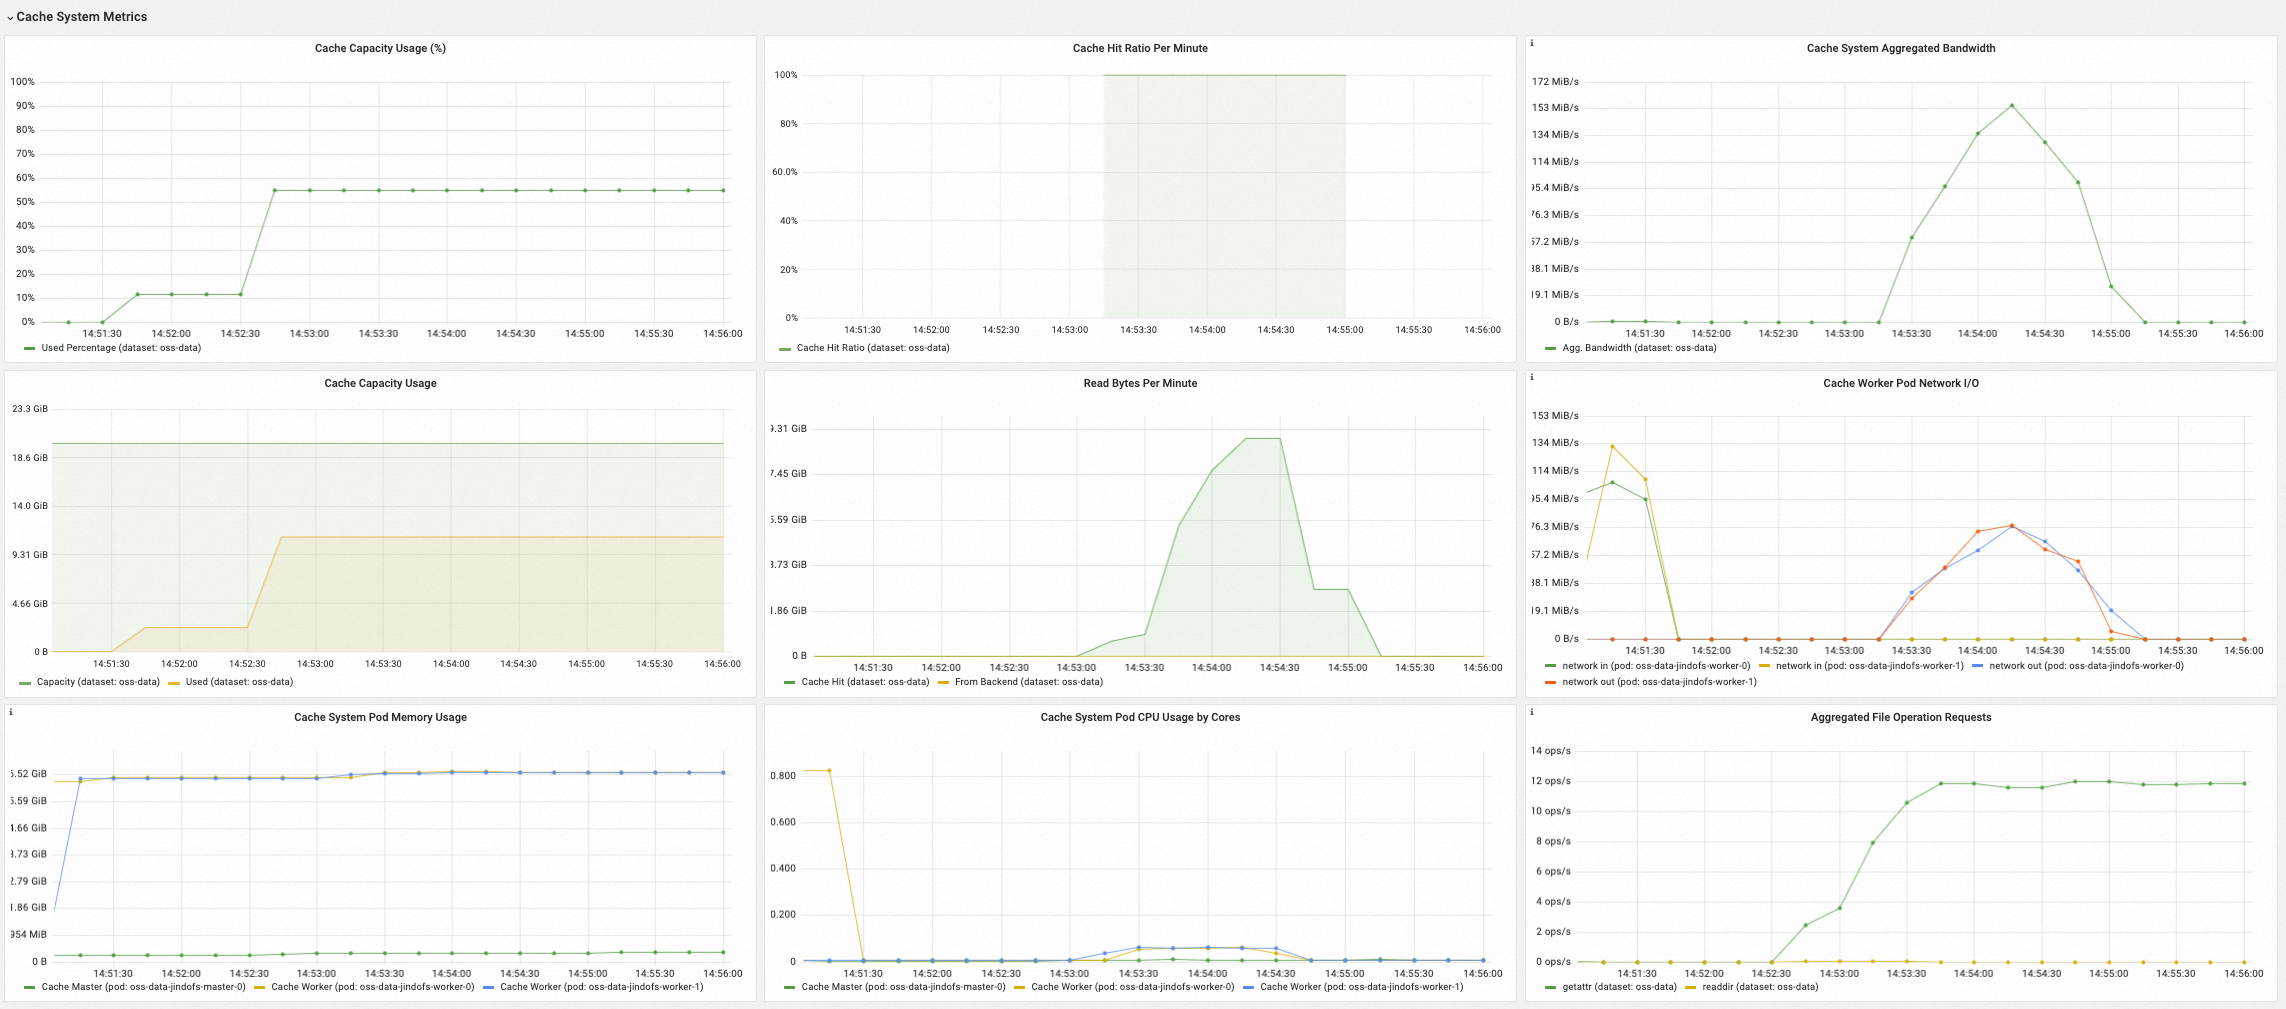
In the Cache System Metrics section, you can view the metrics of the selected cache system, including the current cache usage, cache hit ratio, aggregated bandwidth, and QPS of the cache system for processing file metadata.
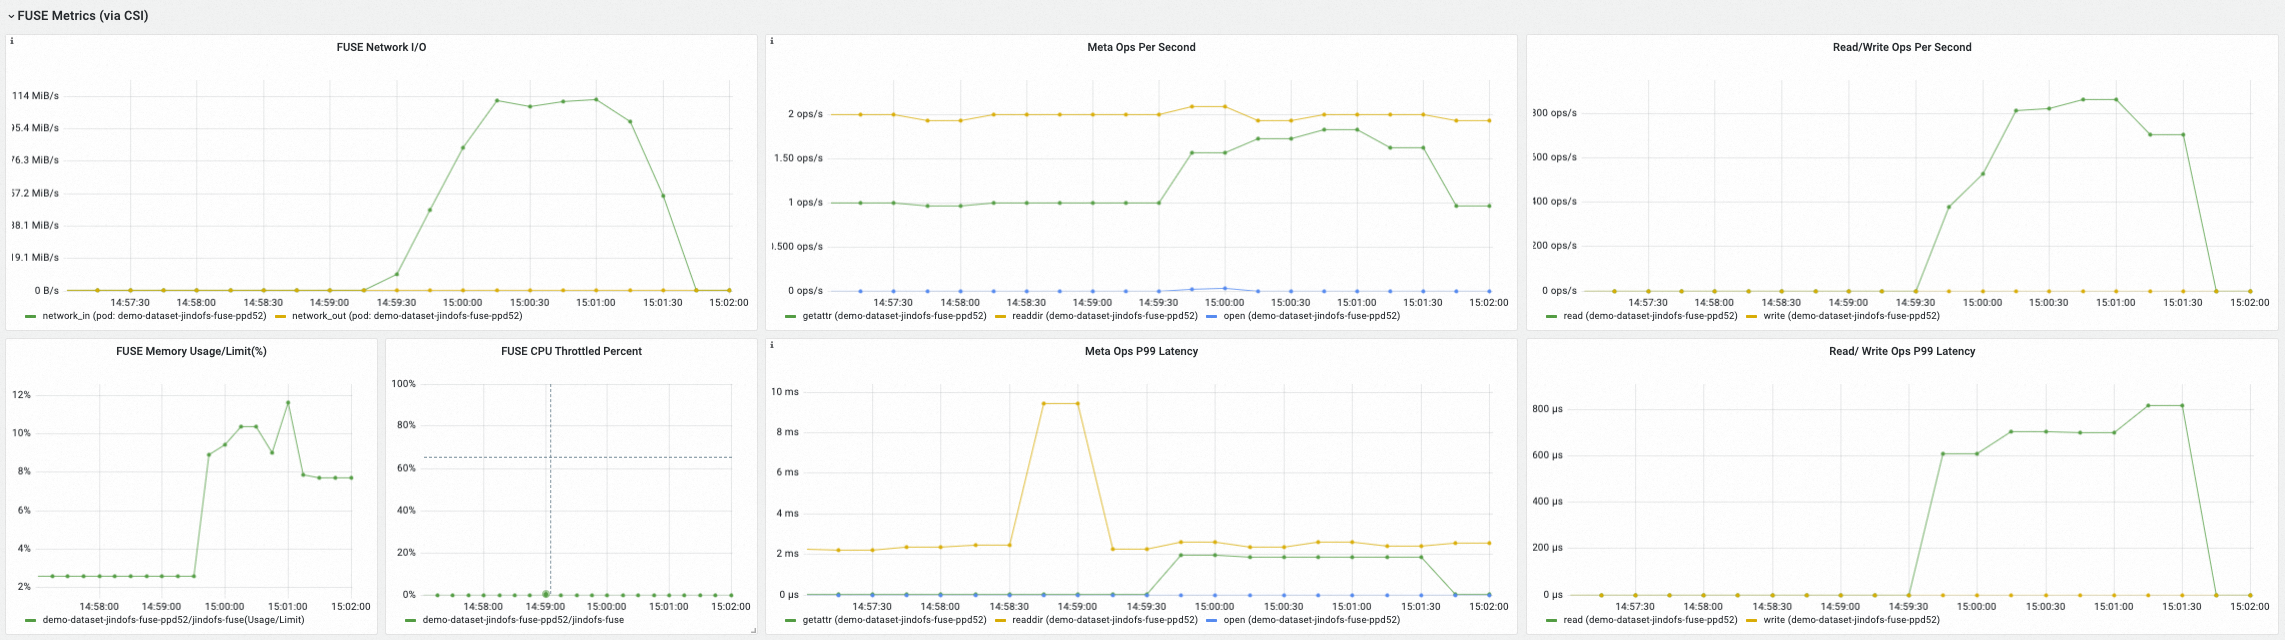
In the FUSE Metrics (via CSI) section, you can view the metrics of FUSE clients that are mounted through the Fluid CSI plug-in and FUSE pods, including the input/output of each FUSE pod, the latency and QPS of metadata operations, and the latency and QPS of read and write operations.
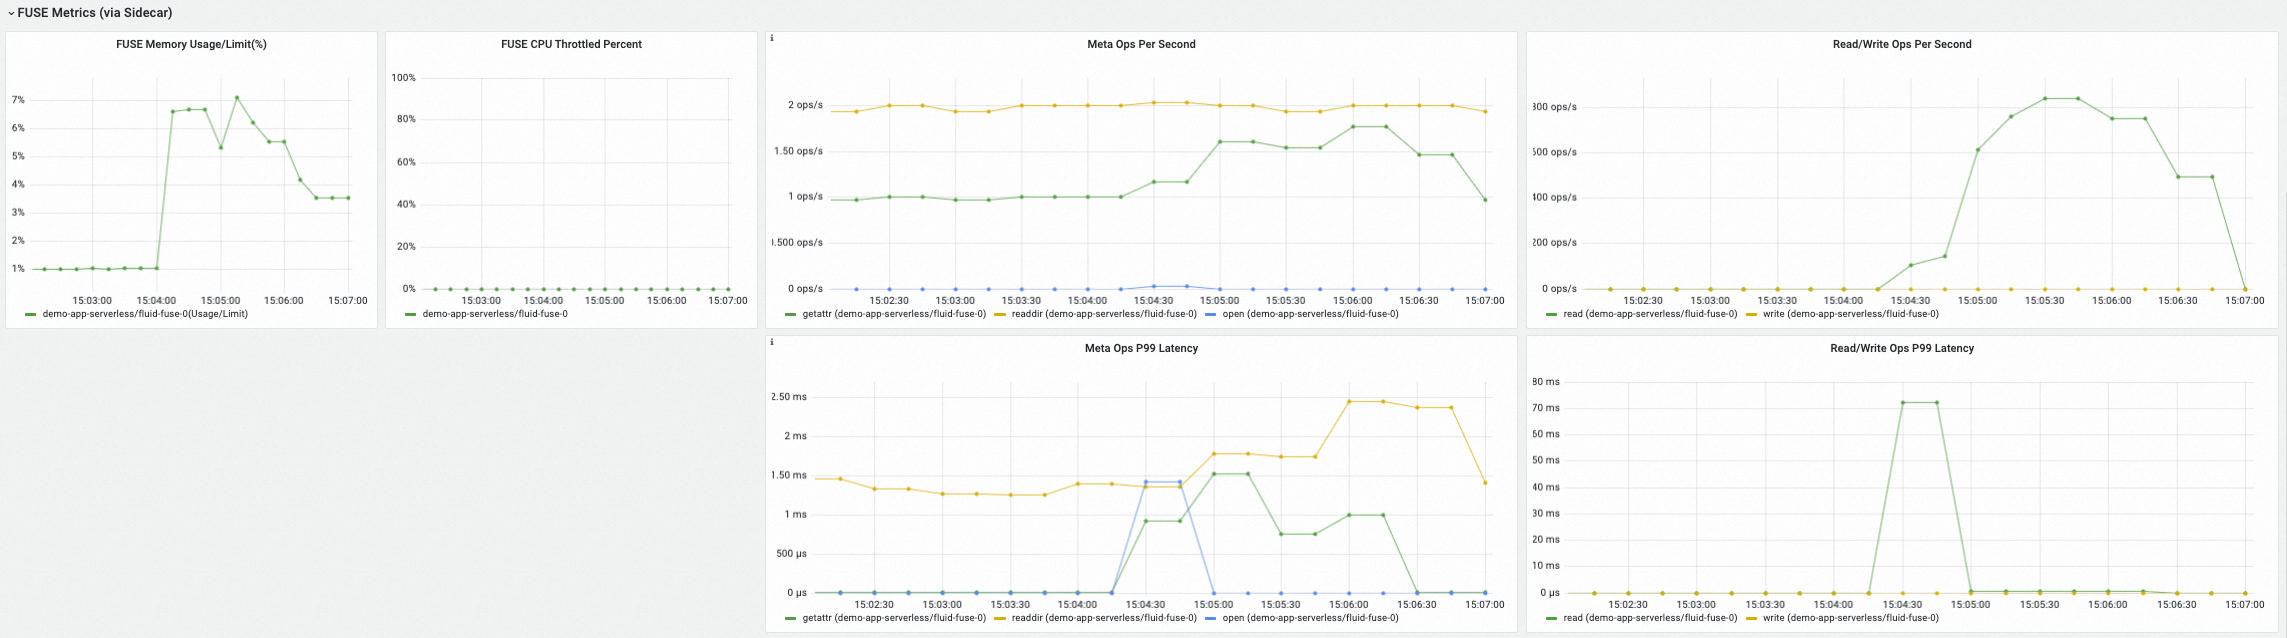
In the FUSE Metrics (via Sidecar) section, you can view the metrics of FUSE clients that are mounted through the Fluid FUSE sidecar, including the latency and QPS of metadata operations and the latency and QPS of read and write operations.
View the Fluid dashboard from the ARMS console
Log on to the ARMS console.
In the left-side navigation pane, click Integration Management. Click the Query Dashboards tab, select Fluid from the component drop-down list, and click Fluid Control Plane in the lower part of the page. You can view the monitoring data of the Fluid control planes in the dashboard.
In the Fluid dashboard, you can view detailed information about the Fluid control plane components, such as the status of the components, the Fluid controller processing time, the QPS of the Fluid webhook, the request processing latency, and the resource usage of each component. For more information, see Fluid dashboard parameters.
In the Component running status section, you can view the number of Fluid control plane pods that are in the Running state, the number of restarts, and the time of each restart.
In the Fluid Controller Detailed Indicators section, you can check whether the Fluid controllers are busy and view information about processing failures and Kubernetes API requests.
In the Fluid Webhook Detailed Indicators section, you view the resource usage of the Fluid webhook, the number of processed requests, and the request processing latency.
In the Resource usage section, you can view the resource usage of each Fluid control plane component, the network transmit rate, and the network receive rate.
In the left-side navigation pane, click Integration Management. Click the Query Dashboards tab, select Fluid from the component drop-down list, and click Fluid JindoRuntime Dashboard in the lower part of the page. You can view the monitoring data of the Fluid JindoRuntime cache system in the dashboard.
In the Dataset Overview section, you can view the overview information of a Fluid Dataset, including the number of healthy pods for the master, worker, and FUSE components and the resource configuration of each pod.
In the Cache System Metrics section, you can view the metrics of the selected cache system, including the current cache usage, cache hit ratio, aggregated bandwidth, and QPS of the cache system for processing file metadata.
In the FUSE Metrics (via CSI) section, you can view the metrics of FUSE clients that are mounted through the Fluid CSI plug-in and FUSE pods, including the input/output of each FUSE pod, the latency and QPS of metadata operations, and the latency and QPS of read and write operations.
In the FUSE Metrics (via Sidecar) section, you can view the metrics of FUSE clients that are mounted through the Fluid FUSE sidecar, including the latency and QPS of metadata operations and the latency and QPS of read and write operations.
Introduction to metrics
The following table describes the monitoring metrics for the Fluid control plane components.
Metric | Type | Description |
dataset_ufs_total_size | Gauge | The size of datasets that are mounted to the existing Dataset objects in the current cluster. |
dataset_ufs_file_num | Gauge | The number of datasets that are mounted to the existing Dataset objects in the current cluster. |
runtime_setup_error_total | Counter | The number of failures to start up the runtime when the controller reconciles. |
runtime_sync_healthcheck_error_total | Counter | The number of runtime health check failures that occur when the controller reconciles. |
controller_runtime_reconcile_time_seconds_bucket | Histogram | The duration of the reconciliation process. |
controller_runtime_reconcile_errors_total | Counter | The number of reconciliation failures. |
controller_runtime_reconcile_total | Counter | The number of successful reconciliations. |
controller_runtime_max_concurrent_reconciles | Gauge | The maximum number of concurrent reconciliations supported by the controller. |
controller_runtime_active_workers | Gauge | The number of active reconciliations of the controller. |
workqueue_adds_total | Counter | The number of Adds events processed by the controller workqueue. |
workqueue_depth | Gauge | The length of the controller workqueue. |
workqueue_queue_duration_seconds_bucket | Histogram | The amount of time that the pending object has been waiting in the controller workqueue. |
workqueue_work_duration_seconds_bucket | Histogram | The distribution of the durations of the tasks that have been completed by the controller. |
workqueue_unfinished_work_seconds | Gauge | The total duration of all tasks that are being processed in the controller workqueue. |
workqueue_longest_running_processor_seconds | Gauge | The longest duration that the controller has spent to process a task. |
rest_client_requests_total | Counter | The number of HTTP requests calculated based on status codes, methods, and hosts. |
rest_client_request_duration_seconds_bucket | Histogram | The HTTP response latency calculated based on Verbs and URLs. |
controller_runtime_webhook_requests_in_flight | Gauge | The number of requests that are being processed by the webhook. |
controller_runtime_webhook_requests_total | Counter | The total number of requests that are processed by the webhook. |
controller_runtime_webhook_latency_seconds_bucket | Histogram | The request processing latency of the webhook. |
process_cpu_seconds_total | Counter | The CPU uptime. |
process_resident_memory_bytes | Gauge | The amount of used memory. |
The following table describes the metrices of the JindoCache servers displayed in the dashboard of the Fluid JindoRuntime cache system.
Metric | Type | Description |
jindocache_server_total_stsnodes_num | Gauge | The number of alive replicas for the worker component in the current distributed cache system. |
jindocache_server_total_disk_cap | Gauge | The maximum size of disk cache (including RAM disks such as tmpfs) in the distributed cache system. |
jindocache_server_total_used_disk_cap | Gauge | The amount of disk cache (including RAM disks such as tmpfs) used in the distributed cache system. |
jindocache_server_total_mem_cap | Gauge | The maximum size of RAM cache in the distributed cache system. |
jindocache_server_total_used_mem_cap | Gauge | The amount of RAM cache used in the distributed cache system. |
jindocache_server_total_used_rocksdb_cap | Gauge | RocksDB used in the distributed cache system. |
jindocache_server_backend_read_bytes_total | Gauge | The total amount of data read from the underlying storage system. Unit: bytes. Data is read from the underlying storage system when the data is not found in the JindoCache. |
jindocache_server_backend_read_time_total | Gauge | The duration of reading data from the underlying storage system. Unit: microseconds. |
jindocache_server_backend_readop_num_total | Gauge | The total number of times that data is read from the underlying storage system, which equals the number of blocks in the JindoCache. |
jindocache_server_backend_read_bytes_time_total_window | Gauge | The duration of reading data from the underlying storage system within a minute. Unit: microseconds. |
jindocache_server_backend_read_bytes_total_window | Gauge | The total amount of data read from the underlying storage system within a minute. Unit: bytes. |
jindocache_server_remote_read_bytes_total | Gauge | The total amount of data read through remote cache hits in the same cluster. Unit: bytes. A remote cache hit occurs when the requested is found in the JindoCache but the cached data and the application reside on different nodes. |
jindocache_server_remote_read_time_total | Gauge | The total duration of remote cache hits in the same cluster. Unit: microseconds. |
jindocache_server_remote_readop_num_total | Gauge | The number of remote cache hits in the same cluster. |
jindocache_server_remote_read_bytes_time_total_window | Gauge | The total duration of remote cache hits within a minute. Unit: microseconds. |
jindocache_server_remote_read_bytes_total_window | Gauge | The total amount of data read through remote cache hits within a minute. Unit: bytes. |
jindocache_server_local_read_bytes_total | Gauge | The total amount of data read through local cache hits in the same cluster. Unit: bytes. A local cache hit occurs when the requested data is found in the JindoCache and the cached data and the application reside on the same node. |
jindocache_server_local_read_time_total | Gauge | The total duration of local cache hits in the same cluster. Unit: microseconds. |
jindocache_server_local_readop_num_total | Gauge | The total number of local cache hits in the same cluster. |
jindocache_server_local_read_bytes_time_total_window | Gauge | The total duration of local cache hits within a minute. Unit: microseconds. |
jindocache_server_local_read_bytes_total_window | Gauge | The total amount of data read through local cache hits within a minute. Unit: bytes. |
jindocache_server_ns_filelet_op_count_total | Gauge | The total number of file metadata operations performed on the JindoCache master component side, including the getAttr and listStatus operations. |
jindocache_server_ns_filelet_op_time_total | Gauge | The total duration of file metadata operations performed on the JindoCache master component side, including the getAttr and listStatus operations. |
jindocache_server_ns_get_attr_op_total | Gauge | The number of getAttr operations performed on the JindoCache master component side. |
jindocache_server_ns_get_attr_time_total | Gauge | The duration of getAttr operations performed on the JindoCache master component side. |
jindocache_server_ns_get_attr_fallback_op_total | Gauge | The number of times that the JindoCache master component reads file metadata from the underlying storage system. |
jindocache_server_ns_list_status_op_total | Gauge | The number of listStatus operations performed on the JindoCache master component side. |
jindocache_server_ns_list_status_time_total | Gauge | The duration of listStatus operations performed on the JindoCache master component side. |
jindocache_server_ns_list_status_fallback_op_total | Gauge | The number of times that the JindoCache master component reads the file list from the underlying storage system. |
jindocache_server_dist_get_attr_op_num_total | Gauge | The number of getAttr operations performed on the JindoCache client side. |
jindocache_server_dist_get_attr_time_total | Gauge | The duration of getAttr operations performed on the JindoCache client side. |
jindocache_server_dist_list_dir_op_num_total | Gauge | The number of listStatus operations performed on the JindoCache client side. |
jindocache_server_dist_list_dir_time_total | Gauge | The duration of listStatus operations performed on the JindoCache client side. |
The following table describes the metrics of the JindoCache FUSE client displayed in the Fluid JindoRuntime dashboard.
Metric | Type | Description |
jindo_fuse_open_count | Gauge | The number of open operations performed by the Jindo FUSE client. |
jindo_fuse_open_latency | Gauge | The P50 latency of open operations performed by the Jindo FUSE client. |
jindo_fuse_open_latency_80 | Gauge | The P80 latency of open operations performed by the Jindo FUSE client. |
jindo_fuse_open_latency_90 | Gauge | The P90 latency of open operations performed by the Jindo FUSE client. |
jindo_fuse_open_latency_99 | Gauge | The P99 latency of open operations performed by the Jindo FUSE client. |
jindo_fuse_open_latency_999 | Gauge | The P99.9 latency of open operations performed by the Jindo FUSE client. |
jindo_fuse_open_latency_9999 | Gauge | The P99.99 latency of open operations performed by the Jindo FUSE client. |
jindo_fuse_getattr_count | Gauge | The number of getAttr operations performed by the Jindo FUSE client. |
jindo_fuse_getattr_latency | Gauge | The P50 latency of getAttr operations performed by the Jindo FUSE client. |
jindo_fuse_getattr_latency_80 | Gauge | The P80 latency of getAttr operations performed by the Jindo FUSE client. |
jindo_fuse_getattr_latency_90 | Gauge | The P90 latency of getAttr operations performed by the Jindo FUSE client. |
jindo_fuse_getattr_latency_99 | Gauge | The P99 latency of getAttr operations performed by the Jindo FUSE client. |
jindo_fuse_getattr_latency_999 | Gauge | The P99.9 latency of getAttr operations performed by the Jindo FUSE client. |
jindo_fuse_getattr_latency_9999 | Gauge | The P99.99 latency of getAttr operations performed by the Jindo FUSE client. |
jindo_fuse_readdir_count | Gauge | The number of readDir operations performed by the Jindo FUSE client. |
jindo_fuse_readdir_latency | Gauge | The P50 latency of readDir operations performed by the Jindo FUSE client. |
jindo_fuse_readdir_latency_80 | Gauge | The P80 latency of readDir operations performed by the Jindo FUSE client. |
jindo_fuse_readdir_latency_90 | Gauge | The P90 latency of readDir operations performed by the Jindo FUSE client. |
jindo_fuse_readdir_latency_99 | Gauge | The P99 latency of readDir operations performed by the Jindo FUSE client. |
jindo_fuse_readdir_latency_999 | Gauge | The P99.9 latency of readDir operations performed by the Jindo FUSE client. |
jindo_fuse_readdir_latency_9999 | Gauge | The P99.99 latency of readDir operations performed by the Jindo FUSE client. |
jindo_fuse_read_count | Gauge | The number of read operations performed by the Jindo FUSE client. |
jindo_fuse_read_latency | Gauge | The P50 latency of read operations performed by the Jindo FUSE client. |
jindo_fuse_read_latency_80 | Gauge | The P80 latency of read operations performed by the Jindo FUSE client. |
jindo_fuse_read_latency_90 | Gauge | The P90 latency of read operations performed by the Jindo FUSE client. |
jindo_fuse_read_latency_99 | Gauge | The P99 latency of read operations performed by the Jindo FUSE client. |
jindo_fuse_read_latency_999 | Gauge | The P99.9 latency of read operations performed by the Jindo FUSE client. |
jindo_fuse_read_latency_9999 | Gauge | The P99.99 latency of read operations performed by the Jindo FUSE client. |
jindo_fuse_write_count | Gauge | The number of write operations performed by the Jindo FUSE client. |
jindo_fuse_write_latency | Gauge | The P50 latency of write operations performed by the Jindo FUSE client. |
jindo_fuse_write_latency_80 | Gauge | The P80 latency of write operations performed by the Jindo FUSE client. |
jindo_fuse_write_latency_90 | Gauge | The P90 latency of write operations performed by the Jindo FUSE client. |
jindo_fuse_write_latency_99 | Gauge | The P99 latency of write operations performed by the Jindo FUSE client. |
jindo_fuse_write_latency_999 | Gauge | The P99.9 latency of write operations performed by the Jindo FUSE client. |
jindo_fuse_write_latency_9999 | Gauge | The P99.99 latency of write operations performed by the Jindo FUSE client. |
References
For more information about Fluid, see Overview of Fluid.
For more information about Fluid panels, see Fluid dashboard parameters.