Install AI/ML components, monitor GPU resources, and manage team quotas on ACK Pro clusters.
Three core tasks: install the suite, view resource dashboards, and manage users and quotas with capacity scheduling.
Prerequisites
Before you begin:
-
An ACK Pro cluster running Kubernetes 1.18 or later
-
the monitoring add-on and Simple Log Service enabled on the Component Configurations page during cluster creation
Key concepts
Security boundary
Kubernetes is a single-tenant orchestrator: one control plane serves all tenants in a cluster. The cluster is the only hard security boundary. Quota trees, user groups, and namespaces provide organizational guardrails and logical isolation — not the same security guarantees as cluster-level separation. Design your multi-tenant architecture accordingly.
How capacity scheduling works
Each quota node in a quota tree has two parameters:
-
Min: the guaranteed minimum resources the namespace can always claim, even when the cluster is under pressure
-
Max: the maximum resources the namespace can use when idle capacity is available
Other namespaces can borrow idle capacity up to their Max. When the owning namespace needs its minimum back, the scheduler reclaims resources, considering workload priority, availability, and creation time.
Resource objects
| Object | Role |
|---|---|
| Quota tree | Hierarchical resource allocation structure |
| Quota node | A node in the tree; each leaf node maps to one or more namespaces |
| User group | The smallest allocation unit; maps to a leaf quota node |
| User | Holds a Kubernetes service account to submit jobs and access the console |
| Namespace | Kubernetes namespace bound to a leaf quota node |
User roles
| Role | Permissions |
|---|---|
| admin | Log in to the AI Dashboard, manage cluster components, and has all researcher permissions |
| researcher | Submit jobs, use cluster resources, log in to AI Developer Console |
Step 1: Install the Cloud-native AI Suite
The suite has six component categories — install only what your workloads need. Arena is selected by default and is required.
| Component category | Purpose | Install separately? |
|---|---|---|
| Task elasticity | Scale AI workloads dynamically | No |
| Data acceleration | Speed up dataset access | No |
| AI task scheduling | Schedule AI workloads with capacity-aware policies | No |
| AI task lifecycle management | Manage training job lifecycles | No |
| AI Dashboard | Monitor GPU resources and quotas | Yes (requires RAM permissions) |
| AI Developer Console | Submit and manage AI jobs | Yes (requires RAM permissions) |
Deploy the suite
-
Log in to the ACK console and click Clusters in the left navigation pane.
-
Click the cluster name, then choose Applications > Cloud-native AI Suite in the left pane.
-
Click Deploy.
-
Select components and click Deploy Cloud-native AI Suite. The system checks dependencies before deploying. After installation, the Components list lets you Deploy, Upgrade, or Uninstall individual components.
-
After installing
ack-ai-dashboardandack-ai-dev-console, links to AI Dashboard and AI Developer Console appear on the Cloud-native AI Suite page.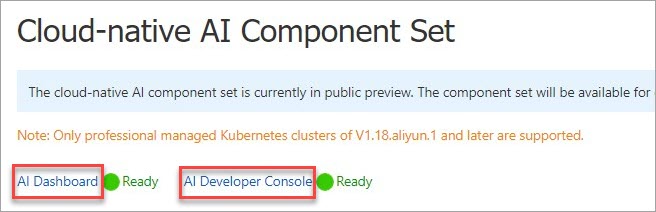
Configure AI Dashboard
Since January 22, 2025, the AI Console (AI Dashboard and AI Developer Console) requires whitelist access. Deployments before that date are unaffected. Non-whitelisted users can use the Open-source AI Console instead.
Grant RAM permissions to the worker role
Before AI Dashboard can access cluster data, attach a custom RAM policy to the cluster's worker role.
-
Create a custom policy.
-
Log in to the RAM console and choose Permissions > Policies in the left navigation pane.
-
Click Create Policy, select the JSON tab, and add the following policy:
{ "Version": "1", "Statement": [ { "Effect": "Allow", "Action": [ "cs:*", "log:GetProject", "log:GetLogStore", "log:GetConfig", "log:GetMachineGroup", "log:GetAppliedMachineGroups", "log:GetAppliedConfigs", "log:GetIndex", "log:GetSavedSearch", "log:GetDashboard", "log:GetJob", "ecs:DescribeInstances", "ecs:DescribeSpotPriceHistory", "ecs:DescribePrice", "eci:DescribeContainerGroups", "eci:DescribeContainerGroupPrice", "log:GetLogStoreLogs", "ims:CreateApplication", "ims:UpdateApplication", "ims:GetApplication", "ims:ListApplications", "ims:DeleteApplication", "ims:CreateAppSecret", "ims:GetAppSecret", "ims:ListAppSecretIds", "ims:ListUsers" ], "Resource": "*" } ] } -
Name the policy
k8sWorkerRolePolicy-{ClusterID}and click OK.
-
-
Attach the policy to the cluster's worker role.
-
In the RAM console, choose Identities > Roles and search for
KubernetesWorkerRole-{ClusterID}. -
Click Grant Permission.
-
In Select Policy, click Custom Policy, search for
k8sWorkerRolePolicy-{ClusterID}, select it, and click OK.
-
Complete the AI Dashboard setup
-
On the Cloud-native AI Suite page, select Sample Console for Interaction Mode. A Note dialog box appears.
-
If Authorized is shown, skip to step 3.
-
If Unauthorized appears in red, complete the RAM permissions above and click Authorization Check. After authorization, Authorized is displayed.
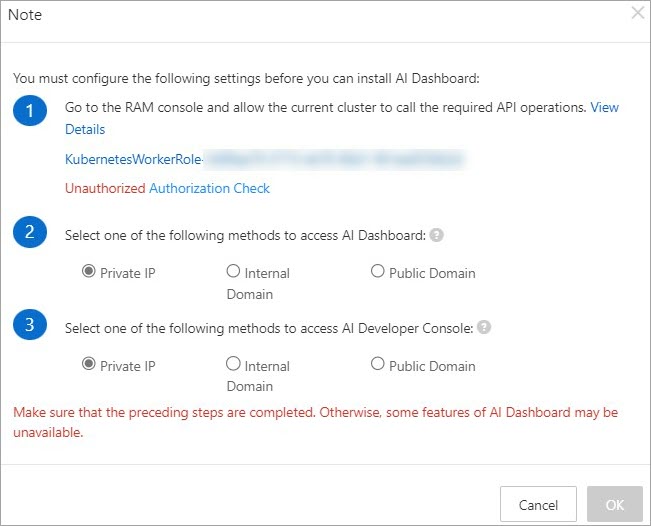
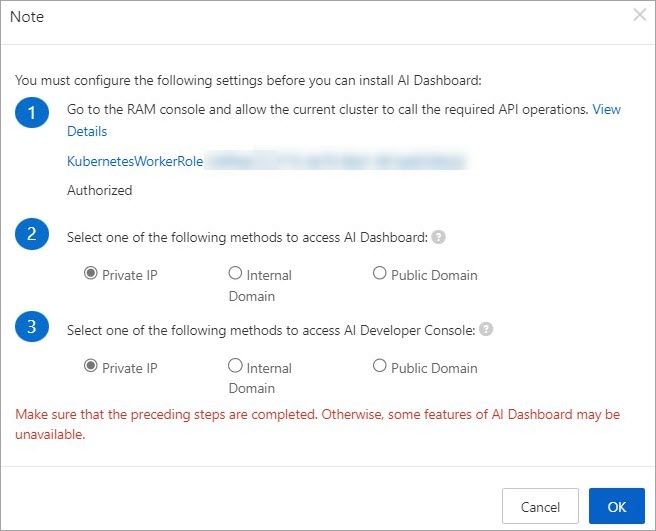
-
-
Set Console Data Storage: Pre-installed MySQL for testing or ApsaraDB RDS for production. See Install and configure AI Dashboard and AI Developer Console.
-
Click Deploy Cloud-native AI Suite. AI Dashboard is ready when its status shows Ready.
(Optional) Create and accelerate a dataset
Mount datasets from Object Storage Service (OSS) as persistent volumes (PVs) and accelerate access in AI Dashboard.
Create a PV and PVC
-
Create a namespace:
kubectl create ns demo-ns -
Create a file named
fashion-mnist.yaml:Placeholder Description Example fashion-mnistOSS bucket name my-dataset-bucket oss-cn-beijing.aliyuncs.comOSS endpoint for the bucket's region oss-cn-hangzhou.aliyuncs.com AKIDAccessKey ID LTAI5tXxx AKSECRETAccessKey secret xXxXxXx apiVersion: v1 kind: PersistentVolume metadata: name: fashion-demo-pv spec: accessModes: - ReadWriteMany capacity: storage: 10Gi csi: driver: ossplugin.csi.alibabacloud.com volumeAttributes: bucket: fashion-mnist otherOpts: "-o max_stat_cache_size=0 -o allow_other" url: oss-cn-beijing.aliyuncs.com akId: "AKID" akSecret: "AKSECRET" volumeHandle: fashion-demo-pv persistentVolumeReclaimPolicy: Retain storageClassName: oss volumeMode: Filesystem --- apiVersion: v1 kind: PersistentVolumeClaim metadata: name: fashion-demo-pvc namespace: demo-ns spec: accessModes: - ReadWriteMany resources: requests: storage: 10Gi selector: matchLabels: alicloud-pvname: fashion-demo-pv storageClassName: oss volumeMode: Filesystem volumeName: fashion-demo-pvReplace these placeholders:
-
Apply the manifest:
kubectl create -f fashion-mnist.yaml -
Verify the PV and PVC are bound:
kubectl get pv fashion-demo-pv
kubectl get pvc fashion-demo-pvc -n demo-ns
Expected output for the PV:
NAME              CAPACITY   ACCESS MODES   RECLAIM POLICY   STATUS   CLAIM                        STORAGECLASS   AGE
fashion-demo-pv   10Gi       RWX            Retain           Bound    demo-ns/fashion-demo-pvc     oss            8h
Expected output for the PVC:
NAME               STATUS   VOLUME            CAPACITY   ACCESS MODES   STORAGECLASS   AGE
fashion-demo-pvc   Bound    fashion-demo-pv   10Gi       RWX            oss            8h
Accelerate the dataset
-
Log in to AI Dashboard as an administrator.
-
Choose Dataset > Dataset List in the left navigation pane.
-
Find the dataset (
fashion-demo-pvc) and click Accelerate in the Actions column.The accelerated dataset is shown as a new record: the name is fashion-demo-pvc-acc, the namespace is demo-ns, the data source is
pvc://fashion-demo-pvc, the Accelerated column shows Yes, the status is NotReady, and the Actions column provides the Cancel Acceleration button.
Step 2: View resource dashboards
AI Dashboard provides four views, each covering a different aspect of GPU resource health.
The AI Console whitelist restriction applies here. Non-whitelisted users can access dashboards through the Open-source AI Console.
Cluster dashboard
AI Dashboard opens the cluster dashboard by default, showing cluster-wide GPU health and allocation.
| Metric | What it shows |
|---|---|
| GPU Summary Of Cluster | Total GPU nodes, allocated GPU nodes, unhealthy GPU nodes |
| Total GPU Nodes | Total GPU-accelerated nodes |
| Unhealthy GPU Nodes | GPU nodes with detected issues |
| GPU Memory (Used/Total) | GPU memory in use / total GPU memory |
| GPU Memory (Allocated/Total) | Allocated / total GPU memory |
| GPU Utilization | Cluster-wide average GPU utilization |
| GPUs (Allocated/Total) | Allocated / total GPUs |
| Training Job Summary Of Cluster | Training jobs by status: Running, Pending, Succeeded, Failed |
GPU Utilization shows whether the GPU ran any work during the sample window, not how efficiently. A node at 100% may run lightweight kernels rather than heavy parallel workloads. Pair with GPU Memory (Used/Total) for a fuller picture.
Node dashboard
Click Nodes in the upper-right corner of the Cluster page to view GPU metrics per node and per GPU device.
| Metric | What it shows |
|---|---|
| GPU Node Details | Per-node table: name, IP, role, GPU mode (exclusive or shared), GPU count, total GPU memory, allocated GPUs, allocated GPU memory, used GPU memory, average GPU utilization |
| GPU Duty Cycle | Utilization per GPU device per node |
| GPU Memory Usage | Memory used per GPU device per node |
| GPU Memory Usage Percentage | Memory usage percentage per GPU per node |
| Allocated GPUs Per Node | Allocated GPUs per node |
| GPU Number Per Node | Total GPUs per node |
| Total GPU Memory Per Node | Total GPU memory per node |
Training job dashboard
Click TrainingJobs in the upper-right corner of the Nodes page to view resource consumption and GPU efficiency per job.
| Metric | What it shows |
|---|---|
| Training Jobs | Per-job table: namespace, name, type, status, duration, requested GPUs, requested GPU memory, used GPU memory, average GPU utilization |
| Job Instance Used GPU Memory | GPU memory used per job instance |
| Job Instance Used GPU Memory Percentage | Percentage of GPU memory used per job instance |
| Job Instance GPU Duty Cycle | GPU utilization per job instance |
Resource quota dashboard
Click Quota in the upper-right corner of the Training Jobs page to view quota consumption by resource type (CPU, memory, nvidia.com/gpu, aliyun.com/gpu-mem, aliyun.com/gpu).
| Column | What it shows |
|---|---|
| Elastic Quota Name | Quota group name |
| Namespace | Namespace the quota applies to |
| Resource Name | Resource type |
| Max Quota | Maximum available resources |
| Min Quota | Guaranteed minimum, honored under cluster pressure |
| Used Quota | Currently used resources |
Step 3: Manage users and quotas
The Cloud-native AI Suite uses a quota tree to enforce hierarchical resource limits and share resources across teams.
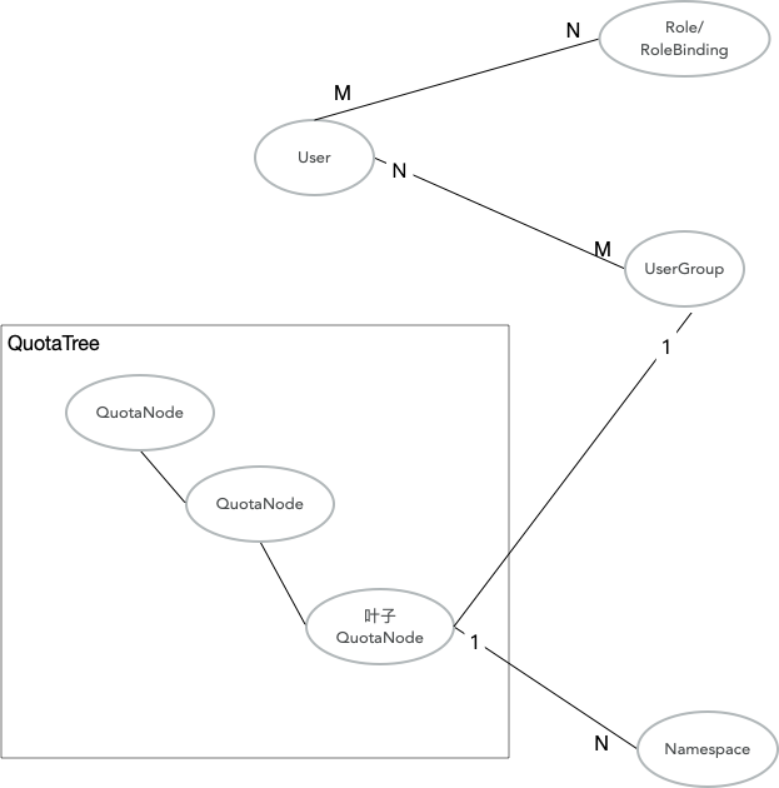
The organizational structure maps to the quota tree:
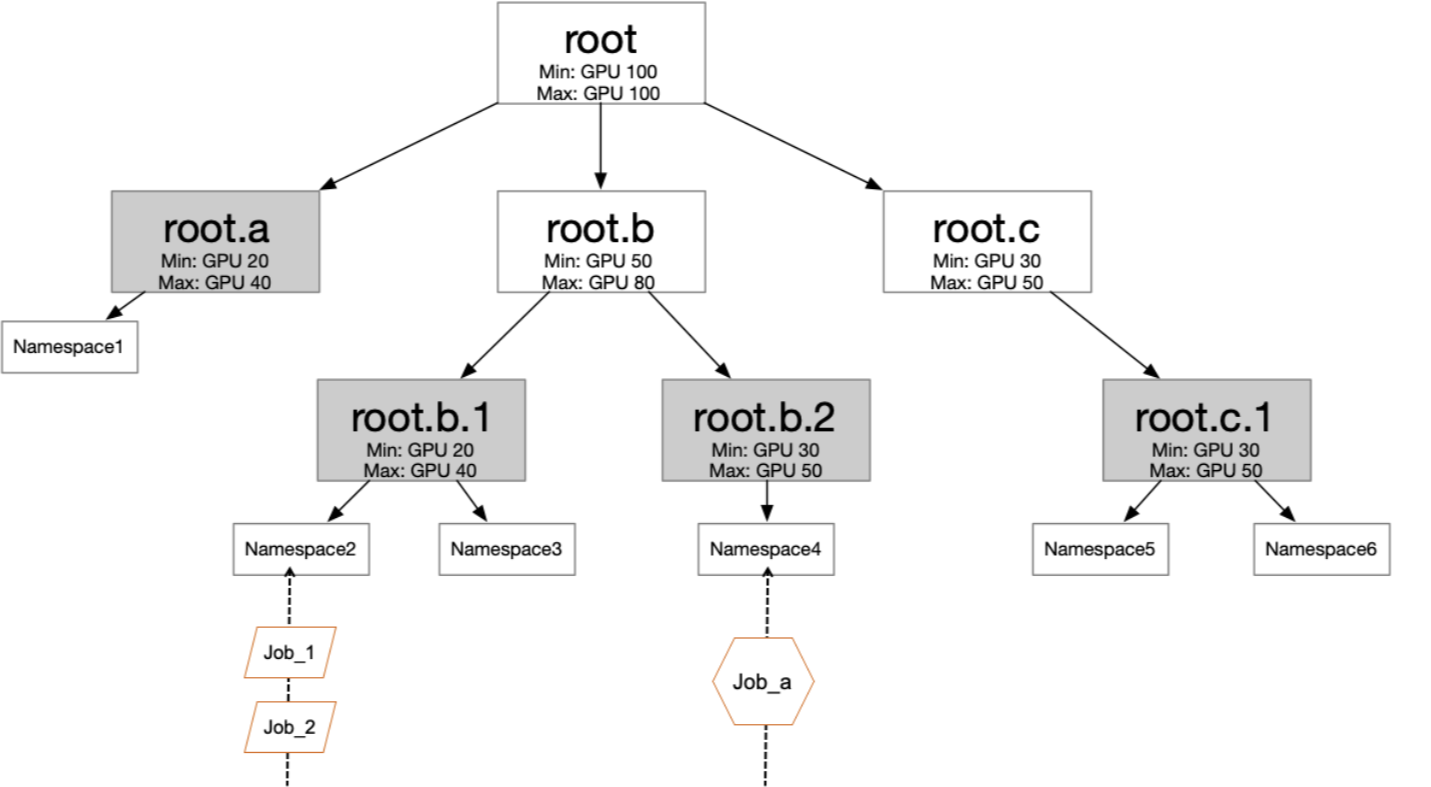
Each department or team maps to a quota tree branch; leaf nodes bind to namespaces. Setting Min and Max at each level lets teams share idle resources while guaranteeing minimum allocations.
Quota trees and namespace-level controls provide organizational guardrails, not hard security boundaries. For strong tenant isolation, use separate clusters. See the security boundary note in Key concepts.
Set up a quota tree
-
Create namespaces for each team. Existing namespaces must have no running pods before association with a quota node.
kubectl create ns namespace1 kubectl create ns namespace2 kubectl create ns namespace3 kubectl create ns namespace4 -
In AI Dashboard, create quota nodes and associate each leaf node with a namespace. Set Min and Max for each node.
Create users and user groups
A user can belong to multiple groups, and a group can contain multiple users. Associate users with groups to grant access to allocated resources.
-
Create a user. See Generate the kubeconfig file and logon token for a new user.
-
Create a user group. See Add a user group.
Capacity scheduling example
This example shows how the scheduler shares and reclaims CPU resources across four namespaces. The quota tree has this structure:
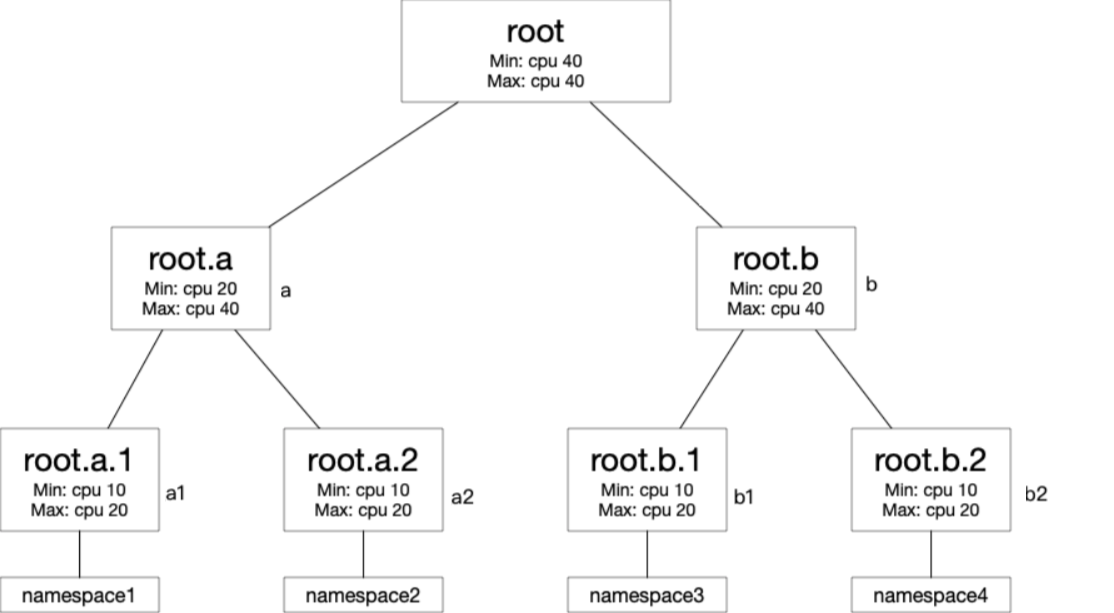
Quota configuration:
| Quota node | Min (CPU cores) | Max (CPU cores) |
|---|---|---|
| root | 40 | 40 |
| root.a | 20 | 40 |
| root.b | 20 | 40 |
| root.a.1 | 10 | 20 |
| root.a.2 | 10 | 20 |
| root.b.1 | 10 | 20 |
| root.b.2 | 10 | 20 |
Walk-through:
Without elastic quotas, each leaf namespace uses only its Min (10 cores = 2 pods at 5 cores/pod). With elastic quotas and 40 cluster cores available, namespaces borrow idle capacity up to their Max.
Step 1: Deploy five pods to namespace1, each requesting 5 CPU cores (25 cores total).
With root.a.1 Max set to 20 cores, 4 pods run (20 cores). The fifth pod stays Pending.
apiVersion: apps/v1
kind: Deployment
metadata:
  name: nginx1
  namespace: namespace1
  labels:
    app: nginx1
spec:
  replicas: 5
  selector:
    matchLabels:
      app: nginx1
  template:
    metadata:
      name: nginx1
      labels:
        app: nginx1
    spec:
      containers:
      - name: nginx1
        image: nginx
        resources:
          limits:
            cpu: 5
          requests:
            cpu: 5
Step 2: Deploy five pods to namespace2, each requesting 5 CPU cores.
With 20 cores remaining (40 - 20 from namespace1), 4 pods run. The fifth stays Pending. Both namespace1 and namespace2 now consume all 40 root cores.
apiVersion: apps/v1
kind: Deployment
metadata:
  name: nginx2
  namespace: namespace2
  labels:
    app: nginx2
spec:
  replicas: 5
  selector:
    matchLabels:
      app: nginx2
  template:
    metadata:
      name: nginx2
      labels:
        app: nginx2
    spec:
      containers:
      - name: nginx2
        image: nginx
        resources:
          limits:
            cpu: 5
          requests:
            cpu: 5
Step 3: Deploy five pods to namespace3, each requesting 5 CPU cores.
No idle capacity remains. The scheduler reclaims 10 cores from root.a to guarantee root.b.1's minimum. It reclaims 5 cores from root.a.1 (reducing namespace1 from 4 running pods to 3) and 5 cores from root.a.2 (reducing namespace2 from 4 running pods to 3). With 10 reclaimed cores, 2 pods run in namespace3.
apiVersion: apps/v1
kind: Deployment
metadata:
  name: nginx3
  namespace: namespace3
  labels:
    app: nginx3
spec:
  replicas: 5
  selector:
    matchLabels:
      app: nginx3
  template:
    metadata:
      name: nginx3
      labels:
        app: nginx3
    spec:
      containers:
      - name: nginx3
        image: nginx
        resources:
          limits:
            cpu: 5
          requests:
            cpu: 5
Step 4: Deploy five pods to namespace4, each requesting 5 CPU cores.
The scheduler reclaims another 10 cores from root.a to guarantee root.b.2's minimum: 5 cores from root.a.1 and 5 from root.a.2. After reclamation, namespace1 and namespace2 each have 2 running pods (10 cores), and namespace4 gets 2 running pods.
apiVersion: apps/v1
kind: Deployment
metadata:
  name: nginx4
  namespace: namespace4
  labels:
    app: nginx4
spec:
  replicas: 5
  selector:
    matchLabels:
      app: nginx4
  template:
    metadata:
      name: nginx4
      labels:
        app: nginx4
    spec:
      containers:
      - name: nginx4
        image: nginx
        resources:
          limits:
            cpu: 5
          requests:
            cpu: 5
Result:
| Namespace | Quota node | Running pods | CPU cores in use |
|---|---|---|---|
| namespace1 | root.a.1 | 2 | 10 |
| namespace2 | root.a.2 | 2 | 10 |
| namespace3 | root.b.1 | 2 | 10 |
| namespace4 | root.b.2 | 2 | 10 |
Each team's minimum guarantee was honored. Borrowed capacity was reclaimed when other teams needed their minimums back.