ACK clusters integrate with Managed Service for Prometheus to provide a visualized colocation monitoring dashboard. After you enable dynamic resource overcommitment, use this dashboard to track colocated resource availability, allocation ratios, and per-node or per-pod utilization — giving you the data needed to evaluate colocation efficiency and expand workload deployment in colocation scenarios.
Prerequisites
Before you begin, ensure that you have:
-
ack-koordinator installed, version v1.1.1-ack.1 or later. For more information, see ack-koordinator (FKA ack-slo-manager)
-
Dynamic resource overcommitment enabled. For more information, see Enable dynamic resource overcommitment
Open the dashboard
-
Log on to the ACK console. In the left navigation pane, click ACK consoleACK consoleClusters.
-
On the Clusters page, find the cluster and click its name. In the left navigation pane, choose Operations > Prometheus Monitoring.
-
On the Prometheus Monitoring page, click the Others > Kubernetes Reclaimed Resource tab.
Dashboard overview
The colocation monitoring dashboard has two sections:
-
Resource benefits: panels showing resource benefit statistics in colocation scenarios.
-
Observability: resource and workload details across cluster, node pool, node, and pod dimensions.
Dashboards are periodically updated. Refer to the actual interface as the standard.
Key concepts
Two resource types appear throughout the dashboard:
| Resource type | Description |
|---|---|
| Non-colocated resources | All allocatable physical resources on the node. Fixed by the node specification and does not change after you enable colocation. |
| Colocated resources | Idle physical resources identified by dynamic resource overcommitment. Changes dynamically based on node utilization. These are the schedulable resources used in colocation scenarios and the primary metric for evaluating resource benefits. |
Resource benefits overview
Total and allocated colocated resources
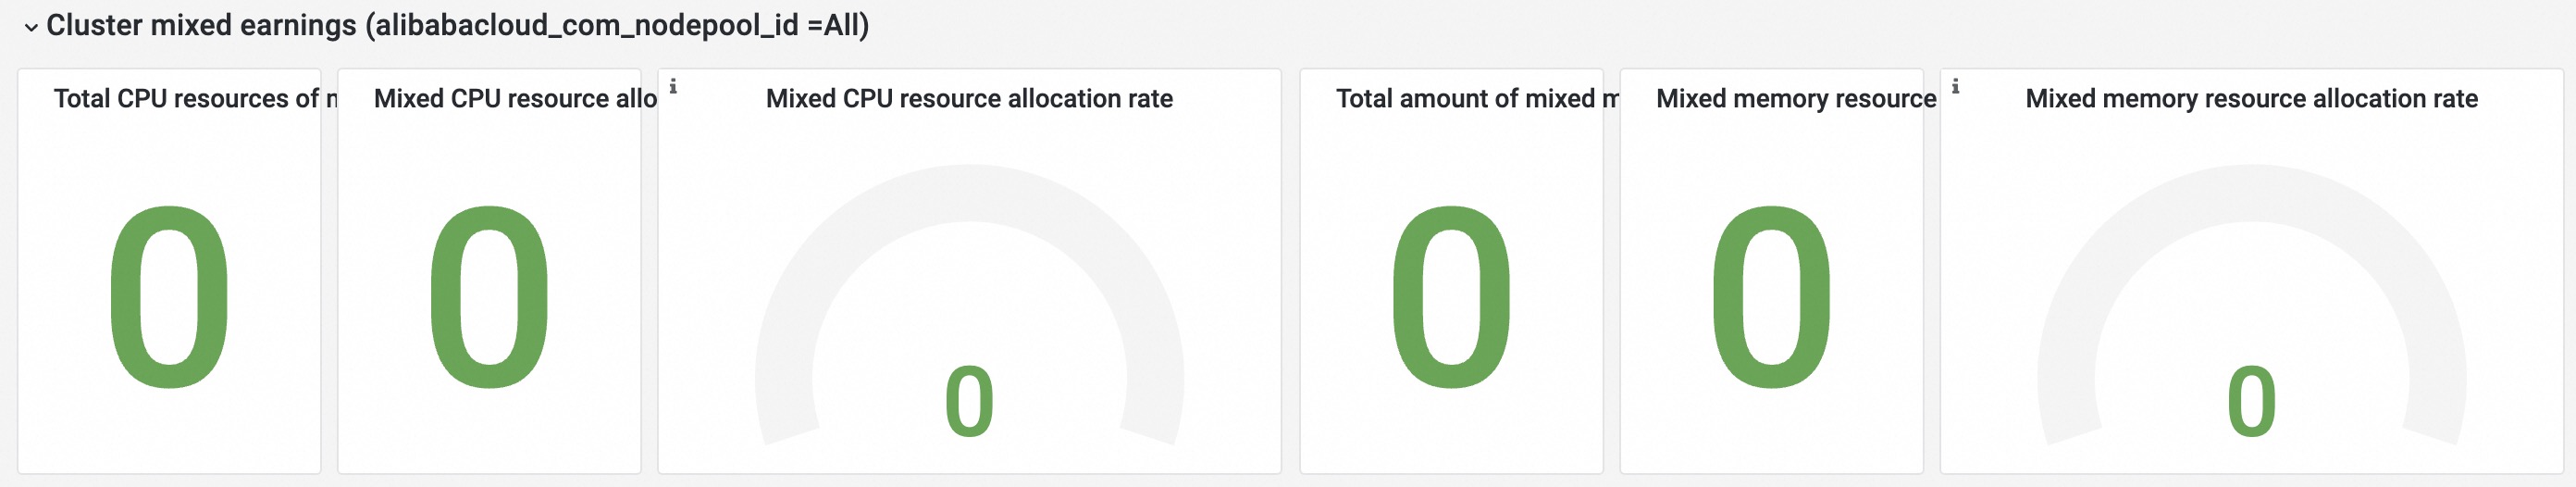
| Metric | Description |
|---|---|
| Total amount of colocated resources | vCPUs and memory available for colocation in the cluster. In the example above, the cluster has 118 vCPUs and 487 GiB of memory available for LS and BE workloads. A higher total indicates more idle resources schedulable in colocation scenarios. |
| Total amount of allocated colocated resources | vCPUs and memory already allocated for colocation. In the example above, 2 vCPUs and 1 GiB of memory are allocated. A higher allocated amount means more applications are deployed in colocation scenarios. |
| Ratio of allocated colocated resources | Calculated separately for vCPUs and memory: Ratio = Amount of allocated resources / Total amount of resources. In the example above, the vCPU allocation ratio is 1.70% and the memory allocation ratio is 0.21%. A higher ratio indicates greater utilization in colocation scenarios. |
Usage trend of colocated resources
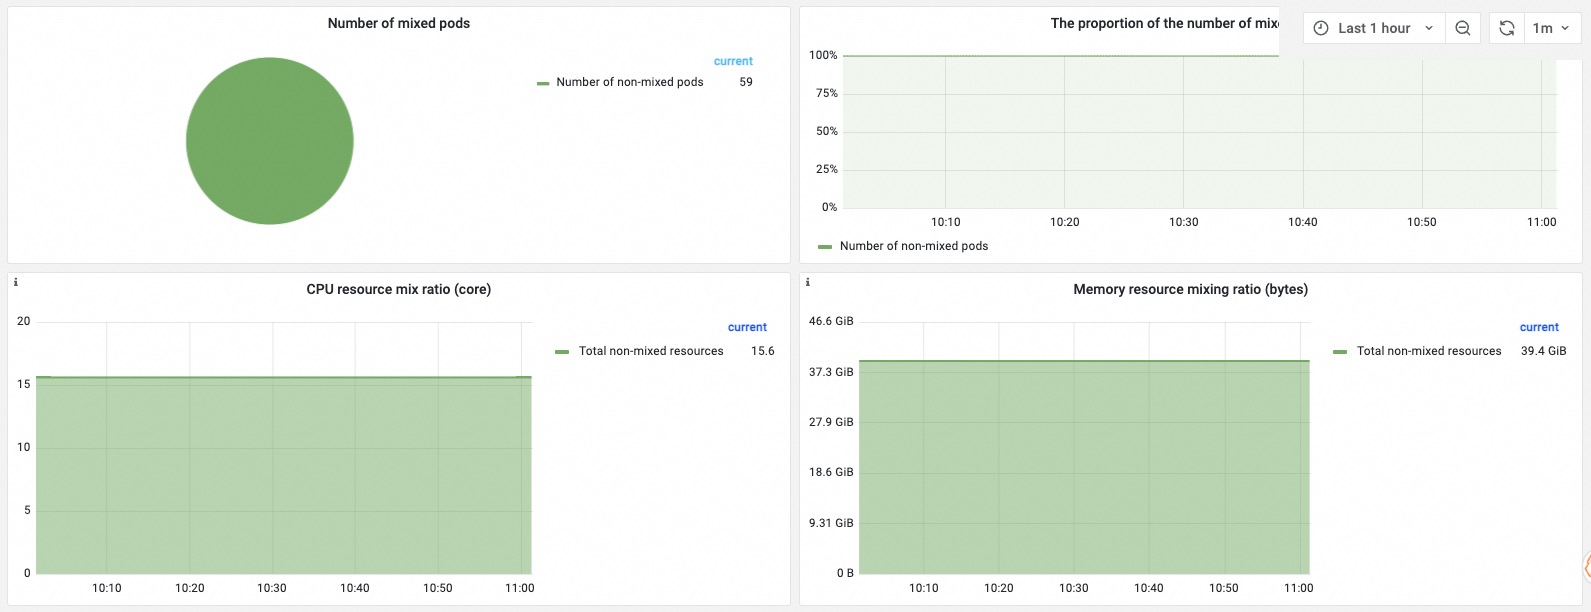
| Metric | Description |
|---|---|
| Number of colocated pods | Total pods in the cluster, broken down by pods using non-colocated resources and pods using colocated resources, with the ratio of each group displayed. |
| Ratio of colocated resources | The ratio of vCPUs and memory allocated for colocation versus non-colocation. A high ratio with large idle resources indicates that more workloads can be scheduled in colocation scenarios. |
Colocated resources overview
The Cluster Dimension, Node Dimension, and Pod Dimension sections show resource usage and requests at different granularities.
Cluster dimension
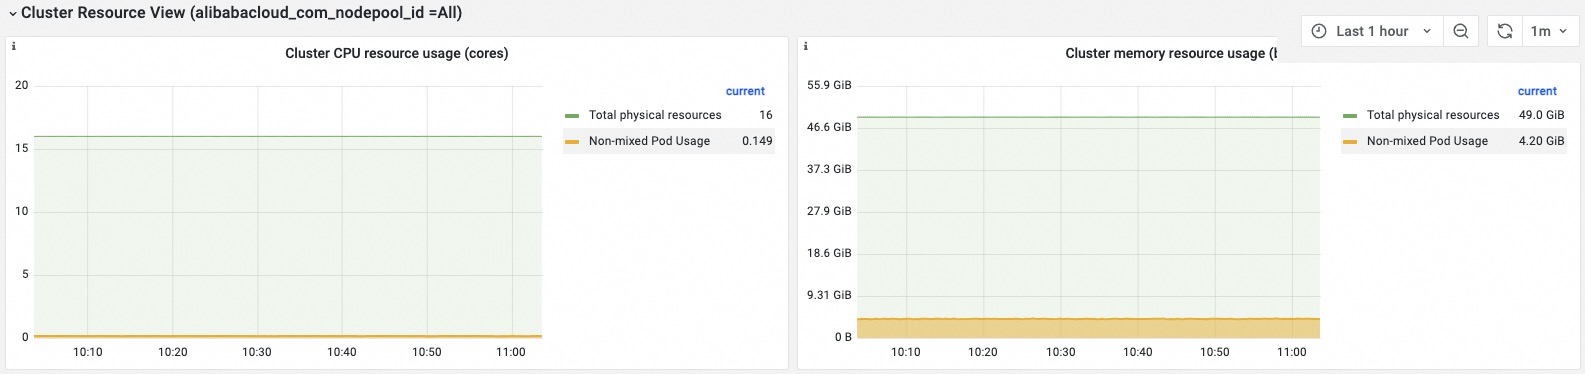
| Metric | Description |
|---|---|
| Resource usage in the cluster | CPU and memory consumed by non-colocated pods, colocated pods, and system components, compared against total cluster capacity. If combined usage is well below total capacity, significant CPU or memory resources remain idle. |
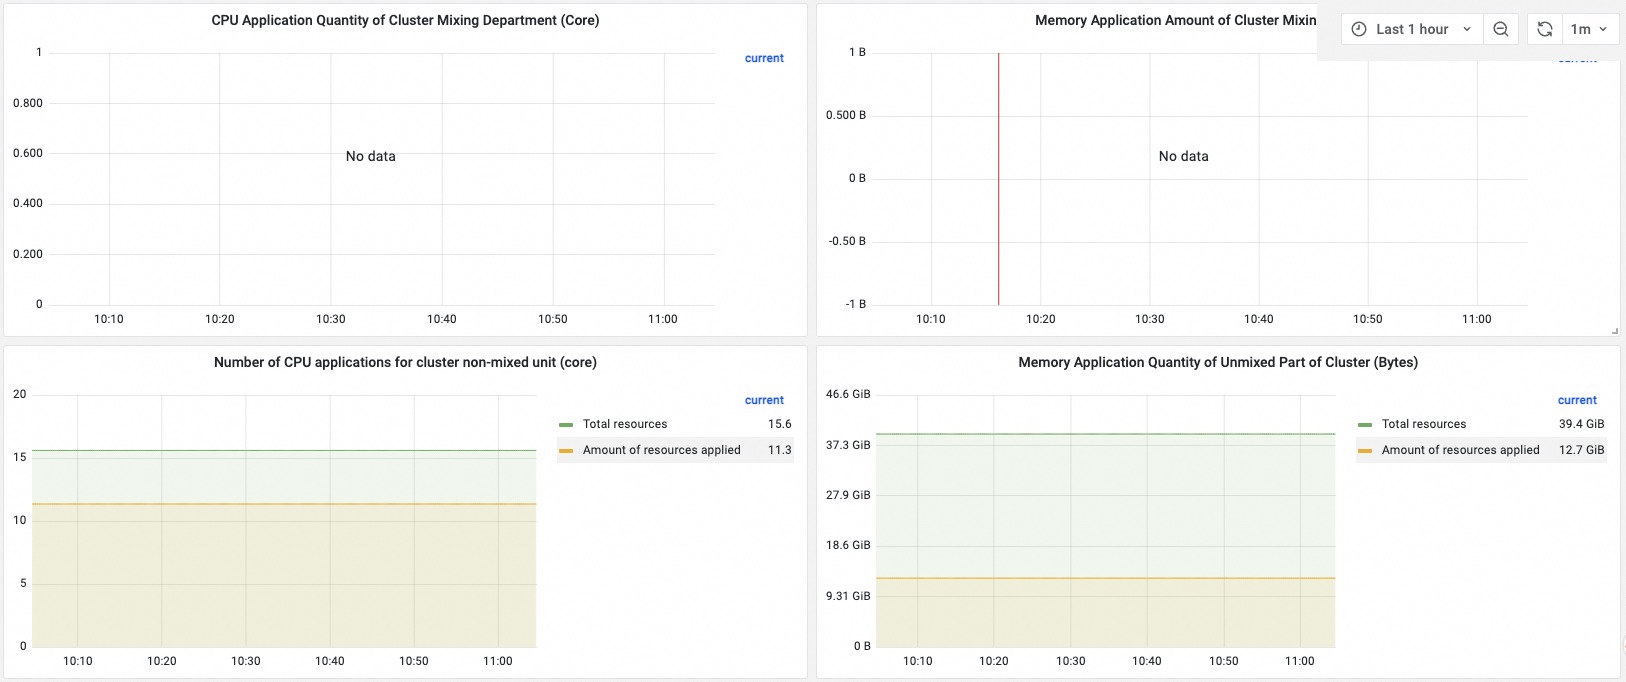
| Requests for colocated resources in the cluster | Total allocatable vCPUs and memory for colocation versus the amount already requested. If requested resources approach the total allocatable amount, the allocation ratio is high. |
| Requests for non-colocated resources in the cluster | Total allocatable vCPUs and memory for non-colocation scenarios versus the amount already requested. |
Node dimension
Configure the node_label and node_label_value parameters at the top of the Kubernetes Reclaimed Resource tab to filter data by node.

| Filter | Description |
|---|---|
| node_label_value | Default: All — the Resource benefits overview and Cluster dimension sections show statistics for all cluster nodes. Select a node pool ID from the drop-down list to scope the view to a specific node pool. |
| node_label | Specify a node label to select a node. See the Notes section at the top of the page for details. |
| Metric | Description |
|---|---|
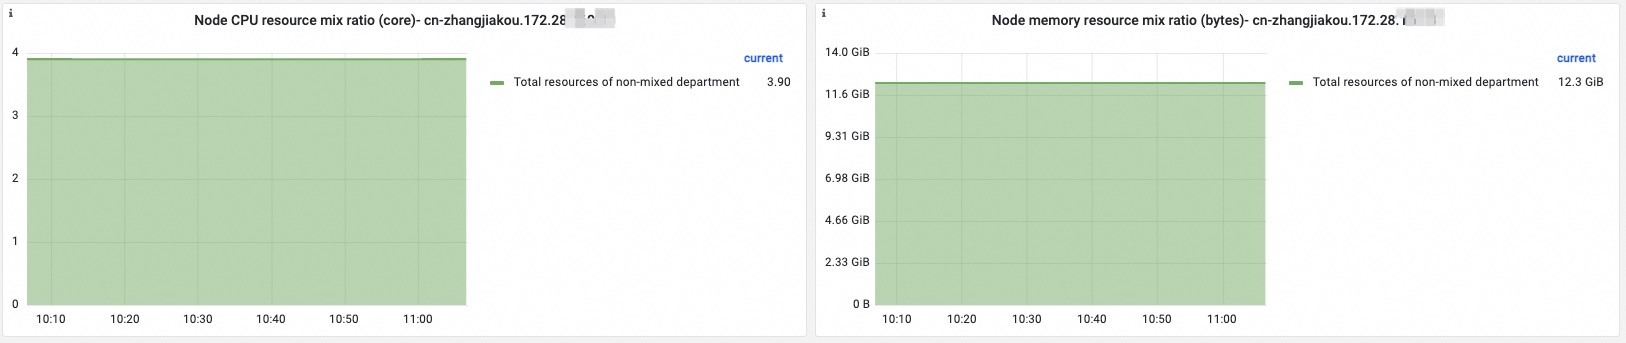
| Ratio of colocated resources on the node | Ratios of vCPUs and memory for colocation and non-colocation, stacked for comparison. |
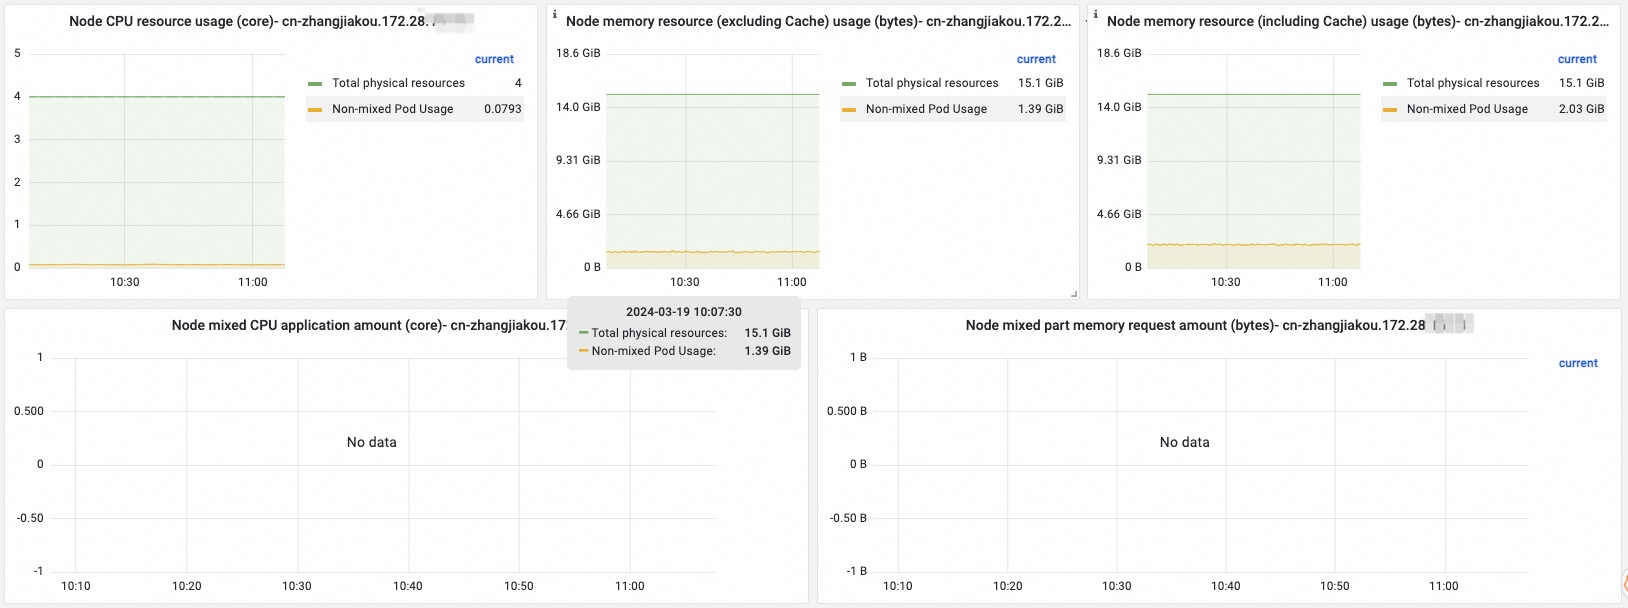
| Resource usage on the node | CPU usage, memory usage (including cache), and memory usage (excluding cache) — broken down by non-colocated pods, colocated pods, and system components, compared against node capacity. |
| Requested colocated resources on the node | Total and requested vCPUs and memory for colocation on the node. If requested resources approach the total, the allocation ratio is high. |
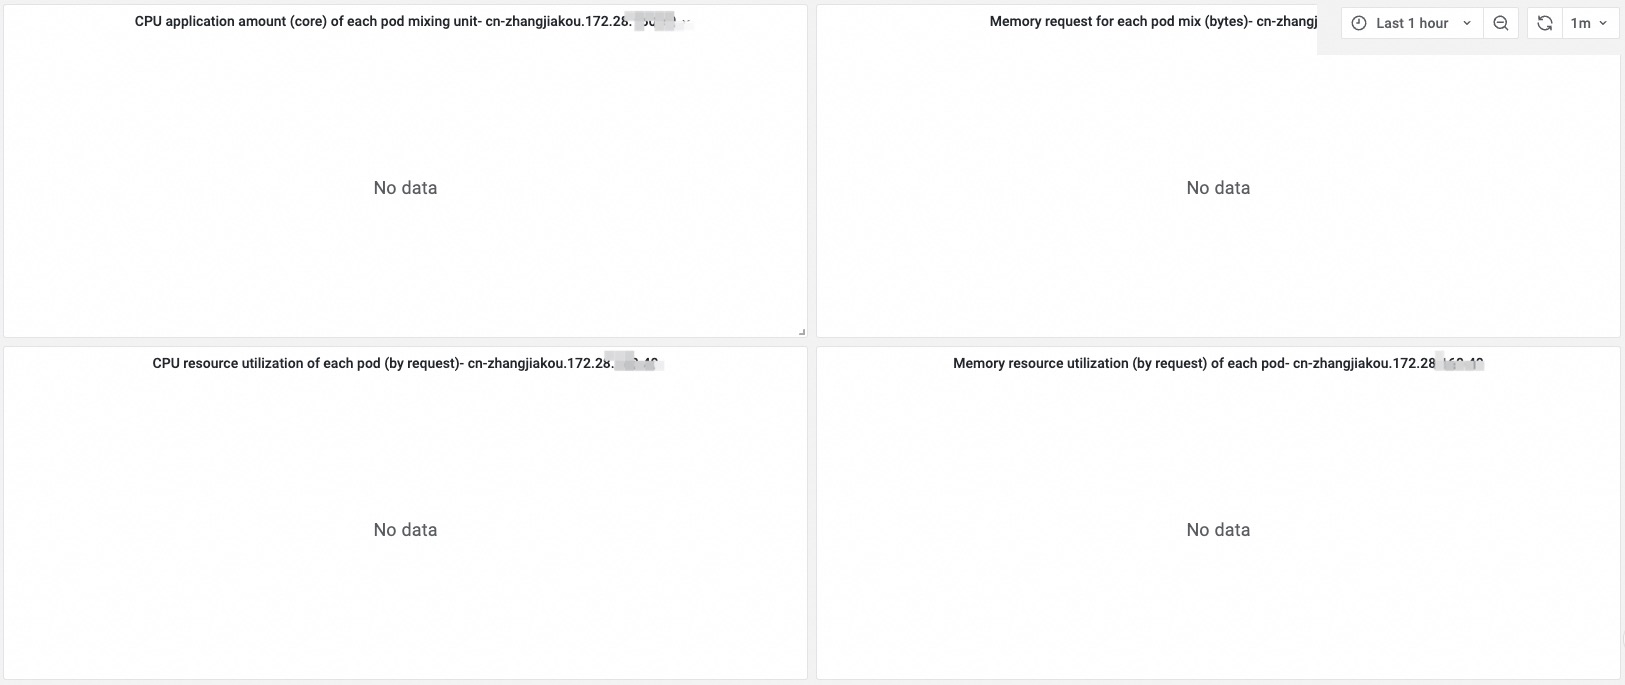
| Requests for colocated resources by each pod | vCPUs and memory requested for colocation by each pod on the node. |
| Colocated resource utilization of each pod | vCPU and memory utilization for colocation of each pod on the node. |
Pod dimension
On the k8s-reclaimed-resource tab, set pod_namespace and pod_name to view per-pod panels.
| Metric | Description |
|---|---|
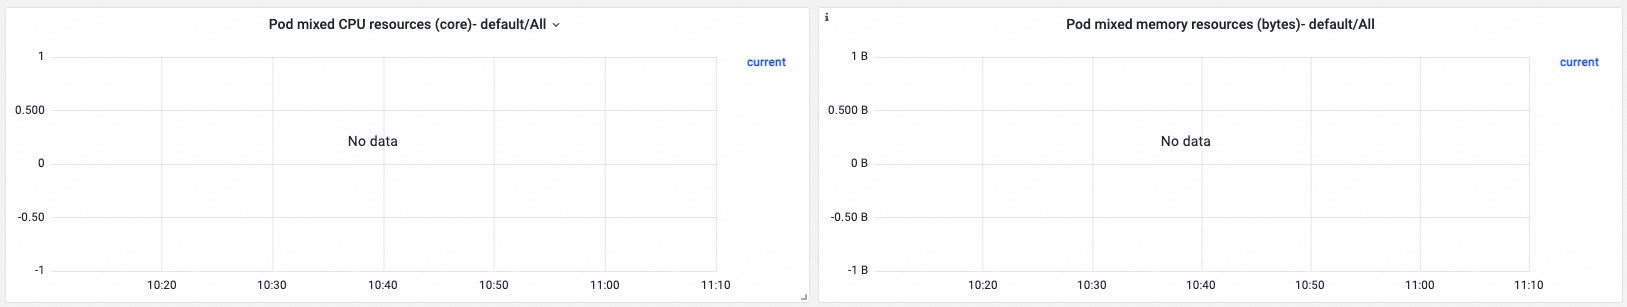
| Amount of colocated resources used by the pod | CPU and memory for colocation used by the pod, including limits, requests, and actual usage. |
| Colocated resource utilization of the pod | vCPU and memory utilization for colocation of the pod on the node. |
| Amount of colocated resources used by each container | CPU and memory for colocation used by each container in the pod, including limits, requests, and actual usage. |
FAQ
No data appears in the Resource benefits overview section
Symptom: The Resource benefits overview section on the Kubernetes Reclaimed Resource tab shows no data.
Most likely cause: ack-koordinator is not installed, or is not reporting metrics to Prometheus.
Step 1: Verify ack-koordinator is installed
-
Log on to the ACK console. In the left navigation pane, click Clusters.
-
On the Clusters page, find the cluster and click its name. In the left navigation pane, click Add-ons.
-
On the Add-ons page, check whether ack-koordinator is listed as installed.
-
If not installed, install it as prompted.
-
If installed, proceed to Step 2.
If your ack-koordinator version is earlier than 0.7, it was installed from the Marketplace page. Migrate it to the Add-ons page before proceeding. For details, see Migrate ack-koordinator from the Marketplace page to the Add-ons page.
-
Step 2: Check whether Prometheus is receiving metrics
-
Log on to the ARMS console.ARMS console
-
In the left navigation pane, choose Managed Service for Prometheus > Instances.
-
In the upper-left corner, select the region where your Prometheus instance is deployed, then click the instance. In the left navigation pane, click Metric Management.
-
On the Index exploration tab, click Metrics Explore, search for
kube_node_labels, and view the data details of the metric as prompted.