Flat Map with 3D Effects is a container that holds a flat map with 3D effects. You can add layers such as scatter layers, flying routes layers, and columns layers to this container, which enables you to show real-time data across the globe from multiple perspectives and in diverse forms.
Settings
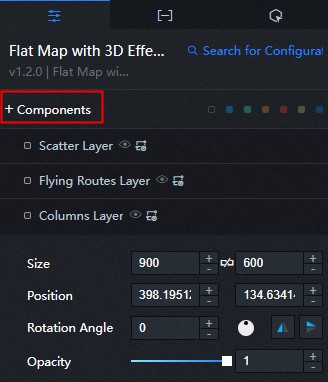
- Components
- Add Component: Click the + button next to Components, select a child widget, and then click Add Component. The added child widget is displayed in Components.
- Copy, Rename, or Delete a Components: Move the mouse over the added child widget and click
 next to the child widget name to copy the child widget. Click
  to edit the name of the child widget. Click
  to delete the child widget.
- Add Component: Click the + button next to Components, select a child widget, and then click Add Component. The added child widget is displayed in Components.
- Search for Configurations: In the right-side panel of Canvas Editor, click the Settings tab, and click Search for Configurations in the upper-right corner. Enter the required configuration item in the search box, and click the search icon to quickly locate the configuration item. Fuzzy match is supported. For more information, see Search for widget configuration items.
- Global Options
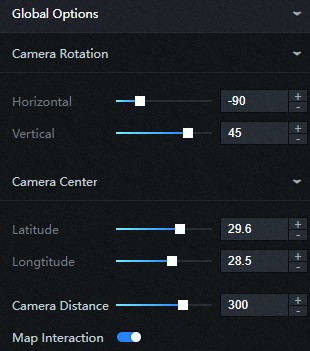
- Camera Rotation
- Horizontal: Drag the slider or enter a value to rotate the camera horizontally. The range of the value is -180 to 180.
- Vertical: Drag the slider or enter a value to rotate the camera vertically. The range of the value is -90 to 90.
- Camera Center
- Latitude: Drag the slider or enter a value to set the latitude of the camera. The range of the value is -90 to90.
- Longitude: Drag the slider or enter a value to set the longitude of the camera. The range of the value is -180 to 180.
- Camera Distance: Drag the slider or enter a value to set the focal length of the camera. The range of the value is 18–420.
- Map Interaction: Select the check box to enable the map interaction feature. With this feature, you can create interaction events in the preview page or the published page. For example, you can create an event that is triggered by clicking. Clear the check box to disable the map interaction feature.
- Camera Rotation
- Fill Options
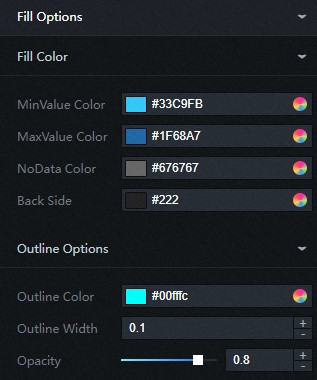
- Fill Color
- MinValue Color: You can modify the minimum value for the color. For more information, see Color Picker.
- MaxValue Color: You can modify the maximum value for the color. For more information, see Color Picker.
Note Different countries/regions are rendered with different colors based on the value field in the data tab.
- NoData Color: You can modify the color of the countries/regions whose value fields are not specified in the data tab. For more information, see Color Picker.
- Back Side: You can modify the color of the back of the map. For more information, see Color Picker. You can view the back of the map by rotating the camera. For example, see the second figure that follows.
- Outline Options
- Outline Color: You can modify the color of the outlines on the map. For more information, see Color Picker.
- Outline Width: Click + or - or enter a value to modify the width of the outlines on the map.
- Opacity: Drag the slider or enter a value to set the opacity of the outlines on the map. The range of the value is 0–1.
- Fill Color
Data
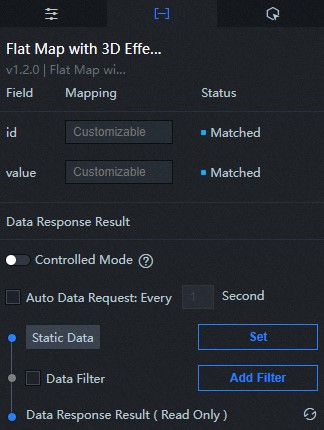
Two fields can be configured by default in the data tab of the map container.
- id: The abbreviation of the country/region on the map.
- value: The value of the country/region. The color of a country/region is determined by both the value field and the configurations in the style tab.
- name (optional): The full name of the country/region.
Interaction
This widget is not bound to any events.
Configure interactions in Blueprint Editor
- In Canvas Editor, right-click a widget in the Layer panel and select Add to Blueprint Editor.
- Click the
 icon in the upper-left corner of the page.
- On the Blueprint Editor page, click the Flat Map with 3D Effects component in the Import Node section. On the canvas, you can view the parameters
of the blueprint editor as shown in the following figure.
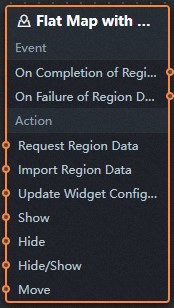
- Event
Event Description On Completion of Region Data Request The event is triggered with the processed JSON data after a data interface request is responded and processed by a filter. For more information about specific data examples, see the Data Response Result section on the Data tab of the canvas editor. On Failure of Region Data Request When a data interface request fails (the request may be caused by network problems or interface errors, etc.), the event is returned and processed by the filter, and the processed JSON-formatted data is also thrown. For more information about specific data examples, see the Data Response Result section on the Data tab of the canvas editor. - Action
Action Description Request Region Data This action is performed to request the server data again. The data sent by an upstream data processing node or layer node is used as a parameter. For example, if the Flat Map with 3D Effects is configured with the API data source as http://api.testand the data passed to the Request Region Data action is{ id: '1'}, the final request interface ishttp://api.test?id=1.Import Region Data After data of a widget is processed in accordance with its drawing format, the widget is imported for redrawing. You do not need to request server data again. For more information about specific data examples, see the Data Response Result section on the Data tab of the canvas editor. Update Widget Configurations Style configurations of widgets are dynamically updated. Before this action is executed, you must click the widget in Canvas Editor, click the Settings tab in the right-side panel, and click Copy Configurations to... to obtain widget configurations. After that, change the style field for the data processing node in Blueprint Editor. Show A widget is shown without the need to specify parameters. Hide A widget is hidden without the need to specify parameters. Hide/Show A widget is hidden or shown. Move A widget is moved to a specified location. The following example shows the reference data. { // The positioning type. to indicates absolute positioning, whereas by indicates relative positioning. The default value is to. "positionType": "to", // The location, which is indicated by the x and y coordinates. "attr": { "x": 0, "y": 0 }, // The animation type. "animation": { "enable": false, // The duration in which animation is displayed. "animationDuration": 1000, // The animation curve, which can be set to linear|easeInOutQuad|easeInOutExpo. "animationEasing": "linear" } }
- Event