You can set points on the map using the scatter layer. A point indicates the information of the specified geographic coordinates.
Settings
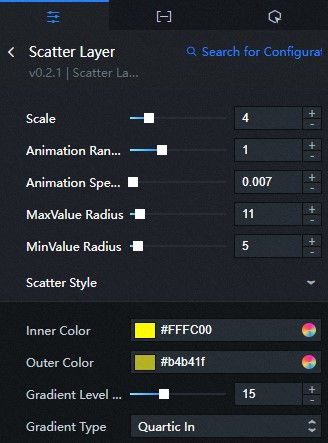
- Scale: Drag the slider or enter a value to set the distance from the scatter layer to the flat map. The range of the value is 0-20.
- Animation Range: Drag the slider or enter a value to set the animation range of the points. The animation range is affected by the radius of the point. The range of the value is 0-3.
- Animation Speed: Drag the slider or enter a value to set the animation speed. The range of the value is 0-0.2.
- MaxValue Radius: Drag the slider or enter a value to set the maximum radius of the points. The radius of a point is determined by both the value field in the data tab and the configurations in the style tab. The range of the value is 1-100.
- MinValue Radius: Drag the slider or enter a value to set the minimum radius of the points. The radius of a point is determined by both the value field in the data tab and the configurations in the style tab. The range of the value is 1-50.
- Scatter Style
- Inner Color: You can modify the inner color of the points. For more information, see Color Picker.
- Outer Color: You can modify the outer color of the points. For more information, see Color Picker.
- Gradient Level Count: Drag the slider or enter a value to set the number of levels in the gradient. The animation becomes smoother if you increase the number of levels. The range of the value is 1-40.
- Gradient Type: Select a gradient type from the drop-down list.
- Linear None
- Quartic InOut
- Quartic Out
- Quartic In
Data
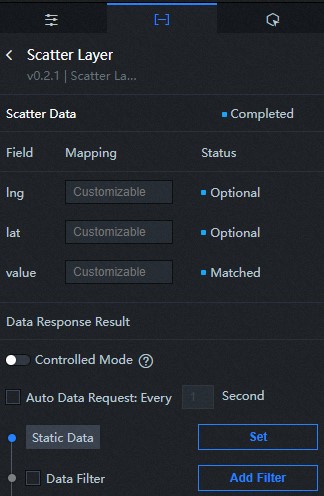
- lng: The longitude of the point.
- lat: The latitude of the point.
- value: The value of the point. The size of a point is determined by both the value field and the configurations in the style tab.
Interaction
This widget is not bound to any events.
Configure interactions in Blueprint Editor
- On the Canvas Editor page, click the
 icon to the right of Scatter Layer in the Flat Map with 3D Effects Subcomponent Management List.
- Click the
 icon in the upper-left corner of the page.
- On the Blueprint Editor configuration page, click the Scatter Layer component in the Import Nodes section.
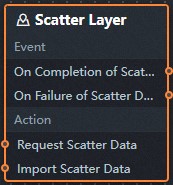
- Event
Event Description On Completion of Scatter Data Request The event is triggered with the processed JSON data after a data interface request is responded and processed by a filter. For more information about specific data examples, see the Data Response Result section on the Data tab of the canvas editor. On Failure of Scatter Data Request When a data interface request fails (the request may be caused by network problems or interface errors, etc.), the event is returned and processed by the filter, and the processed JSON-formatted data is also thrown. For more information about specific data examples, see the Data Response Result section on the Data tab of the canvas editor. - Action
Action Description Request Scatter Data This action is performed to request the server data again. The data sent by an upstream data processing node or layer node is used as a parameter. For example, if the Scatter Layer is configured with the API data source as
https://api.testand the data passed to the Request Scatter Data action is{ id: '1'}, the final request interface ishttps://api.test?id=1.Import Scatter Data After data of a widget is processed in accordance with its drawing format, the widget is imported for redrawing. You do not need to request server data again. For more information about specific data examples, see the Data Response Result section on the Data tab of the canvas editor.
- Event