ログ分析ページで、特定の時間範囲内のログの分布を表示できます。 分布は縦棒グラフで表示されます。 このトピックでは、特定の時間範囲内のログの分布を表示する方法について説明します。
手順
Security Centerコンソールにログイン。 上部のナビゲーションバーで、管理するアセットのリージョンを選択します。 中国および全世界 (中国を除く)のリージョンがサポートされています。
左側のナビゲーションウィンドウで、を選択します。
ログ分析 タブで、特定の時間範囲内のログの分布を表示します。

縦棒グラフには、指定されたクエリ時間範囲のログ分布とクエリされたログの総数が表示されます。 x軸は時間を表示します。 y軸には、照会されたログの数が表示されます。 次の操作を実行できます。
グラフの列をクリックすると、時間範囲が狭くなり、新しい時間範囲でクエリ結果が表示されます。
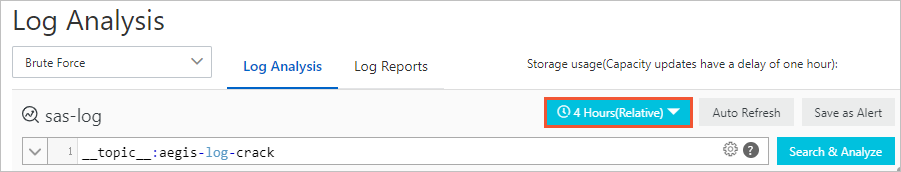
右上隅のタイムピッカーをクリックし、ログを照会する時間範囲を選択します。