This topic describes how to create a Logtail configuration in the Simple Log Service console to collect syslogs.
Implementation
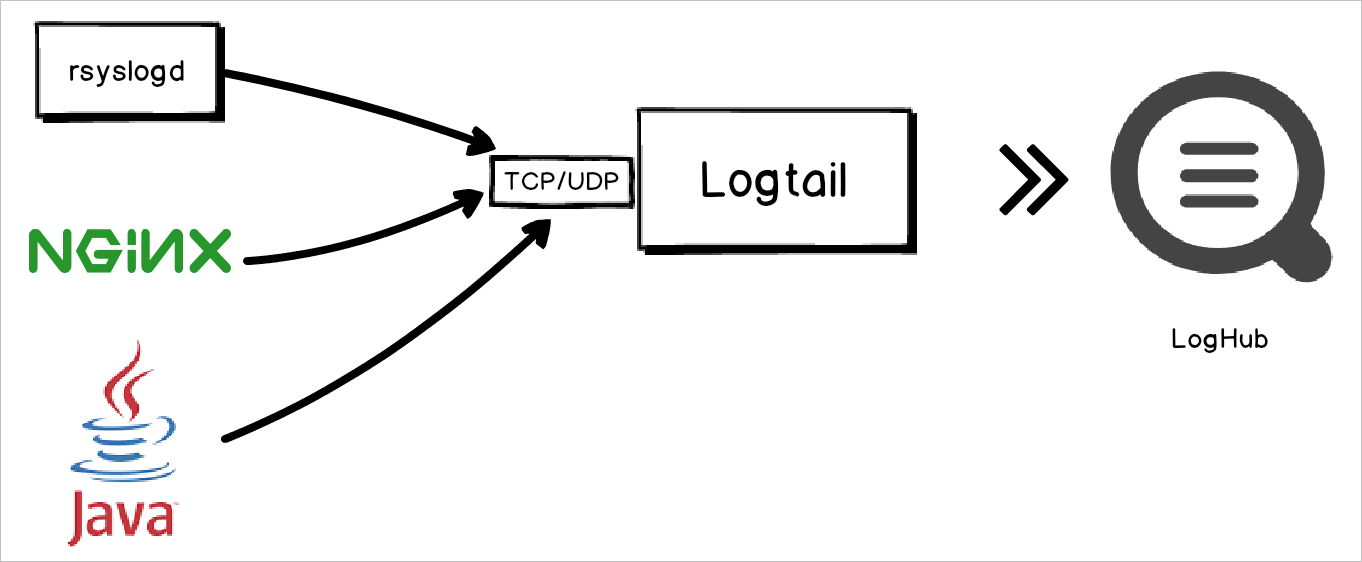
Linux servers allow you to use syslog agents such as rsyslog to forward on-premises syslogs to a server by using a specific IP address and port. Logtail listens to the IP address and port, receives the forwarded syslogs over TCP or UDP, parses the syslogs based on a specific syslog protocol, and then extracts fields such as facility, tag (program), severity, and content from the syslogs.
The syslog protocols defined in RFC 3164 and RFC 5424 are supported. For more information, see RFC3164 and RFC5424.
Prerequisites
A project and a Standard logstore are created. For more information, see Manage a project and Create a logstore.
A Linux operating system and the latest version of Logtail are installed. For more information about how to update Logtail, see Install Logtail on a Linux server.
Procedure
In this topic, syslogs are collected from an Elastic Compute Service (ECS) instance.
Log on to the Simple Log Service console.
Click Import Data, and select Custom Data Plug-in.

Select the project and Logstore. Then, click Next.
Create a machine group.
If a machine group is available, click Use Existing Machine Groups.
If no machine groups are available, perform the following steps to create a machine group. In this example, an Elastic Compute Service (ECS) instance is used.
On the ECS Instance tab, select Manually Select Instances. Then, select the ECS instance that you want to use and click Create.
For more information, see Install Logtail on ECS instances.
ImportantIf your server is an ECS instance that belongs to a different Alibaba Cloud account from Simple Log Service, a server in a data center, or a server from a third-party cloud service provider, you must manually install Logtail on the server. For more information, see Install Logtail on a Linux server or Install Logtail on a Windows server. After you manually install Logtail, you must configure a user identifier for the server. For more information, see Configure a user identifier.
After you confirm the settings, click OK.
After Logtail is installed, click Complete Installation.
In the Create Machine Group step, configure the Name parameter and click Next.
Simple Log Service allows you to create IP address-based machine groups and custom identifier-based machine groups. For more information, see Create an IP address-based machine group and Create a custom identifier-based machine group.
Confirm that the machine group is displayed in the Applied Server Groups section and click Next.
ImportantIf you apply a machine group immediately after you create the machine group, the heartbeat status of the machine group may be FAIL. This issue occurs because the machine group is not connected to Simple Log Service. To resolve this issue, you can click Automatic Retry. If the issue persists, see What do I do if no heartbeat connections are detected on Logtail?
In the Configure Data Source step of the Import Data wizard, configure the Configuration Name parameter, copy and paste the following configuration script to the Plug-in Configuration field, and then click Next.
{
     "inputs": [
         {
             "type": "service_syslog",
             "detail": {
                 "Address": "tcp://0.0.0.0:9000",
                 "ParseProtocol": "rfc3164"
             }
         },
         {
             "type": "service_syslog",
             "detail": {
                 "Address": "udp://0.0.0.0:9001",
                 "ParseProtocol": "rfc3164"
             }
         }
     ]
 }
The following table describes the parameters in the configuration script.
Parameter
Type
Required
Description
typestring
Yes
The type of the data source. The value is fixed as
service_syslog.Addressstring
No
The listener protocol, IP address, and port of Logtail. Logtail listens to log sources and obtains logs based on your Logtail configuration. The value is in the
[tcp/udp]://[ip]:[port]format. Default value:tcp://127.0.0.1:9999, which indicates that Logtail receives only logs that are forwarded to the Logtail server.NoteThe listener protocol, IP address, and port that you specify in your Logtail configuration must be the same as those specified in the forwarding rule that is added to the configuration file of rsyslog.
If the server on which Logtail is installed uses multiple IP addresses to receive logs, set Address to
0.0.0.0, which indicates that Logtail listens to all IP addresses of the server.
ParseProtocolstring
No
The protocol that you want Logtail to use to parse logs. This parameter is left empty by default, which indicates that logs are not parsed. Valid values:
Empty: Logtail does not parse syslogs.
rfc3164: The RFC 3164 protocol is used to parse logs.
rfc5424: The RFC 5424 protocol is used to parse logs.
auto: Logtail automatically selects a protocol based on the content of logs.
IgnoreParseFailureboolean
No
Specifies whether to perform an operation on a log after the log fails to be parsed. Valid values: true and false. Default value:
true, which indicates that the system does not parse the log and adds the log to the content field. If you set this parameter tofalse, the system discards the log after the log fails to be parsed.In the Query and Analysis Configurations step of the Import Data wizard, click Automatic Index Generation. After you configure this setting, no data is collected. To collect data, click Next to complete the Logtail configuration.
Log on to the Simple Log Service console and view the collected syslogs in the required Logstore. For more information, see Guide to log query and analysis.

Log field descriptions
Field | Description |
| The hostname. If no hostname is included in the log, the hostname of the current host is obtained. |
| The tag field in the syslog protocol. |
| The priority field in the syslog protocol. |
| The facility field in the syslog protocol. |
| The severity field in the syslog protocol. |
| The timestamp of the log. |
| The content of the log. If the log fails to be parsed, this field contains the content of the raw log. |
| The IP address of the current host. |
| The IP address of Logtail that transfers the log. |
Examples
Collect NGINX logs
NGINX servers allow you to directly forward access logs to a specific IP address and port by using a specific syslog protocol. If you want to deliver all the data of a server as syslogs to Simple Log Service, you can create a Logtail configuration to collect the data. The data includes NGINX access logs.
Create a Logtail configuration. For more information, see Collect Linux syslogs.
The following sample code provides an example of a configuration script in the Plug-in Configuration field:
{
     "inputs": [
         {
             "type": "service_syslog",
             "detail": {
                 "Address": "udp://127.0.0.1:9001",
                 "ParseProtocol": "rfc3164"
             }
         }
     ]
 }
Add a forwarding rule for NGINX.
Find the nginx.conf file on the NGINX server and add a forwarding rule to the file. For more information, see NGINX Beginner's Guide.
The following sample code provides an example of a forwarding rule:
server {
    ...

    # Add this line.
    access_log syslog:server=127.0.0.1:9001,facility=local7,tag=nginx,severity=info combined;

    ...
}
Run the following command to restart NGINX and validate the forwarding rule:
sudo service nginx restart
Collect firewall logs
In most cases, firewalls allow you to directly forward access logs to a specific IP address and port by using a specific syslog protocol. If you want to deliver the logs of a firewall as syslogs to Simple Log Service to build a security information and event management (SIEM) solution, you can create a Logtail configuration to collect the logs.
Create a Logtail configuration. For more information, see Collect Linux syslogs.
The following sample code provides an example of a configuration script in the Plug-in Configuration field:
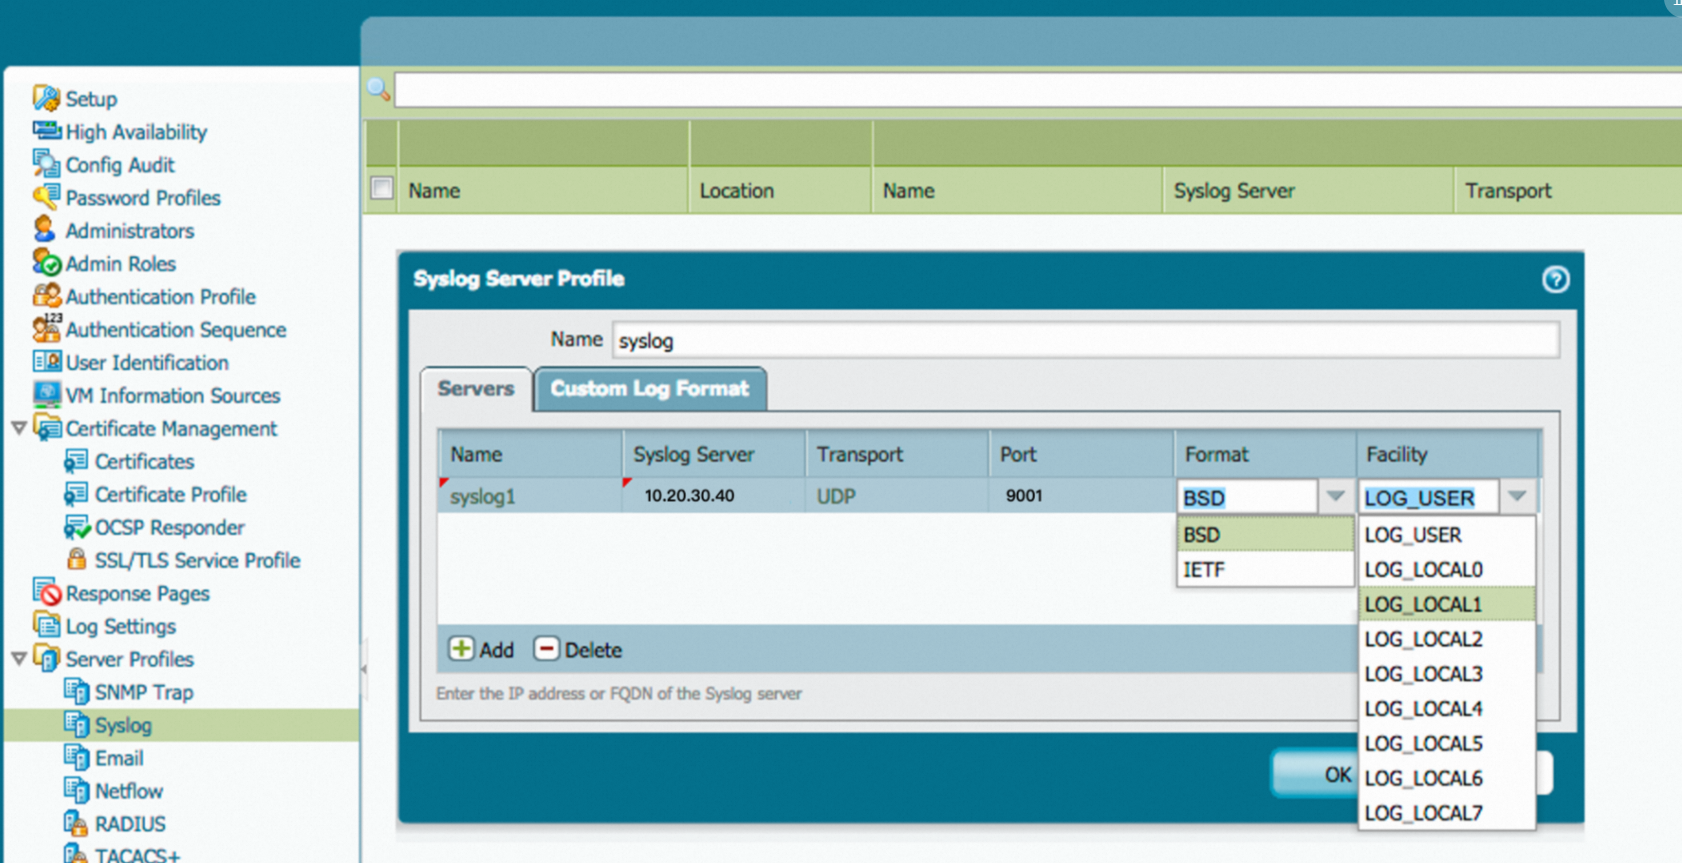
{
     "inputs": [
         {
             "type": "service_syslog",
             "detail": {
                 "Address": "udp://0.0.0.0:9001",
                 "ParseProtocol": "rfc3164"
             }
         }
     ]
 }
Add a forwarding rule for the firewall based on the firewall manual. In this example, the IP address of the server on which Logtail is installed is 10.20.30.40.
Troubleshooting
If no data is displayed on the preview page or the query page after logs are collected by using Logtail, you can run logger commands to send data to local Logtail. Then, you can check whether the issue occurred due to the writer, network, or Logtail.
If local Logtail can receive data, the issue occurred due to the writer or the network.
logger -n localhost -P 9000 -T "This is a TCP syslog message"
logger -n localhost -P 9001 -d "This is a UDP syslog message"
For more information, see What do I do if errors occur when I use Logtail to collect logs?