The dual axis chart widget allows you to customize the chart style, the display of different series of data, and other options as needed.
Style
- Global Settings
- Font Family: To set the font of the displayed text, click the drop-down arrow and select the target font. The default font is Microsoft YaHei.
- Margin: Spacing between the chart and the chart borders. The unit is pixels.
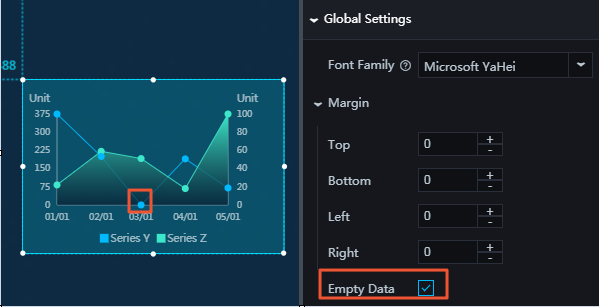
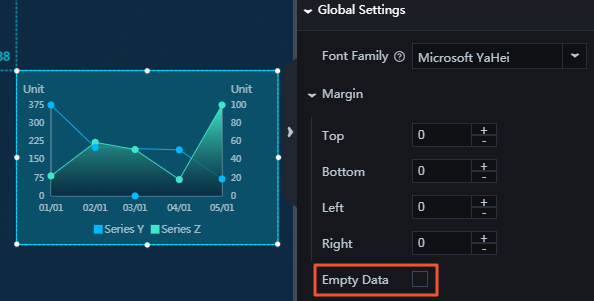
- Empty Data: If you select this option, the line and the x-axis intersect at the point where
the value corresponding to the y-axis is 0. If you clear this option, the line and
the x-axis do not intersect at the point where the value corresponding to the y-axis
is 0.
- X Axis: To display the x-axis, click the Eye icon.
- Text Style
- Font Size: To change the font size of the text along the x-axis, enter a value, or click + or –.
- Font Color: To change the font color of the text along the x-axis, see Color picker.
- Font Weight: To set the font weight of the text along the x-axis, click the drop-down arrow and select the target font weight.
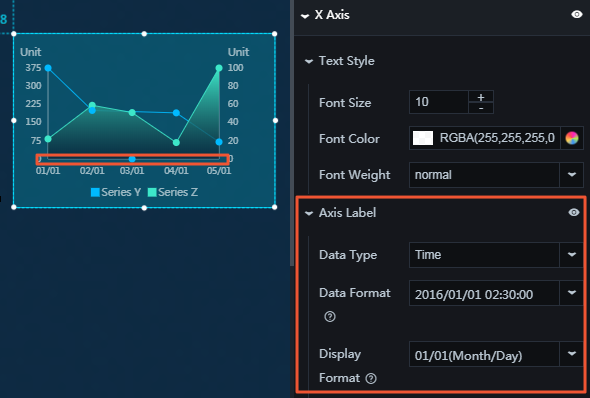
- Axis Label: To display the axis labels, click the Eye icon.
Note An error will be displayed if the data format differs from the data format set for the x field in the data pane.
- Data Type: To set the data type along the x-axis, click the drop-down arrow and select the
target type.
- Numeric
- Category
- Time
- Data Format: To set the format of the data, click the drop-down arrow and select the target format.
Note The following is an example: %Y/%m/%d%H:%M:%S.
- Display Format: To set the display format of the data, click the drop-down arrow and select the
target format.
Note Time format: %m/%d%Y%H:%M:%S; integer format: d; floating-point number: .1f.
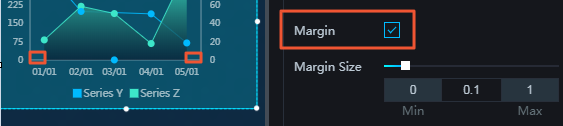
- Margin: If you select this option, spacing 1 (spacing between the chart and the y-axis) and spacing 2 (spacing between the chart and the right border of the chart) are displayed. If you clear this option, spacing 1 and spacing 2 are not displayed.
- Margin Size: To adjust spacing 1 and spacing 2, enter a value or drag the slider. The value range
is from 0 to 1.
- Min/Max: You can set the minimum and maximum values along the x-axis as needed.
- Offset: To adjust the spacing between the labels along the x-axis, enter a value, or click + or –.
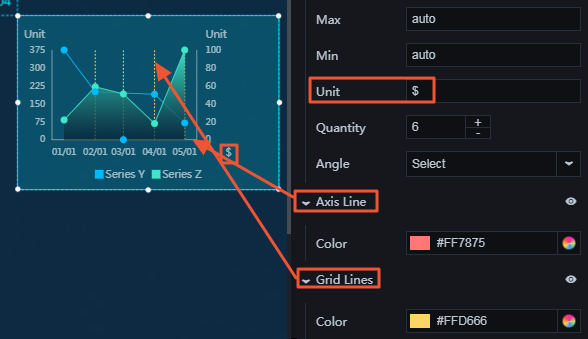
- Unit: You can customize the unit of the text along the x-axis as needed.
- Quantity: To change the number of labels along the x-axis, enter a value, or click + or –.
- Angle: To set the angle of the labels along the x-axis, click the drop-down arrow and select the target angle. The options include horizontal, slant, and vertical.
- Axis Line: To display the axis line, click the Eye icon. To change the color of the axis line, see Color picker.
- Grid Lines: To display the grid lines, click the Eye icon. To change the color of the grid lines, see Color picker.
- Data Type: To set the data type along the x-axis, click the drop-down arrow and select the
target type.
- Text Style
- Y Axis
The y-axis is on the left. For more information about how to set the y-axis, see X Axis.
- Z Axis
The z-axis is on the right. For more information about how to set the z-axis, see X Axis.
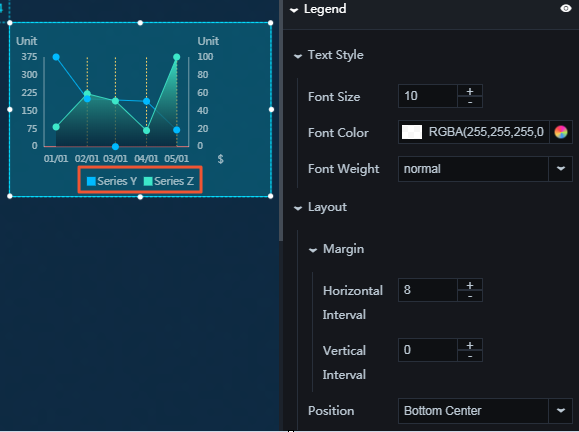
- Legend: To display the legend items, click the Eye icon.
- Text Style
- Font Size: To change the font size of the legend text, enter a value, or click + or –.
- Font Color: To change the font color of the legend text, see Color picker.
- Font Weight: To set the font weight of the legend text, click the drop-down arrow and select the target font weight.
- Layout
- Margin
- Horizontal Interval: To adjust spacing 1 (spacing between the legend items and the right border of the chart) and spacing 2 (spacing between the legend items and the left border of the chart), enter a value, or click + or –.
- Vertical Interval: To adjust spacing 1 (spacing between the legend items and the top border of the chart) and spacing 2 (spacing between the legend items and the bottom border of the chart), enter a value, or click + or –.
- Position: To set the position of the legend items, click the drop-down arrow and select the
target position.
- Top center
- Top left
- Top right
- Bottom center
- Bottom left
- Bottom right
- Margin
- Text Style
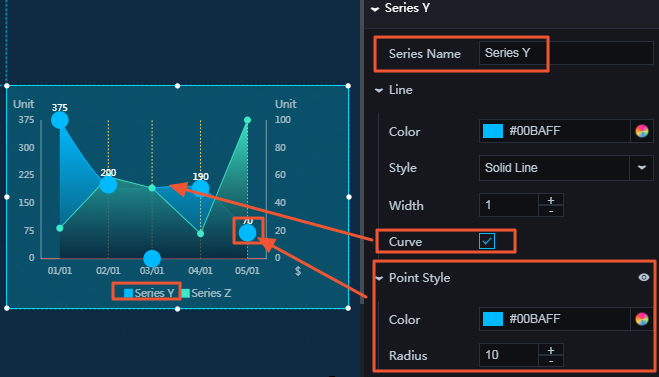
- Series Y/Series ZNote By default, a dual axis chart has two series of data, which correspond to the data along the y-axis and z-axis. You can customize the data style as needed, including the name of each series of data, the line style, the point style, and the area.
- Series Name: You can set a name for the series as needed.
- Line
- Color: To change the line color, see Color picker.
- Style: To set the line style, click the drop-down arrow and select the target style.
- Solid line
- Dotted line
- Width: To change the line width, enter a value, or click + or –.
- Curve: If you select this option, the line is displayed as a curve. If you clear this option, the line is displayed as a straight line.
- Point Style: To display the point style, click the Eye icon.
- Color: To change the point color of the line, see Color picker.
- Radius: To change the point radius, enter a value, or click + or –.
- Area: To set the fill color type, click the drop-down arrow and select the target type.
- Solid fill
- Gradient fill
- You can select two colors as the gradient colors.
- To change the gradient angle, enter a value or drag the slider. The value range is from 0 to 360.
- Label: To display the labels, click the Eye icon.
- Font Size: To change the font size of the label text, enter a value, or click + or –.
- Color: To change the font color of the label text, see Color picker.
- Font Weight: To set the font weight of the label text, click the drop-down arrow and select the target font weight.

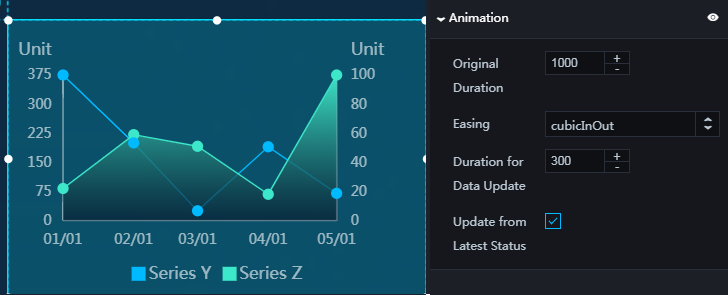
- Animation: To display the animation option, click the Eye icon.
- Original Duration: To change the duration to which the widget renders the animation for the first time, enter a value, or click + or –. The unit is milliseconds.
- Easing: To set animation easing, click the drop-down arrow and select the target effect.
- Duration for Data Update: To change the animation duration when data changes, enter a value, or click + or –. The unit is milliseconds.
- Update from Latest Status: If you select this option, the animation begins from the point where the data has changed. If you clear this option, the animation begins from the starting point.
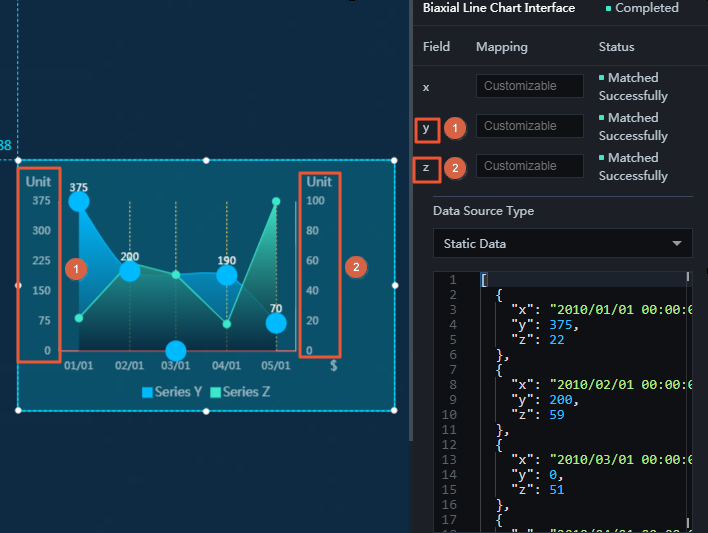
Data
The data pane of a dual axis chart has three fields (x, y and z fields). The x and y fields correspond to the points on the two lines.
- x: data along the x-axis. The value of this field must be in the same format as the label text along the x-axis.
- y: data along the y-axis
- z: data along the z-axis
Interaction
This widget is not connected to any events yet.