The basic pie chart I widget allows you to customize the pie chart style, the percentage of different data, and other options as needed.
Style
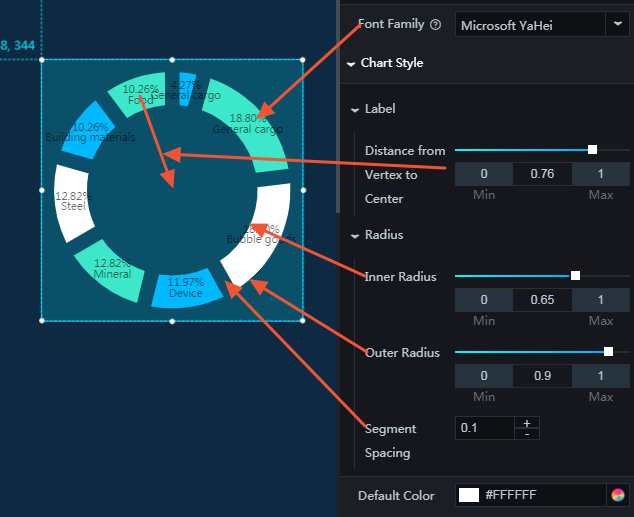
- Font Family: To change the font of the text in the pie chart, click the drop-down arrow and select the target font. The default font is Microsoft YaHei.
- Chart Style
- Label
- Distance from Vertex to Center: To change the distance between the labels and the center of the pie chart, enter a value or drag the slider. The value range is from 0 to 1.
- Radius
-
Inner Radius: To change the length of the inner radius, enter a value or drag the slider. The value range of the inner radius is from 0 to 1.
-
Outer Radius: To change the length of the outer radius, enter a value or drag the slider. The value range of the outer radius is from 0 to 1.
-
Segment Spacing: To adjust the spacing between the segments, enter a value, or click + or –. The maximum value cannot be greater than 1.
-
- Label
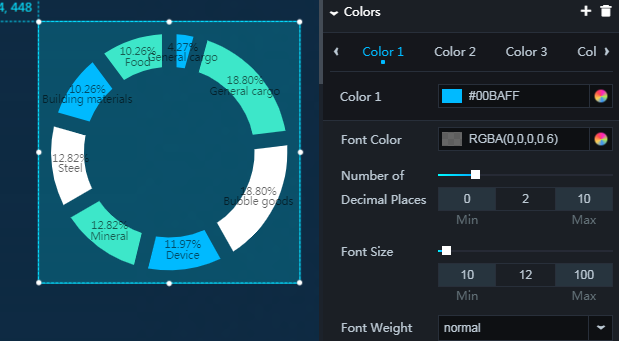
- Colors: To add or delete a segment or segments of the same color, click + or click the Trash icon.
- Color: To change the color of different segments, see Color picker.
- Font Color: To change the font color of the label names and percentage values, see Color picker.
- Number of Decimal Places: To change the number of digits to the right of the decimal point, enter a value or drag the slider. The value range is from 0 to 10.
- Font Size: To change the font size of the label names and percentage values, enter a value or drag the slider. The value range is from 10 to 100.
- Font Weight: To change the font weight of the label names and percentage values, click the drop-down
arrow and select the target font weight.
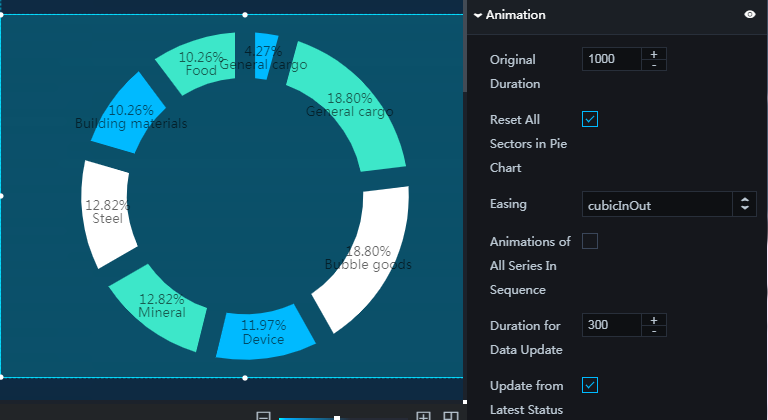
- Animation: To display the animation option, click the Eye icon.
- Original Duration: To change the duration to which the widget renders the animation for the first time, enter a value, or click + or –. The unit is milliseconds.
- Reset All Sectors in Pie Chart: If you select this option, the animation of each segment in the pie chart is displayed in sequence. If you clear this option, the animation of each segment in the pie chart is displayed at the same time.
- Easing: To set animation easing, click the drop-down arrow and select the target effect.
- Animations of All Series in Sequence: If you select this option, the animations of all segments in the pie chart are displayed in sequence. If you clear this option, the animations of all segments in the pie chart are displayed at the same time.
- Duration for Data Update: To change the animation duration when data changes, enter a value, or click + or –. The unit is milliseconds.
- Update from Latest Status: If you select this option, the animation begins from the segment where the data has changed. If you clear this option, the animation begins from the starting point.
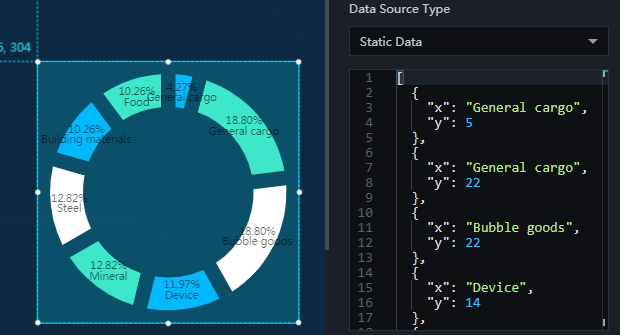
Data
- x: label name
- y: label value, which corresponds to the percentage value of this label
Interaction
This widget is not connected to any events yet.