This topic describes how to use the text analysis components provided by Platform for AI (PAI) to automatically classify product tags.
Background information
Product descriptions on e-commerce platforms often contain multiple tags. For example, the description of a pair of shoes may be "Girls' British Style Lace-up Martens Boots, Women's Genuine Leather Suede Casual Ankle Boots with Thick Sole." A bag may be described as "Daily Deal: 2016 New Arrival Korean-Style Autumn/Winter Women's Tassel Crossbody Shell Bag, Ladies' Shoulder Tote Handbag." The tags highlight product attributes from various dimensions, such as production date, place of origin, and style. For e-commerce platforms that manage tens of thousands of products, efficient classification of product tags is crucial. PAI provides text analysis components that can automatically learn and classify tags.
Prerequisites
A workspace is created. For more information, see Create a workspace.
MaxCompute resources are associated with the workspace. For more information, see Manage workspaces.
Dataset preparation
In this example, the dataset contains more than 2,000 product descriptions from the 2016 Double 11 Shopping Festival. Each description is a cluster of product tags.
To prepare a dataset, go to the DataStudio module of DataWorks, create a table that contains only one column that is named content, and upload the dataset to the table. For more information, see Create tables and upload data.
Procedure
Go to the Machine Learning Designer page.
Log on to the PAI console.
In the left-side navigation pane, click Workspaces. On the Workspaces page, click the name of the workspace that you want to manage.
In the left-side navigation pane, choose to go to the Machine Learning Designer page.
Create a custom pipeline and go to the pipeline page. For more information, see Create a custom pipeline.
Add components to the pipeline and run the pipeline.
In the left-side pane, drag the Read Table component in the Data Source/Target folder to the canvas and rename the component to shopping_data-1.
In the left-side pane, drag the Split Word, Word Frequency Statistics, and Word2Vec components in the folder to the canvas.
In the left-side pane, drag the Add ID Column and Data Type Conversion components in the Data Preprocessing folder to the canvas.
In the left-side pane, drag the K-means Clustering component in the folder to the canvas.
In the left-side pane, drag the SQL Script component in the UserDefinedScript folder to the canvas.
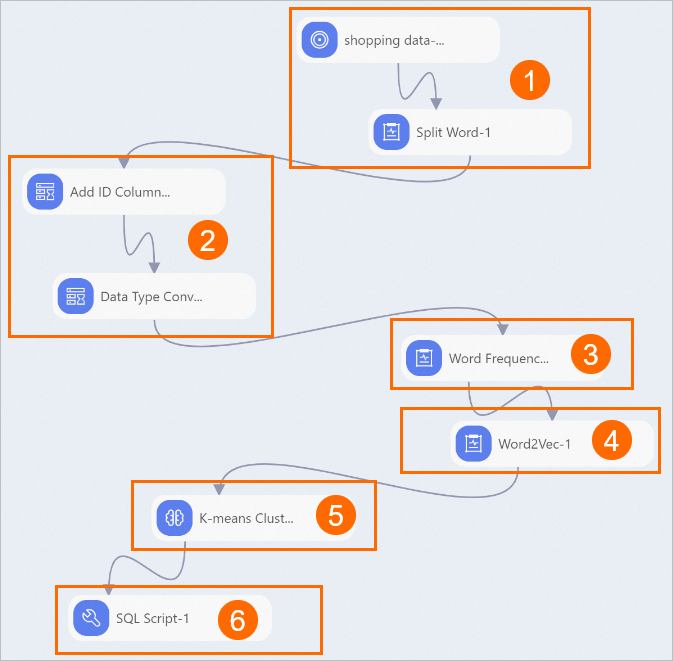
Connect the preceding components into the pipeline as shown in the following figure, and configure the parameters to run the pipeline as described in the following table.
Click the shopping_data-1 component on the canvas. On the Select Table tab in the right-side pane, select the name of the table that contains the dataset.
Click the Split Word-1 component on the canvas. On the Fields Setting tab in the right-side pane, select content for the Columns field.
Right-click the shopping_data-1 component and choose Run Current Node in the shortcut menu. After you run the component, perform the same steps to run the Split Word-1 component.
Click the Word Frequency Statistics-1 component on the canvas. On the Fields Setting tab in the right-side pane, select append_id from the Document ID Column drop-down list and content from the Document Content Column drop-down list.
Right-click the Word Frequency Statistics-1 component and choose Run Current Node in the shortcut menu.
If two word vectors are close to each other in the vector space, the two words are semantically similar.
The distance between word vectors reflects the semantic similarity of the words.
Click the Word2Vec-1 component on the canvas. On the Fields Settings tab in the right-side pane, select word from the Word Column drop-down list. On the Parameter Settings tab, select the Hierarchical Softmax option.
Right-click the Word2Vec-1 component and choose Run Current Node in the shortcut menu.
Click the K-means Clustering-1 component on the canvas. On the Fields Settings tab, select f0 for the Feature Columns field and word for the Additional Column field.
NoteBefore you run the component, make sure that the number of rows in the upstream data table is greater than or equal to the number of clusters specified in the component parameters.
Right-click the K-means Clustering-1 component and choose Run Current Node in the shortcut menu.
Step number
Description
1
Import the prepared dataset to the shopping_data-1 component and use the Split Word-1 component to split the product descriptions in the dataset into words.
2
Add an ID column. The data imported from the dataset contains only one column. An ID column is required to serve as the primary key of each data record.
Right-click the Add ID Column-1 component and choose Run Current Node in the shortcut menu. After you run the component, perform the same steps to run the Data Type Conversion-1 component.
3
Count the frequency of each word that appears in product descriptions.
4
Generate word vectors. A word vector is a numerical representation of a word in a high-dimensional space.
Use the Word2Vec component to generate a 100-dimensional vector for each word.
5
Divide the word vectors into clusters. Calculate the distance between the word vectors by using K-means clustering, which automatically classifies words based on their semantic meanings.
6
Verify the classification result. Select a cluster and use the SQL Script-1 component to check whether words are correctly classified. In this example, the 10th cluster is used. Click the SQL Script-1 component on the canvas. On the Parameters Setting tab in the right-side pane, enter
select * from ${t1} where cluster_index=10in the SQL Script code editor.The result indicates that the cluster includes geographical words. However, some non-geographical words, such as nut, are also included. This mistake may be caused by insufficient training data. A larger dataset can produce more accurate classification results.
References
For more information about algorithm components, see the following topics: