In OLAP scenarios, optimizing slow queries typically requires database administrators (DBAs) to manually analyze SQL patterns, extract subqueries, create sink tables, and then work with development teams to rewrite application SQL. AnalyticDB for MySQL automates this entire process: the system analyzes your cluster's query history, identifies reusable subqueries, and lets you create a materialized view with a single click. The optimizer then transparently rewrites matching queries to use the view—no application changes required.
How it works
The automatic materialized view recommendation feature works in three stages:
-
Analyze and recommend. The system scans recent slow queries in your cluster (by default, queries exceeding 1 second), removes constants to extract query templates called patterns, and identifies subqueries that appear across multiple patterns.
-
Quantify benefits. For each candidate subquery, the system estimates how many queries it accelerates and how many scanned bytes it saves.
-
Create with one click. Review the recommendations in the console and click Generate materialized view to produce a ready-to-execute DDL statement.
After a materialized view is created, it is automatically refreshed in the background at regular intervals, keeping data consistent with the underlying base tables.
Creating and running recommendation tasks does not consume AnalyticDB compute units (ACUs) or incur fees.
Use cases
Fixed report development — When your team runs the same aggregation queries daily to generate business reports, the system pre-calculates results so reports return in seconds instead of minutes.
User behavior analysis — When data analysts repeatedly join and aggregate large user-event tables, the system caches the common aggregation so analysts get results without scanning raw data each time.
Real-time risk control — When risk-control jobs query key metrics at high frequency during peak hours, caching those metrics in a materialized view prevents resource contention and reduces alert latency to milliseconds.
Multidimensional data exploration — When business teams explore data across multiple dimensions—such as time, region, and category—without a fixed query pattern, the system adapts to emerging query shapes and builds views that cover the most frequent combinations.
Understanding query pattern analysis
The system parses historical SQL statements, removes constants, and groups similar queries into patterns. Consider the following five queries on a students table:
-- sql1 / pattern1
SELECT gender, count(*) FROM students WHERE graduated = 'true' GROUP BY gender;

-- sql2 / pattern1
SELECT gender, count(*) FROM students WHERE graduated = 'false' GROUP BY gender;

-- sql3 / pattern2
SELECT s.age as a, count(s.id) as cnt FROM STUDENTS s WHERE s.gender between 1 and 3;

-- sql4 / pattern2
SELECT s.age as a, count(s.id) as cnt FROM STUDENTS s WHERE s.gender between 3 and 6;

-- sql5 / pattern3
SELECT gender, avg(age) FROM students GROUP BY gender;
If all five queries exceed the slow query threshold, the system distills them into three patterns:
-- pattern1
SELECT gender, count(*) FROM students WHERE graduated = ? GROUP BY gender;

-- pattern2
SELECT s.age as a, count(s.id) as cnt FROM STUDENTS s WHERE s.gender between ? and ?;

-- pattern3
SELECT gender, avg(age) FROM students GROUP BY gender;
The optimizer then merges overlapping patterns into a single common subquery. Materializing this subquery accelerates all three patterns at once:
SELECT gender, graduated, count(id), avg(age), count(*)
FROM STUDENTS
GROUP BY gender, graduated;
Version requirements
Your cluster must have a Milvus version of 3.2.5 or later.
To view and update the minor version, go to the Configuration Information section on the Cluster Information page in the AnalyticDB for MySQL console.
The Subquery filter conditions parameter and SQL-based result queries require Milvus version 3.2.6 or later.
Create materialized views from query history
Follow these steps to set up automatic materialized view recommendations and verify the acceleration effect: create a recommendation task, review the recommended subqueries, generate the materialized view DDL, and confirm that query rewrite is active.
Step 1: Create a recommendation task
A recommendation task periodically scans query history and extracts candidate subqueries. Running the task does not consume ACUs.
-
Log on to the AnalyticDB for MySQL console. In the upper-left corner, select the region of your cluster. In the left navigation pane, click Clusters.
-
Click the ID of the target cluster. In the left navigation pane, choose Data Management > Materialized View Recommendation.
-
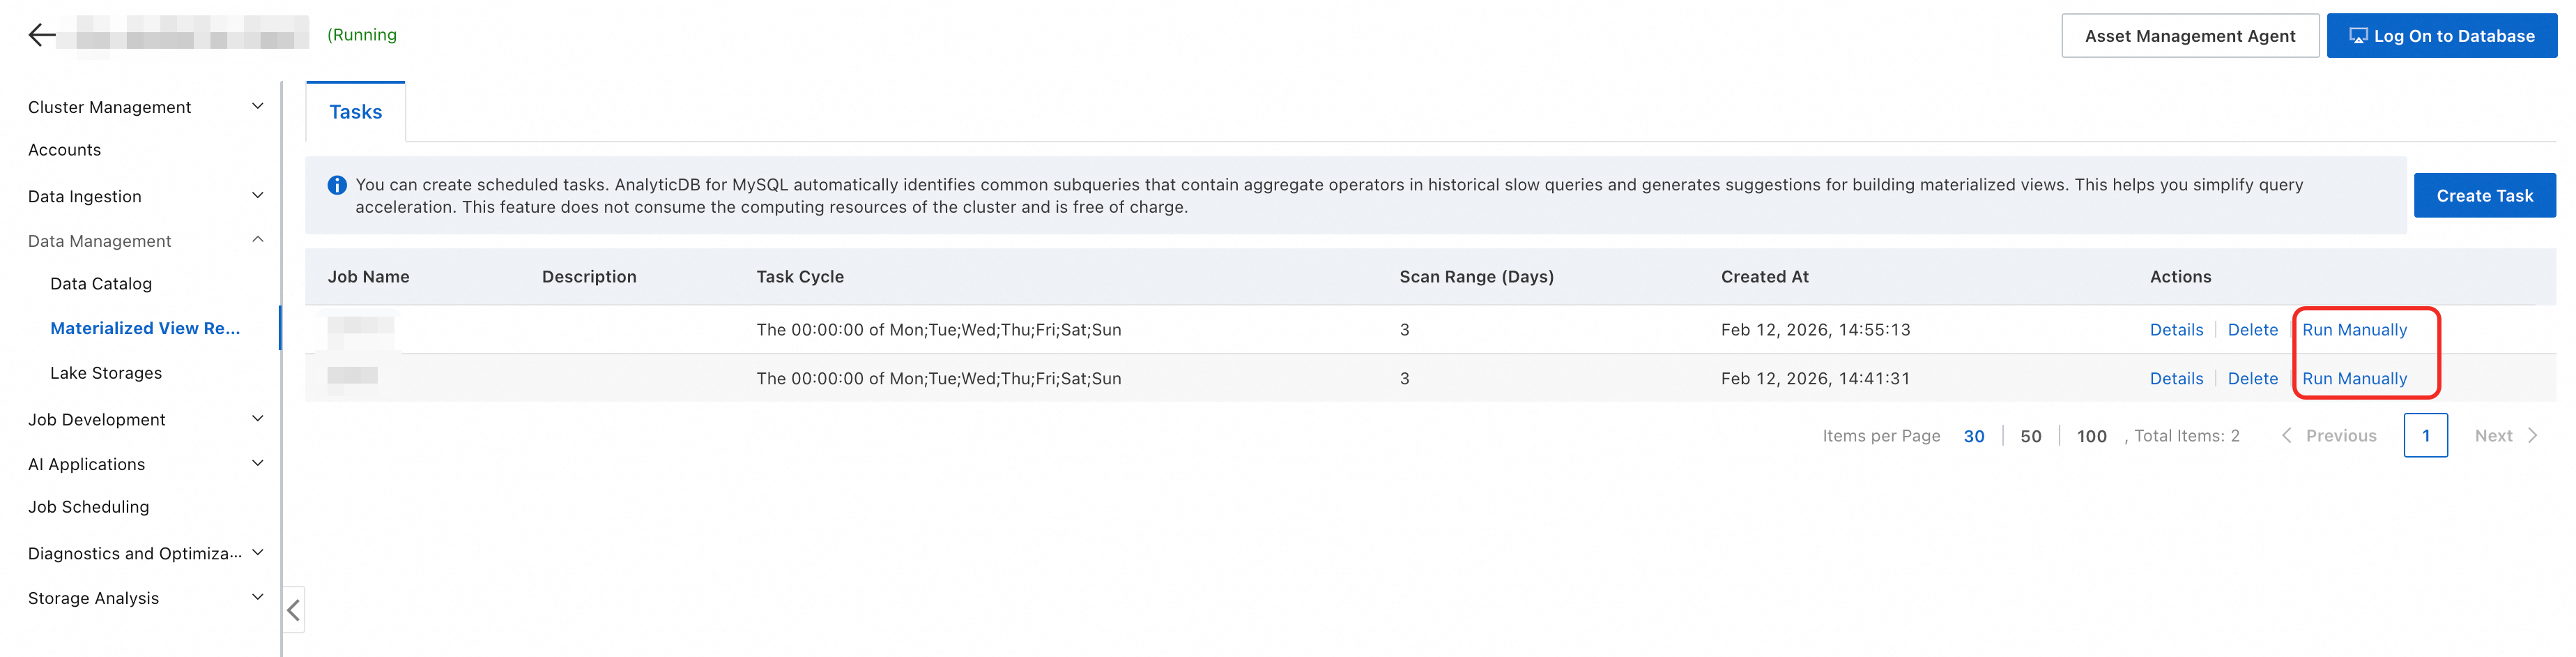
On the Tasks tab, click Create Task in the upper-right corner.
-
Configure the parameters and click OK. > Tip: If you are unsure which parameter values to use, create multiple tasks with different configurations and run them in parallel to compare results. Parallel task runs do not consume computing resources.
Currently, subqueries can only be built from single-table queries. Subqueries in
WITH CTEclauses are included. Multi-tableJOINportions are excluded from recommendations.Parameter Description Task cycle How often the task runs. Example: Daily. Task start time When the task runs each cycle. Example: 00:00:00. Scan range (days) The number of days of query history to scan. Default: last 3 days. Slow query threshold Queries are included only if their execution time exceeds this value. Set to 1 s for most clusters. Requires Milvus version 3.2.6 or later to modify. Minimum number of patterns for acceleration The minimum number of patterns a subquery must appear in to be recommended. Default: 1. Minimum number of slow queries per pattern The minimum number of slow queries a pattern must have to be included. Default: 5. -
(Optional) Trigger the task immediately. In the Actions column of the task, click Run manually. Recommendations are typically available within seconds or minutes.
Step 2: Review recommendation results
After the task runs, evaluate the recommended subqueries to decide which ones to materialize.
View results in the console
-
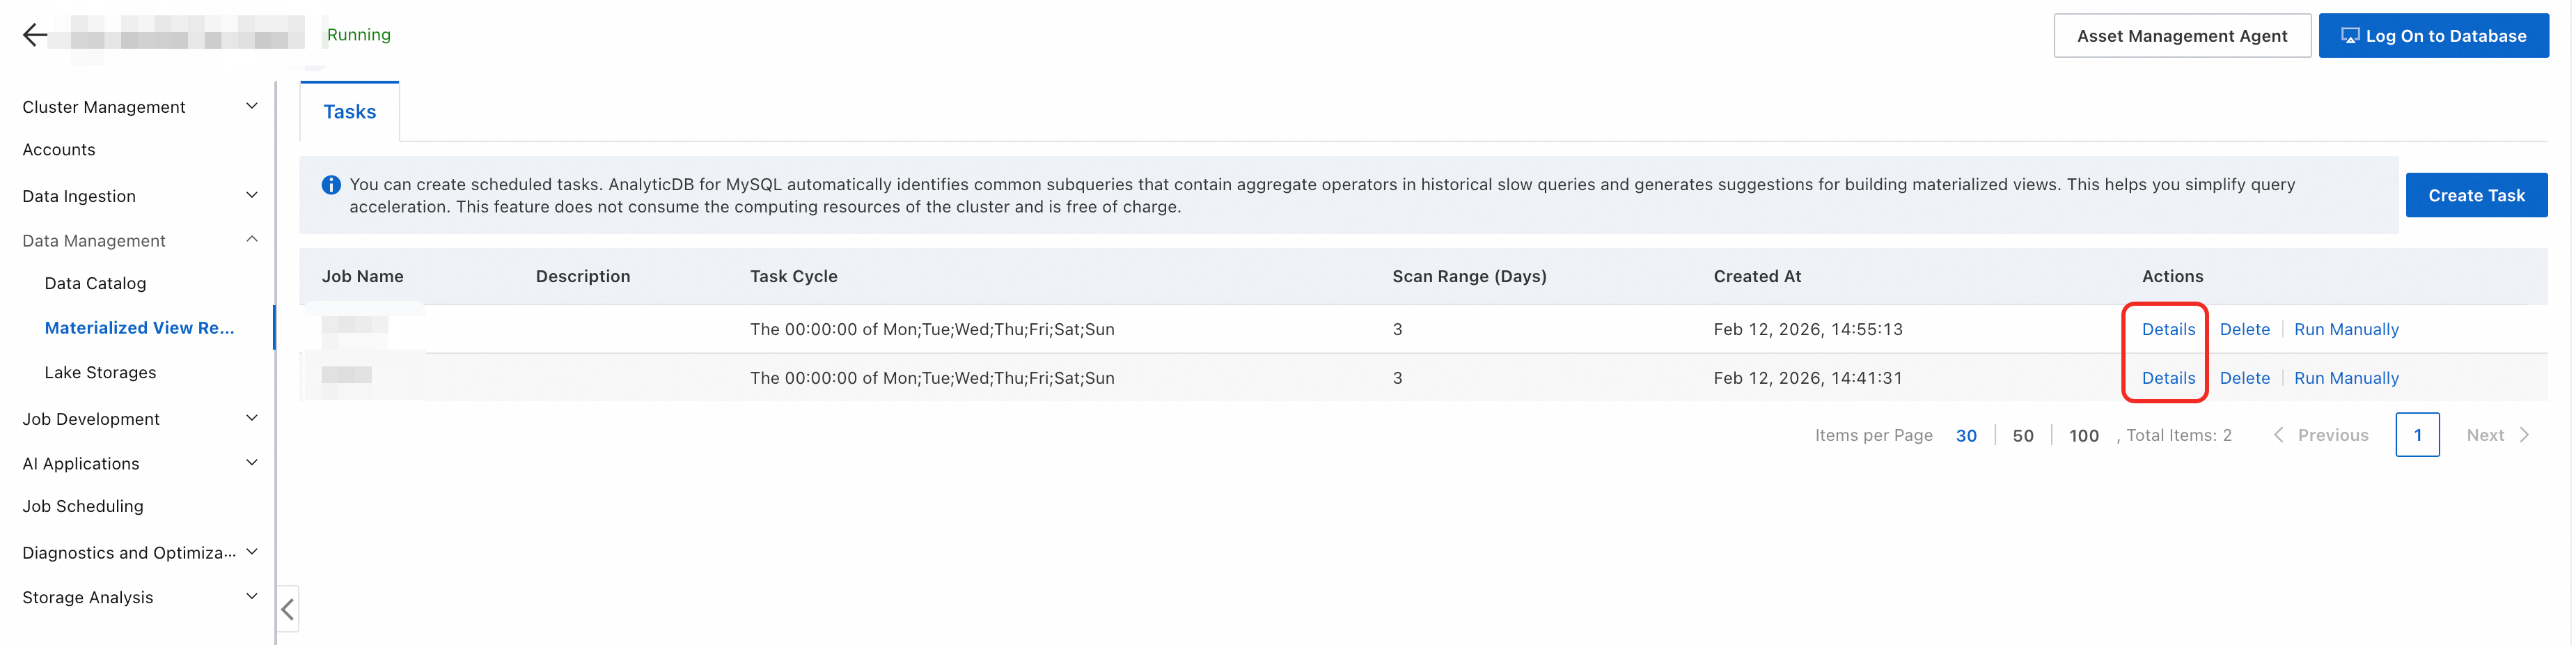
In the Actions column of the task, click Details.
-
In the Actions column of the relevant execution history entry, click View subquery.
Field Description Subquery The complete subquery body extracted from query history. Number of successfully accelerated queries The percentage of scanned queries that this subquery can accelerate. Number of scanned bytes saved The bytes saved by pre-calculating with this subquery to create a materialized view. Associated base tables The base tables that the recommended subquery reads from. 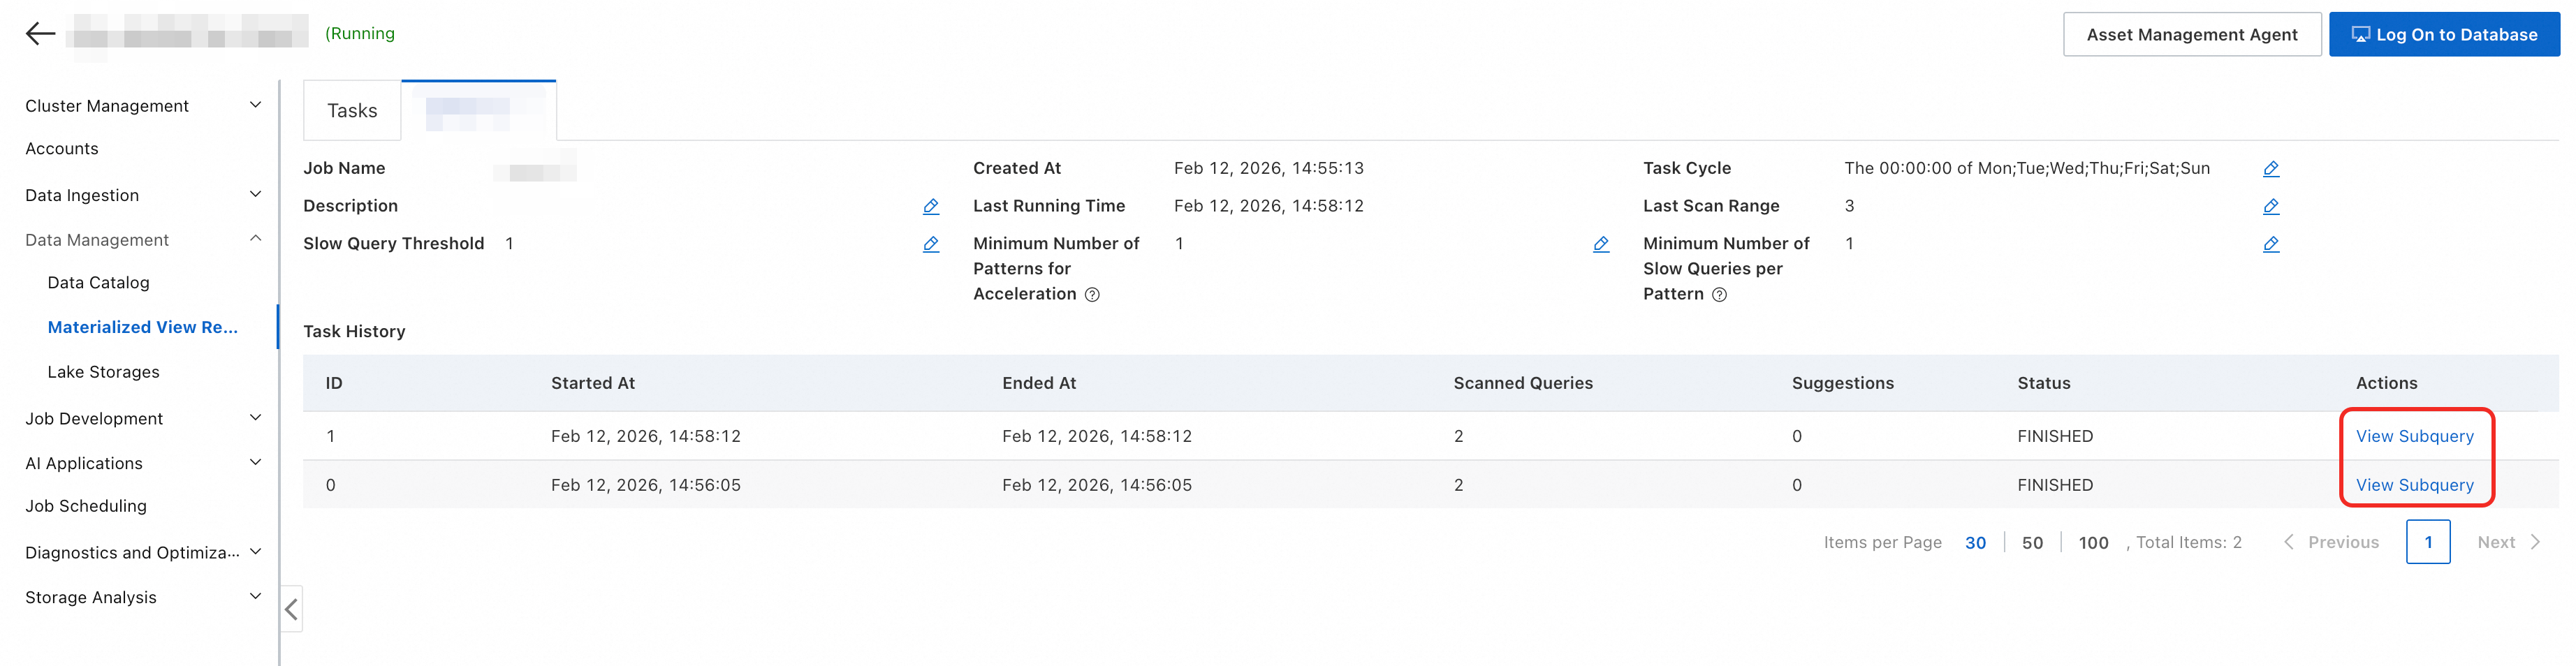
Query results using SQL
For flexible filtering, query the INFORMATION_SCHEMA.MV_RECOMMEND_RESULTS system table directly. This requires Milvus version 3.2.6 or later.
The following example retrieves all subqueries related to the lineitem table for a specific task on a specific date:
SELECT statement AS mv_define, can_refresh_fast, hit_queries_cnt, est_saved_scan_bytes
FROM INFORMATION_SCHEMA.MV_RECOMMEND_RESULTS
WHERE
    task_name = 'task_xxxxx'
    AND base_tables LIKE '%lineitem%'
    AND DATE(create_time) = '2025-09-11';
Step 3: Create a materialized view
-
In the Actions column of the target subquery, click Generate materialized view.
-
Enter a name for the materialized view. The console generates a Data Definition Language (DDL) statement with intelligent defaults that cover most scenarios:
Setting Default behavior Query rewrite Enabled. Transparent query rewrite is active immediately after the view is created. Refresh mode FAST (incremental refresh) if the query supports it; full refresh otherwise. Resource group Interactive resource group for incremental refresh; Serverless resource group named Job for full refresh. Refresh interval Every 5 minutes for incremental refresh; every 2 hours for full refresh. -
Copy the DDL statement to an SQL editor or client and run it to create the view. To customize column names, refresh frequency, or other settings, edit the DDL statement before running it.
Step 4: Verify acceleration
After the materialized view is created, the optimizer automatically rewrites queries that match the view's definition and routes them to the view.
The global query rewrite switch MV_QUERY_REWRITE_ENABLED is enabled by default. To activate rewrite for a specific view, enable the table-level switch when creating it (enabled by default in the generated DDL).
Check implicit hits in the console
-
On the cluster details page, in the left navigation pane, choose Data Management > Data Catalog.
-
Click the target database.
-
On the Materialized Views tab, click the materialized view you want to check.
The Implicit hits (last 7 days) count shows how many client queries the optimizer successfully rewrote and routed to this view.
Verify query rewrite with EXPLAIN
Run EXPLAIN on the original query to confirm that rewrite is active. If the TableScan operator shows the materialized view name instead of the original table name, query rewrite has taken effect.
Before creating the materialized view, the plan scans the original base table:
EXPLAIN SELECT course_id, course_name, max(course_grade) AS max_grade FROM tb_courses;+--------------------+
| Plan summary |
+--------------------+
1- Output[ Query plan ] {Est rowCount: 1.0}
2 -> Exchange[GATHER] {Est rowCount: 1.0}
3 - TableScan {table: tb_courses, Est rowCount: 1.0}After creating the materialized view, the plan scans the view instead:
EXPLAIN SELECT course_id, course_name, max(course_grade) AS max_grade FROM tb_courses;+--------------------+
| Plan summary |
+--------------------+
1- Output[ Query plan ] {Est rowCount: 1.0}
2 -> Exchange[GATHER] {Est rowCount: 1.0}
3 - TableScan {table: adb_mv, Est rowCount: 1.0}The TableScan operator now targets adb_mv (the materialized view) instead of tb_courses, confirming that transparent query rewrite is working.