ARMS provides common application monitoring metrics. To create custom metrics, you can import the OpenTelemetry Java SDK. This topic describes how to customize metrics and query them in Grafana.
Prerequisites
Your application is connected to ARMS Application Monitoring. For more information, see Connect an application.
The ARMS agent version is 4.5.0 or later.
Import dependencies
Add the following Maven dependencies to import the OpenTelemetry Java SDK. For more information, see the official OpenTelemetry documentation.
<dependencies>
    <dependency>
    <groupId>io.opentelemetry</groupId>
    <artifactId>opentelemetry-api</artifactId>
    </dependency>
    <dependency>
    <groupId>io.opentelemetry</groupId>
    <artifactId>opentelemetry-sdk-trace</artifactId>
    </dependency>
    <dependency>
    <groupId>io.opentelemetry</groupId>
    <artifactId>opentelemetry-sdk</artifactId>
    </dependency>
</dependencies>

<dependencyManagement>
  <dependencies>
    <dependency>
      <groupId>io.opentelemetry</groupId>
      <artifactId>opentelemetry-bom</artifactId>
      <version>1.23.0</version>
      <type>pom</type>
      <scope>import</scope>
    </dependency>
  </dependencies>
</dependencyManagement>
Steps to customize metrics
OpenTelemetry supports four main types of metrics. ARMS supports all of them except Histogram.
Counter Use: Records a cumulative value that only increases. Examples: Total number of HTTP requests, number of faults.
UpDownCounter Use: Records a value that can increase or decrease, such as the current number of active connections. Examples: Number of concurrent requests, number of tasks in a queue.
Histogram (not supported) Use: Records the distribution of values, such as latency or response size, and supports quantile calculations. Examples: Request latency distribution (P90, P95), file upload size.
Gauge Use: Captures an instantaneous value at a specific point in time, such as CPU usage or memory usage. Examples: System temperature, real-time memory usage.
Step 1: Add custom metrics to your code
The following code is a simple example of a flash sale. It defines two metrics:
product_seckill_count: The number of flash sale attempts.
product_current_stock: The current inventory level.
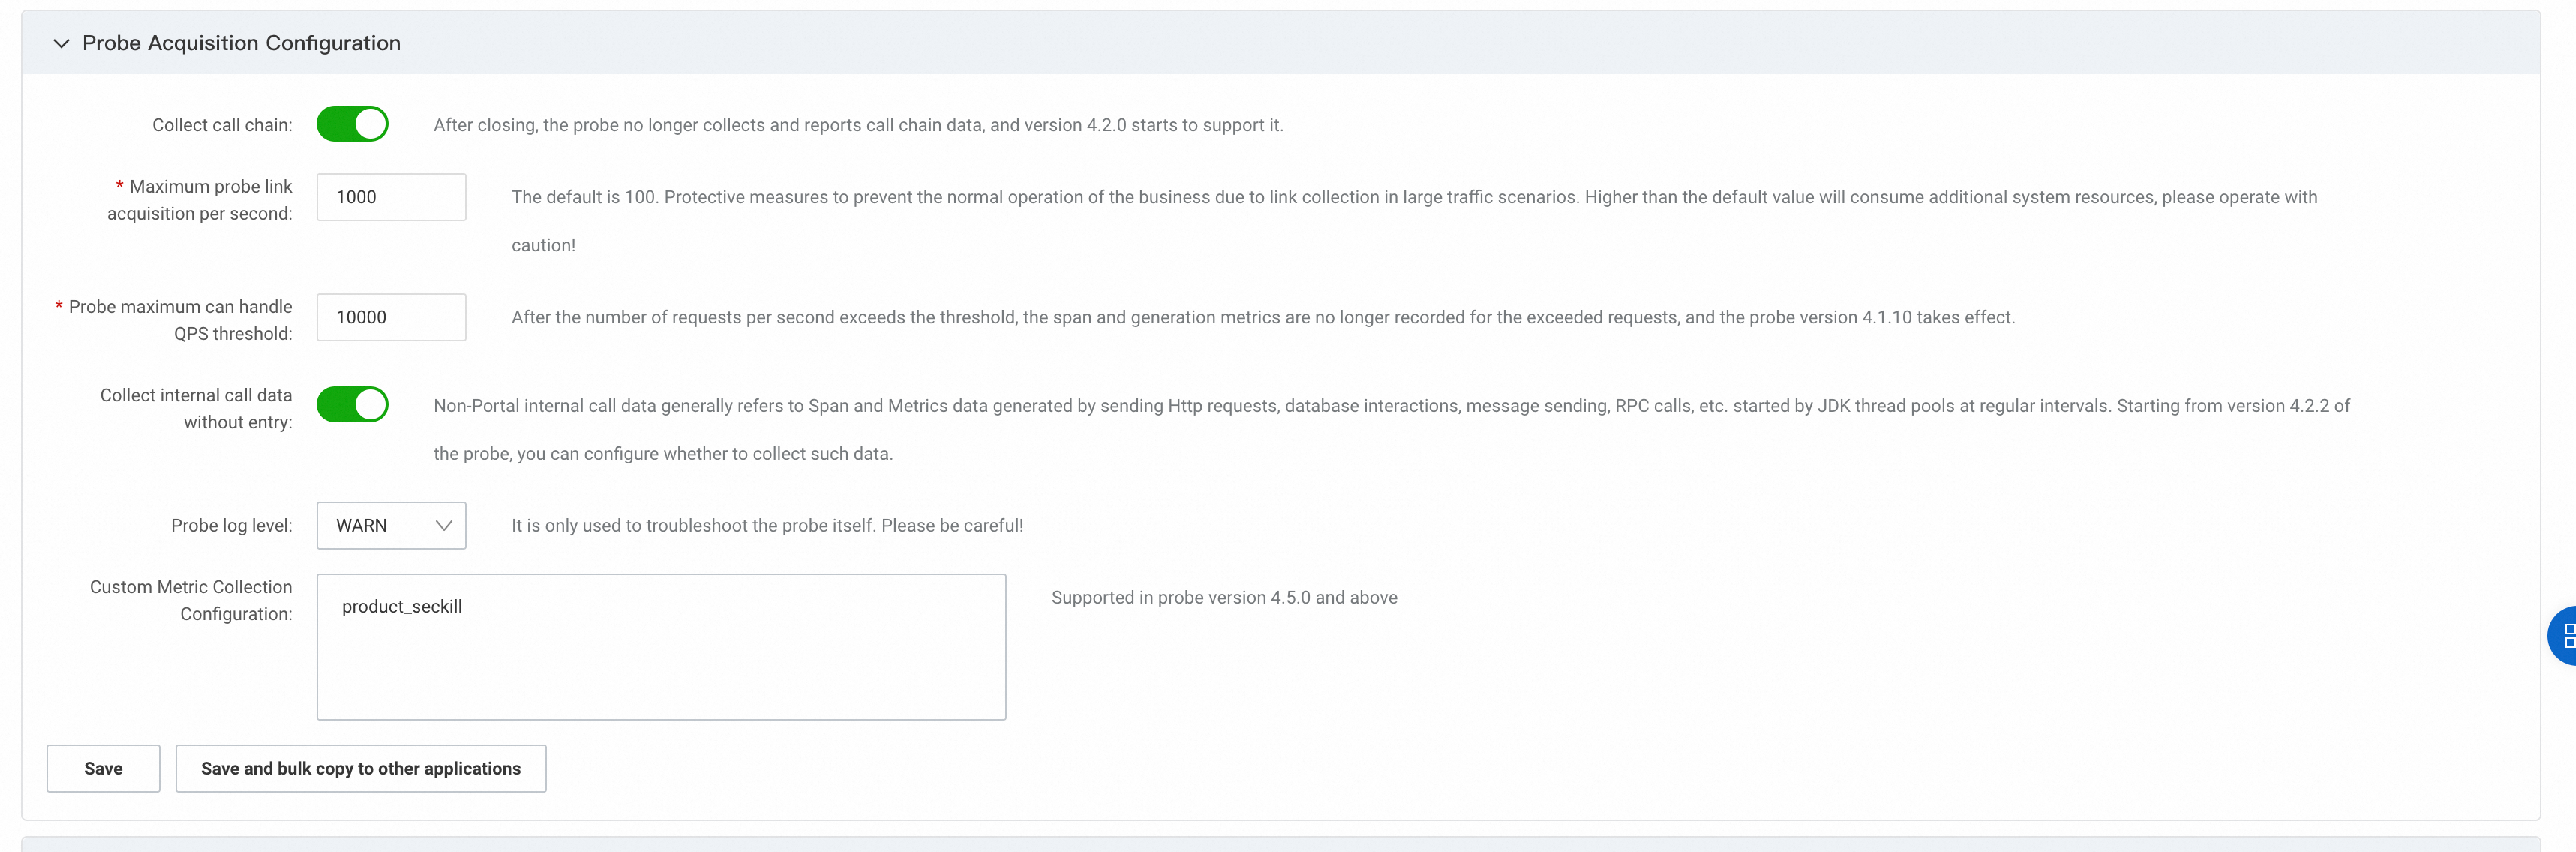
When you obtain the `meter` factory class, pass the product_seckill parameter. This parameter defines a group for your metrics. All metrics defined by this `meter` belong to this group. You will use this group name later in the configuration.
import io.opentelemetry.api.GlobalOpenTelemetry;
import io.opentelemetry.api.OpenTelemetry;
import io.opentelemetry.api.common.AttributeKey;
import io.opentelemetry.api.common.Attributes;
import io.opentelemetry.api.metrics.LongCounter;
import io.opentelemetry.api.metrics.Meter;
import io.opentelemetry.api.metrics.ObservableLongGauge;

import javax.annotation.PreDestroy;
import java.util.concurrent.atomic.AtomicInteger;

class ProductService {

    // Static inventory counter
    public final AtomicInteger stock = new AtomicInteger(0);

    private LongCounter seckillCounter;
    private ObservableLongGauge observableLongGauge;
    private final AttributeKey<String> seckillResult = AttributeKey.stringKey("seckill_result");

    public ProductService() {
        OpenTelemetry agentOpenTelemetry = GlobalOpenTelemetry.get();


        // Define the meter factory class. Note that product_seckill is important here.
        Meter meter = agentOpenTelemetry.getMeter("product_seckill");
        // Define a counter metric to record the number of flash sale attempts.
        seckillCounter = meter.counterBuilder("product_seckill_count")
                .setUnit("1")
                .setDescription("seckill product count")
                .build();

        // Define a gauge metric to represent the current product inventory.
        observableLongGauge = meter.gaugeBuilder("product_current_stock").ofLongs().buildWithCallback((measurement -> {
            // Record the current product quantity.
            measurement.record(stock.get());
        }));

    }

    @PreDestroy
    public void clear() {
        observableLongGauge.close();
    }

    public void setKillProductCount(int count) {
        stock.set(count);
    }

    public String seckillProduct() {
        int currentStock = stock.get();
        if (currentStock <= 0) {
            seckillCounter.add(1, Attributes.of(seckillResult, "failed"));
            return "Flash sale failed. Product is sold out.";
        }
        // Try to decrement the inventory.
        if (stock.decrementAndGet() >= 0) {
            seckillCounter.add(1, Attributes.of(seckillResult, "success"));
            return "Flash sale successful. Remaining inventory: " + stock.get();
        } else {
            stock.incrementAndGet(); // Rollback
            seckillCounter.add(1, Attributes.of(seckillResult, "success"));
            return "Flash sale failed. Product is sold out.";
        }
    }
}
Step 2: Configure metric collection in the console
In the console, modify the custom metric collection configuration. Add the parameter that you specified when you created the `meter` in the previous step.
Step 3: View metrics and configure alerts
In the ARMS console, go to the page. In the top menu bar, select the region where your application is deployed.
The Managed Service for Prometheus instance is the default instance for integrated application monitoring.
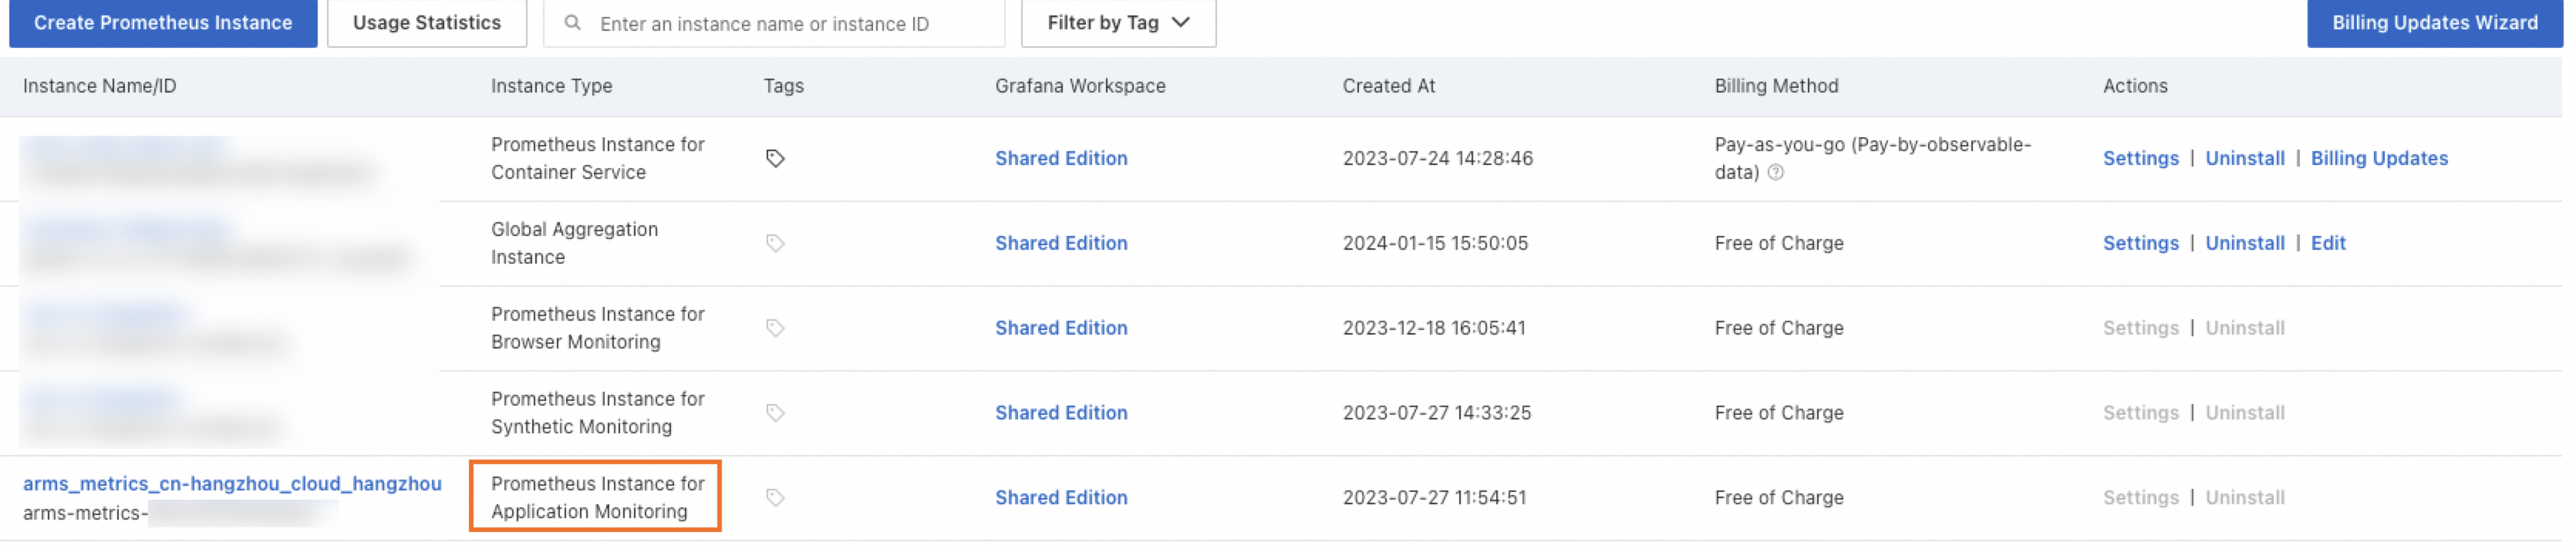
Click Shared Edition to open the Grafana page. Then, click Explore and select the name of the Prometheus instance as the data source.
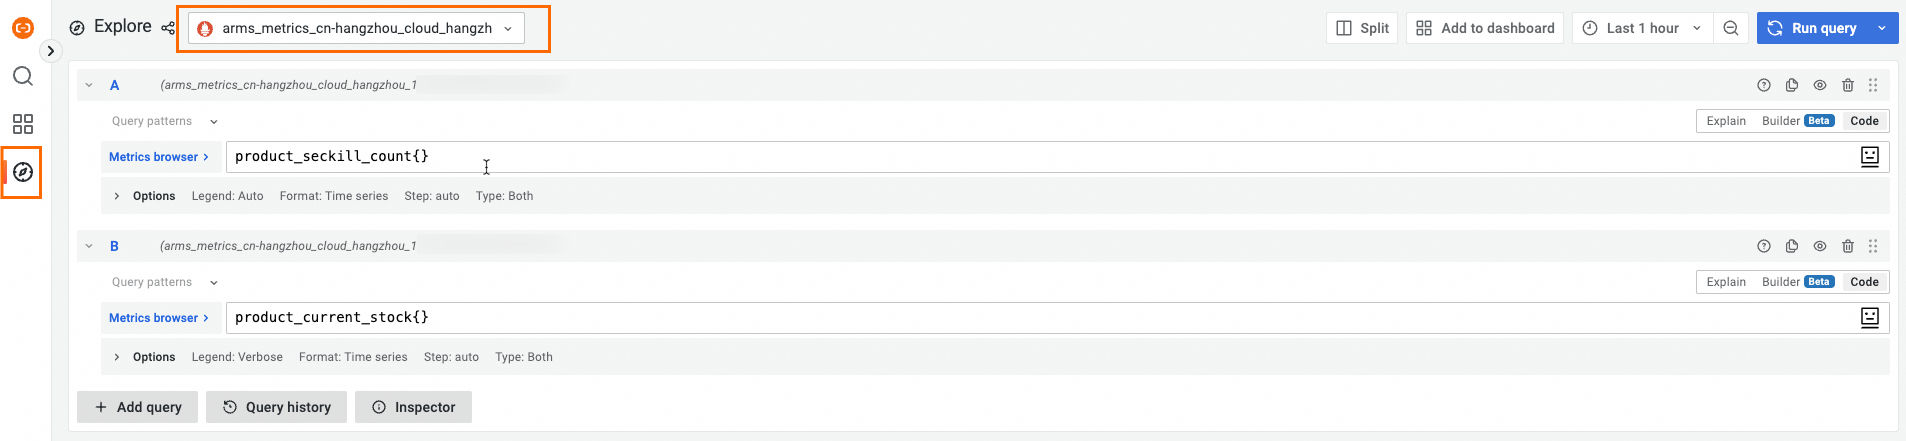
You can use Prometheus Query Language (PromQL) to query the metrics that you defined in the code, as shown in the following figure. You can also create a custom dashboard in Grafana.
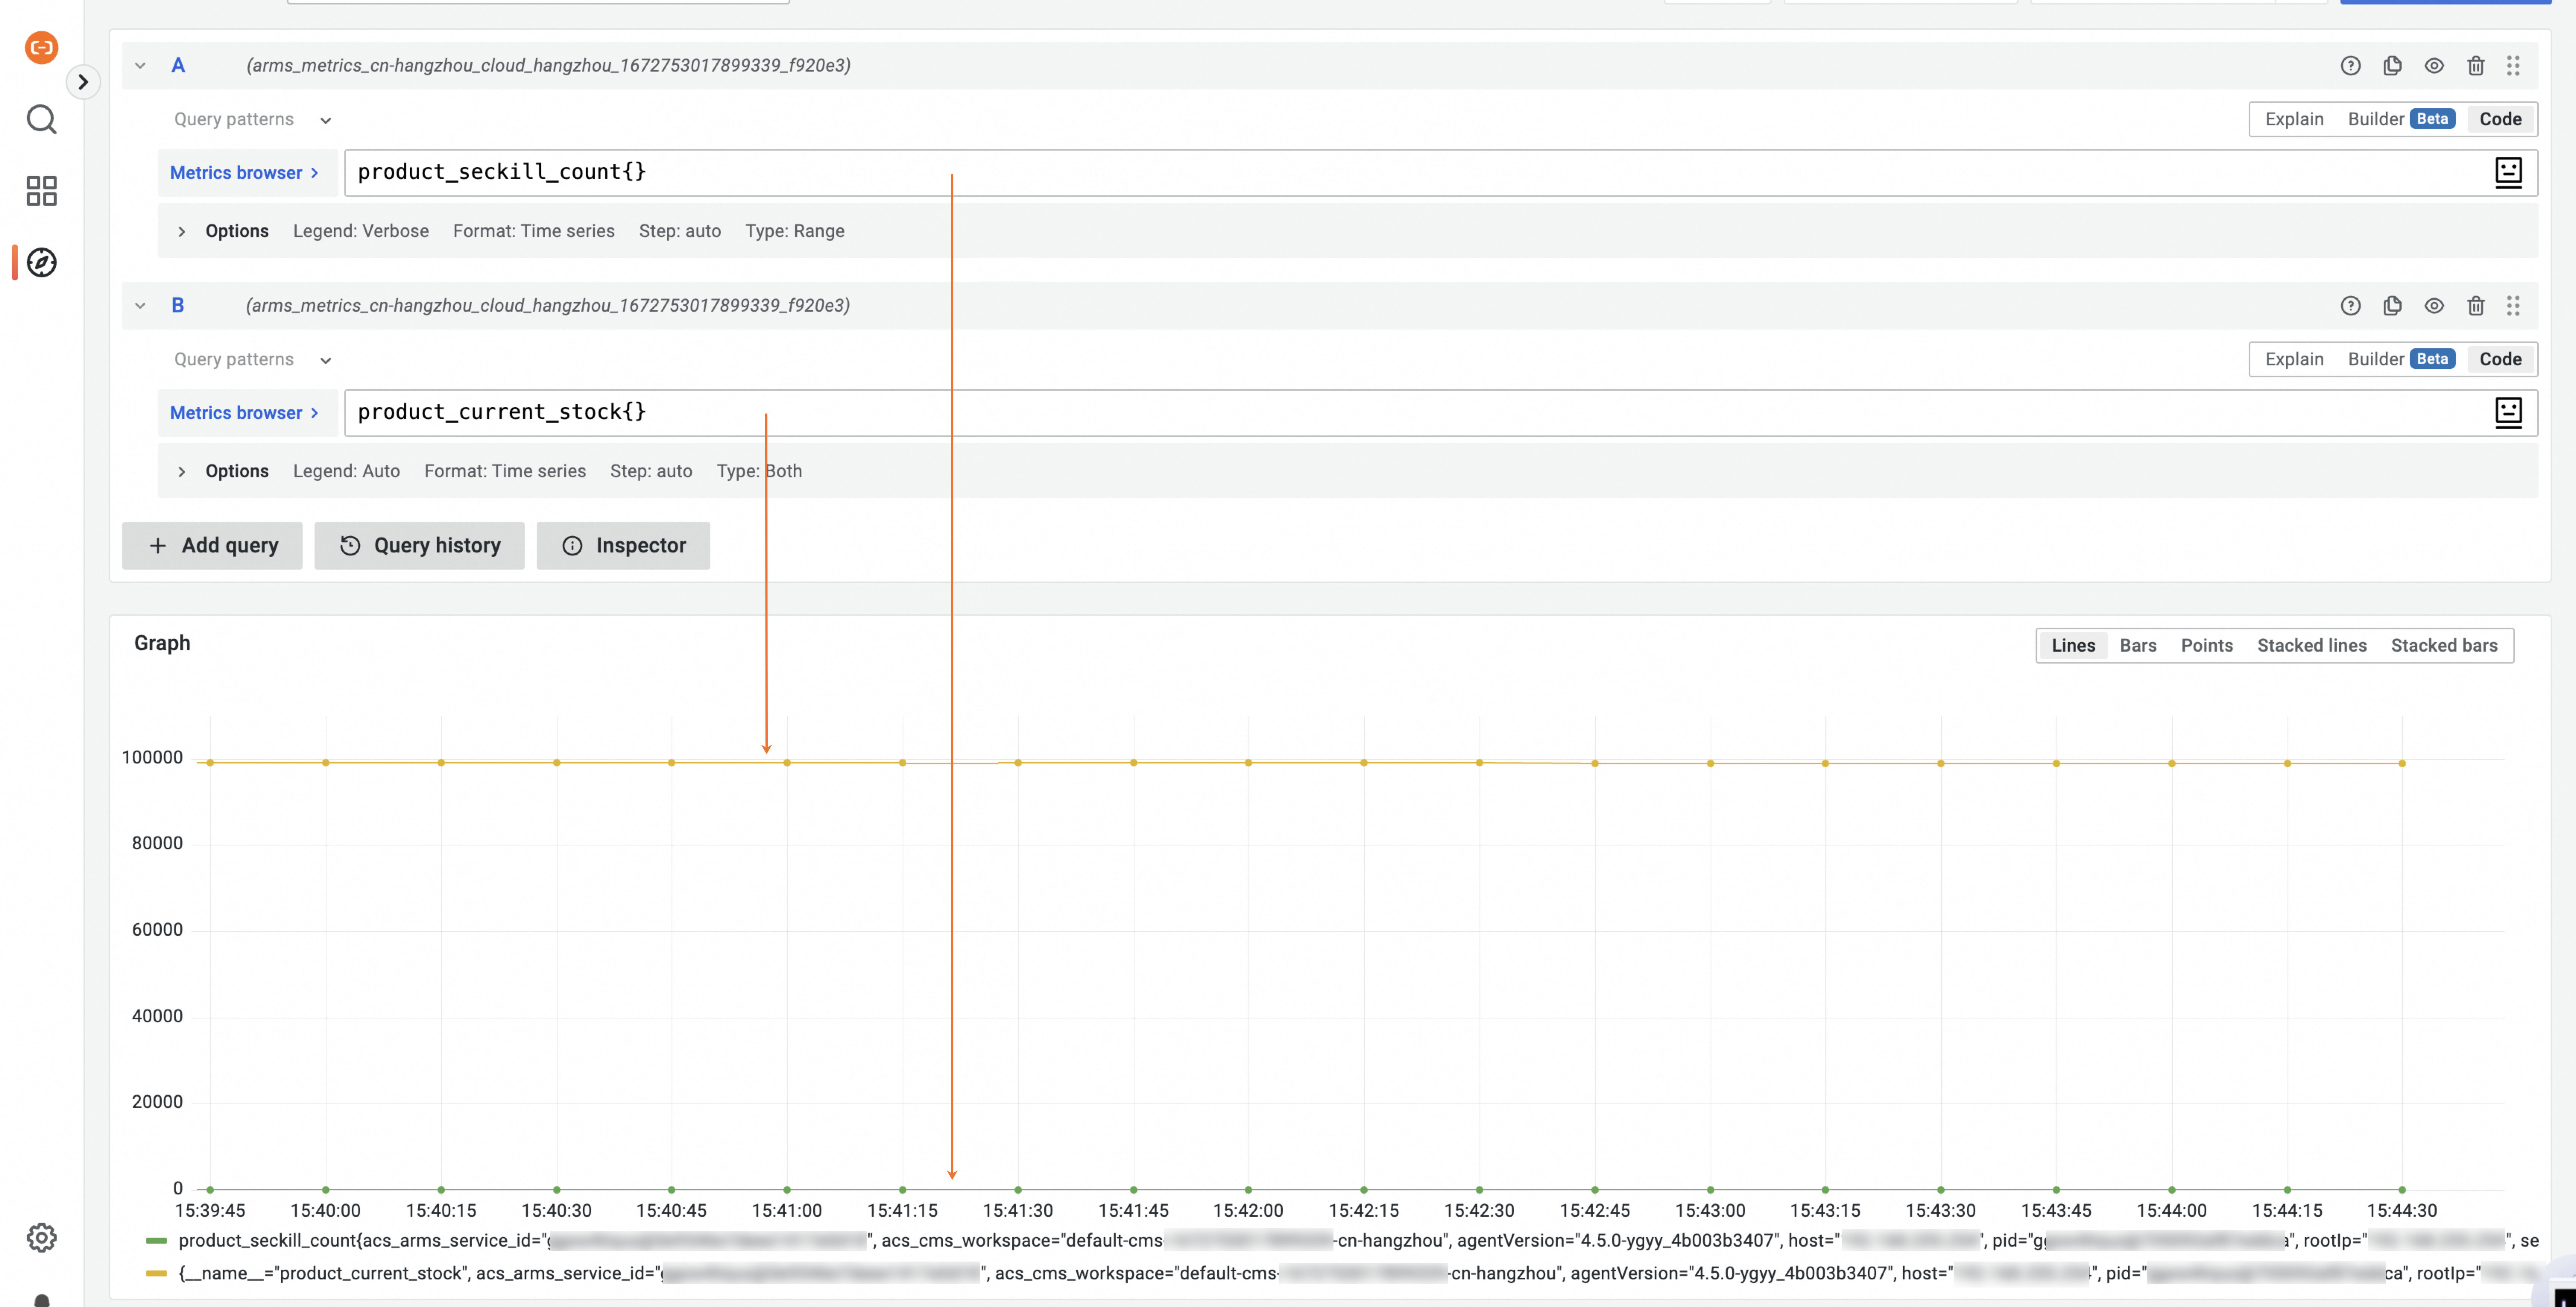
The metrics that you defined using the OpenTelemetry SDK are reported to and stored in the Prometheus instance in ARMS. You can then create alert rules for these metrics.
Notes
ARMS reports metrics every 15 seconds.
For Counter metrics, ARMS reports the increment for each 15-second reporting period, not the cumulative value.