A scheduled task can be created to automatically run a program or command on a one-time or recurring basis. You can query the details of a scheduled application monitoring task on the Application Real-Time Monitoring Service (ARMS) console. The details include task overview, analysis of SQL requests and NoSQL requests, exception analysis, error analysis, downstream services, and invocation traces.
Procedure
- Log on to the ARMS console. In the left-side navigation pane, choose .
- On the Applications page, select a region in the top navigation bar and click the name of the application that you want to manage. Note If the
 icon is displayed in the Language column, the application is connected to Application Monitoring. If a hyphen (-) is displayed, the application is connected to Tracing Analysis.
 - In the left-side navigation pane, click Timed Task. The scheduled tasks of your application are displayed in the left-side list on the scheduled tasks page.
- Click a scheduled task to view its details.
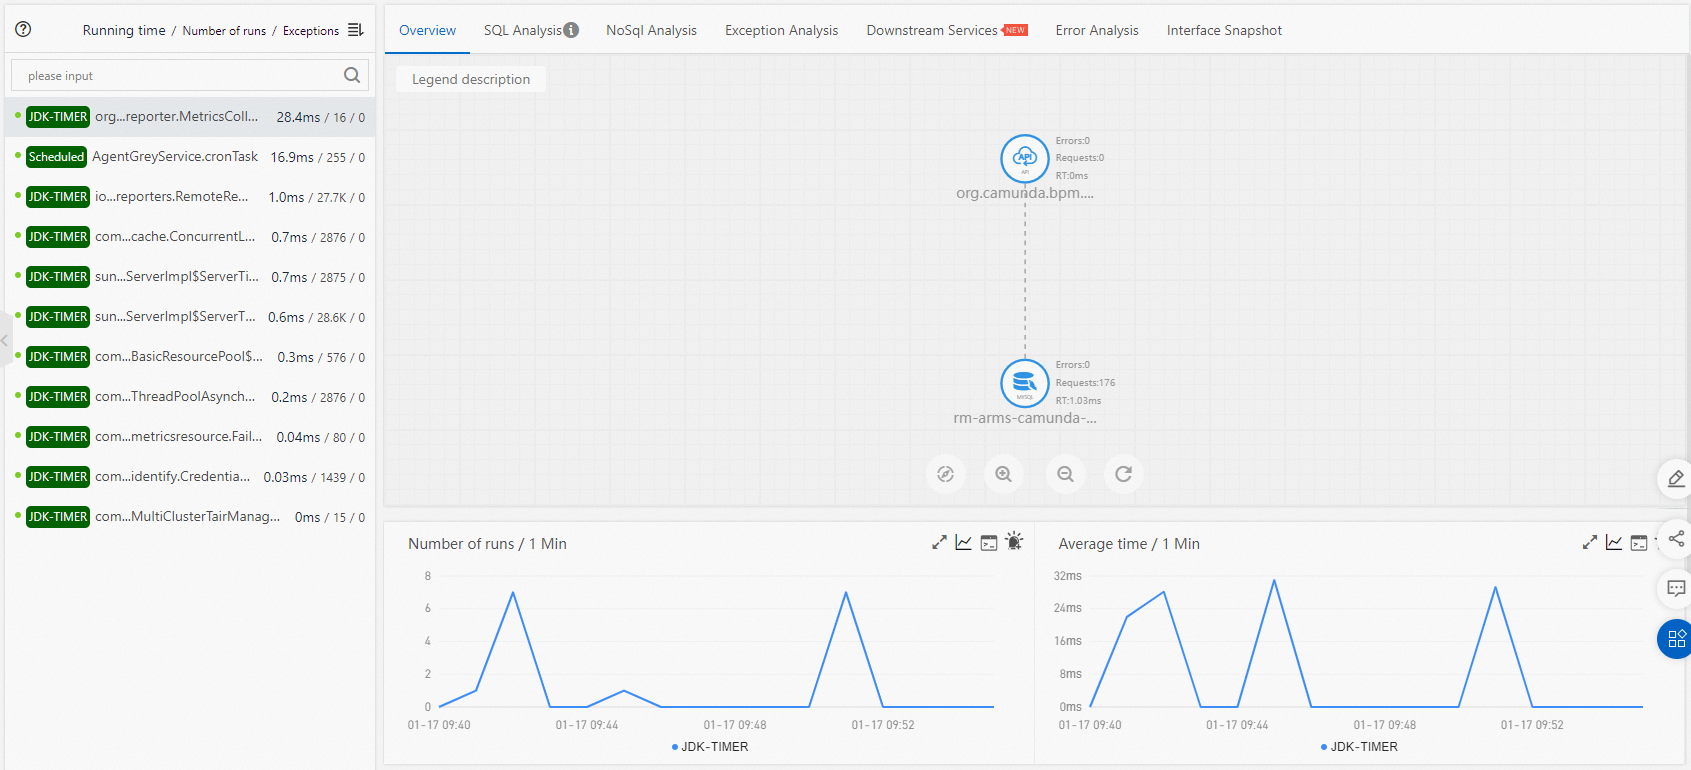
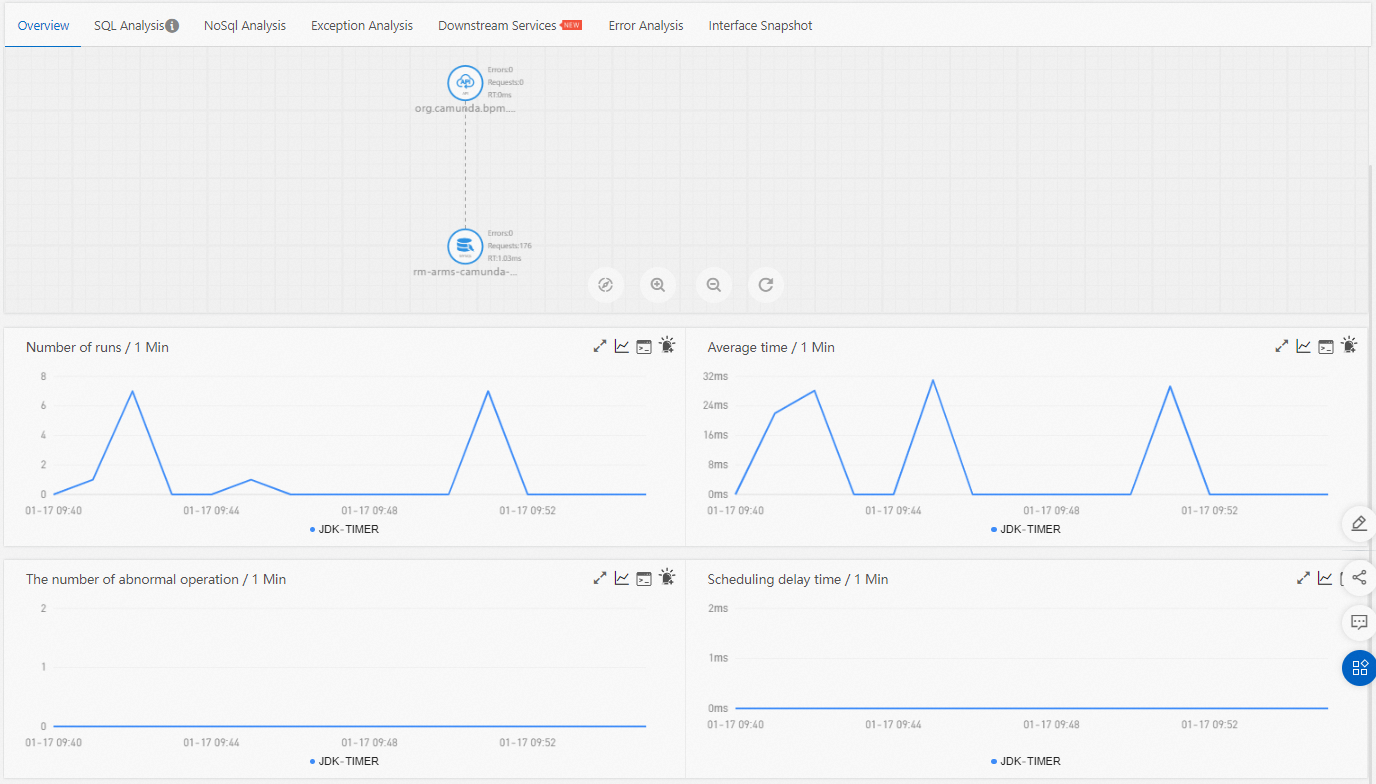
Overview
On the Overview tab, you can view the detailed call topology of the scheduled task and the time series charts of the number of runs, average running time, the number of exceptions, and scheduling latency.
SQL and NoSQL analysis
On the SQL Analysis and NoSql Analysis tabs, you can view the SQL and NoSQL requests that are initiated by the selected scheduled task. On these tabs, you can locate slow SQL statements or NoSQL statements that cause slow responses of an API.
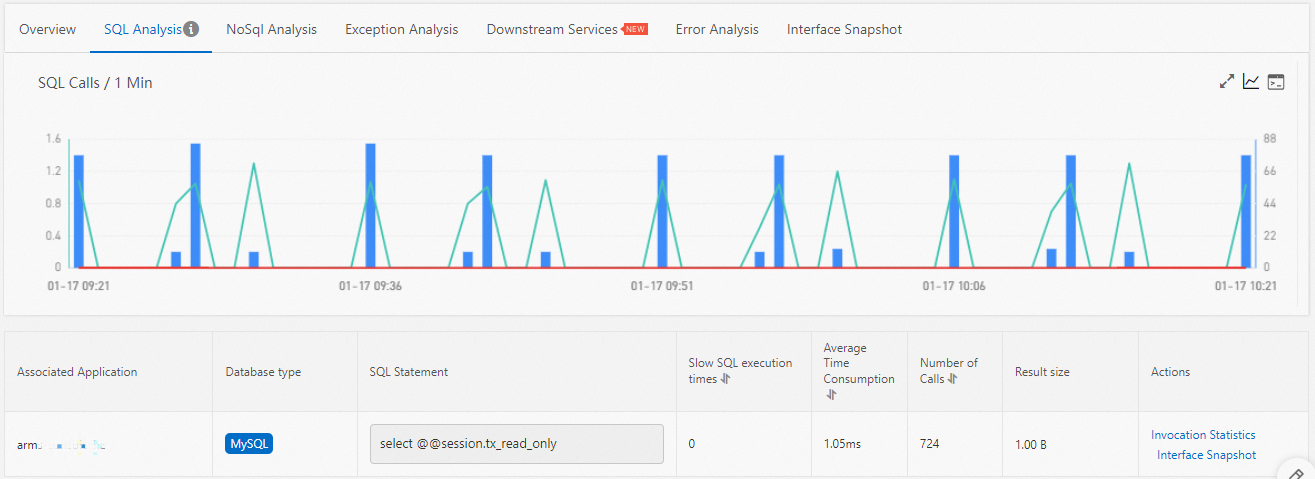
- Click Invocation Statistics in the Actions column to view the time series chart of the SQL or NoSQL call statistics.
- Click Invocation Trace Query in the Actions column to view the traces of an SQL or NoSQL statement. For more information, see View traces.
Exception analysis
On the Exception Analysis tab, you can view the Java exceptions that are thrown from the code of the scheduled task.
- Click Invocation Statistics in the Actions column to view the time series chart of an exception.
- Click Invocation Trace Query in the Actions column to view the traces of an exception. For more information, see View traces.
Error analysis
On the Error Analysis tab, you can view the error statistics of the scheduled task.
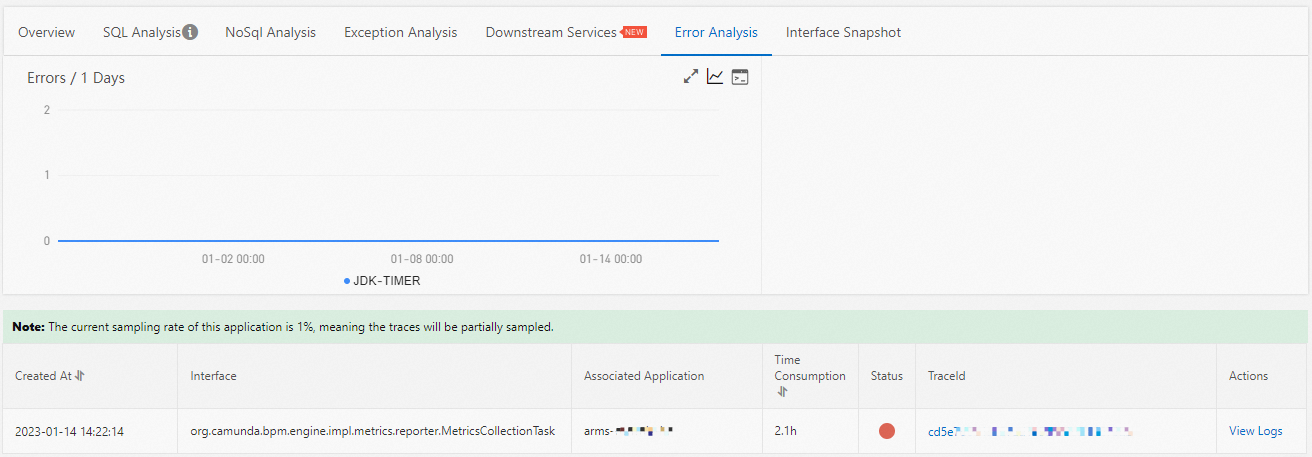
- To view a trace of an error, click the trace ID in the TraceId column. For more information, see Trace query.
- To view the logs of an error, click View Logs in the Actions column.
Downstream services
On the Downstream Services tab, you can view the APIs and performance metrics of the downstream services that are called by the application. The performance metrics include the response time, the number of requests, and the number of errors.
On the Downstream Services tab, perform the following operations as needed:
- Click Expand/Collapse All in the upper part of the tab to show or hide all APIs.
- Enter a keyword of the application name or the API name in the search box and click the Search icon to search for the APIs whose names contain the keyword.
- If you want to show or hide the information about the performance metrics of an API operation, find the API operation and click the collapse panel or click the upward arrow or downward arrow at the end of the row.
View traces
On the Interface Snapshot tab, you can view the details of traces and two charts that display the total number and response time of API calls.
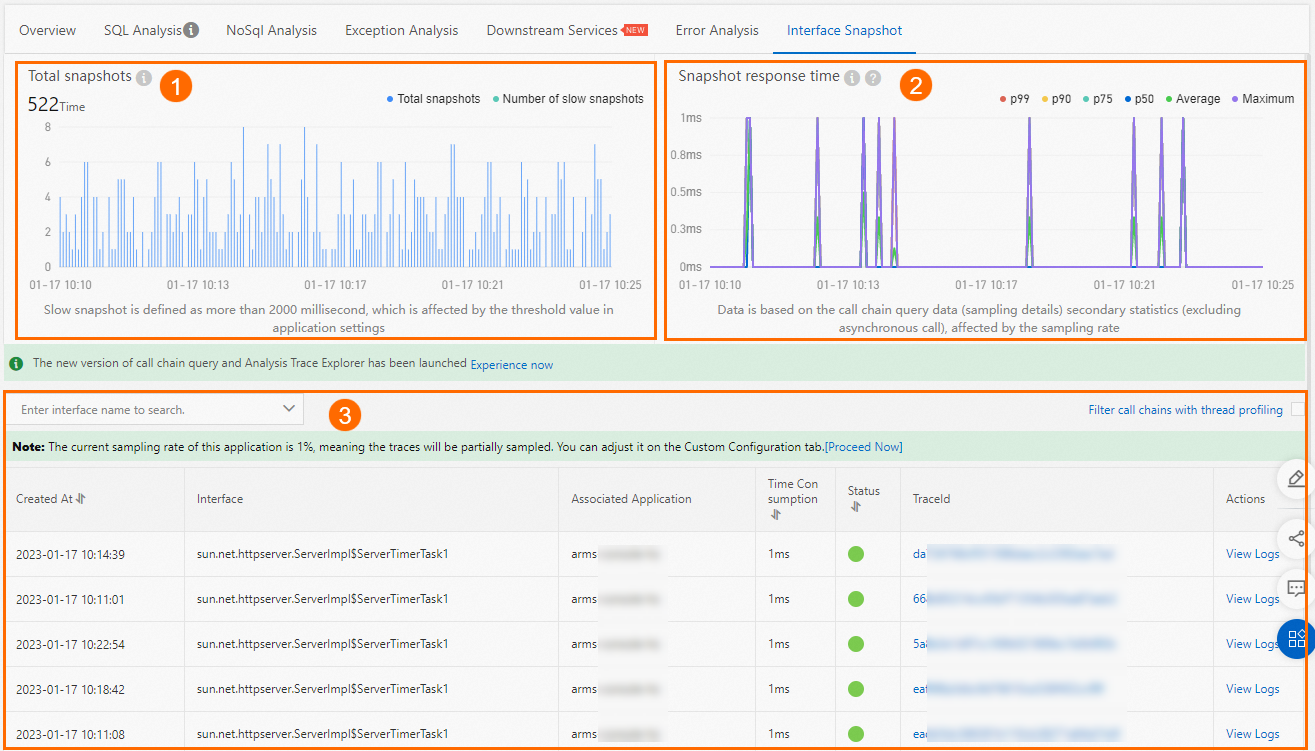
- The Total snapshots chart (icon 1) displays the numbers of normal traces and slow traces over time. The traces for which the response time of API calls exceeds 500 milliseconds are slow traces. The number of slow traces is affected by the value of the Interface Response Time Threshold parameter that you specified in the application configurations. Slow traces do not include the sub-traces that are performed for the asynchronous calls of on-premises APIs.
- The Snapshot response time chart (icon 2) displays the trends in response time over time. The chart is generated based on the statistics of API call tracing and is affected by the sampling rate that you specified.
- The trace details table (icon 3) displays the detailed trace information. You can click a value in the TraceId column to view the trace information. For more information, see Trace details. You can also click View Logs in the Actions column to view the logs of API calls.Note You must associate trace IDs with the business logs of an application. This way, when an error occurs in the application, you can access the business logs that are associated with trace IDs to troubleshoot the error. For more information, see Associate trace IDs with business logs.