This topic describes how to view attack protection reports for Anti-DDoS Origin from the previous year.
Report statistics
Timestamp range:
Anti-DDoS Origin (Non-Global): You can query data from August 8, 2024, onward.
Anti-DDoS Origin (Global): You can query data from September 17, 2025, onward.
Data precision: Attack analysis is based on data sampling, which may result in statistical errors.
View and download statistical reports
Go to the Statistical Reports page of the Traffic Security console.
Select Anti-DDoS Origin, set the instance, region, and timestamp range, and then click the
 icon.
icon.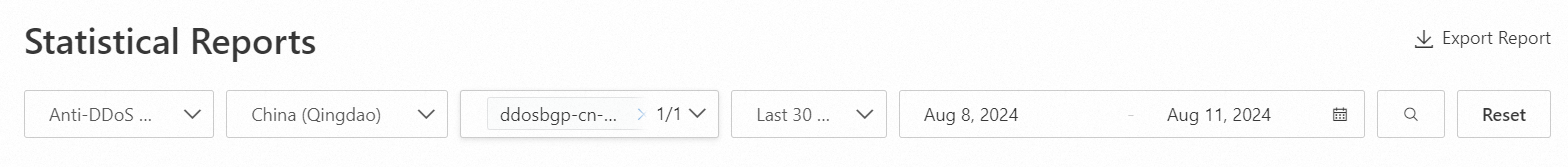 Note
NoteYou can select one or more instances in a specific region. You cannot select all instances across all regions.
In the upper-right corner, click Export Report to export the report in an image or PDF format.
Metric descriptions
Overall operational metrics
Metric | Description |
Data Metrics |
|
Traffic Scrubbing Events | The total number and type distribution of scrubbing events for the selected instance within the selected timestamp range. This does not include blackhole filtering events. |
Protected Assets | The number of protected assets (IP addresses). This data is independent of the selected time range and shows real-time data from the previous day (T-1). |
Traffic metrics
Metric | Description |
Traffic Trend in bit/s |
|
Top 5 Source Regions of Network Layer Attacks | The top 5 source regions of attacks, ranked by the number of requests from source IP addresses.
Statistical logic:
|
Attack distribution
Metric | Description |
Attack Type Distribution | The distribution of attacks, calculated based on the number of occurrences for each attack type. This does not include blackhole filtering events. |
Top 10 Attack Source ISPs | The distribution percentage of global Internet Service Providers (ISPs) for attack sources, based on the number of origin requests in attack events. Attack events include both scrubbing and blackhole filtering events. |
Volumetric Attacks by Peak Attack Throughput | The number of events corresponding to different peak attack throughput ranges. This does not include blackhole filtering events. The ranges are: 0 Gbit/s to 30 Gbit/s, 30 Gbit/s to 100 Gbit/s, 100 Gbit/s to 300 Gbit/s, 300 Gbit/s to 600 Gbit/s, and above 600 Gbit/s. |
Attack Duration Distribution | The number of events corresponding to different attack duration ranges. This does not include blackhole filtering events. The ranges are: 0 to 30 minutes, 30 to 60 minutes, 1 to 3 hours, 3 to 12 hours, and above 12 hours. |
Attack ranking metrics
Metric | Description |
Top 20 Source IP Addresses by Peak Attack Throughput | This metric displays the top 20 source IP addresses that have the highest peak attack throughput. The ranking is determined by the following logic:
|
Top 10 Destination IP Addresses by Peak Attack Throughput | This metric displays the top 10 destination IP addresses that have the highest peak attack throughput. The ranking is determined by the following logic:
|
Protection metrics
Top 10 Destination Ports by AttackThe Top 10 Destination Ports by Attack are ranked as follows:
For a single attack event, the system uses sampled traffic to rank destinations (IP address and port) by the number of discarded requests.
The system then compares the number of discarded requests across multiple attack events to select the top 10 destinations. For each destination, only the highest count is used, and a maximum of 10 unique destinations are retained.
Attack events
This section lists all attack events for the selected instance within the specified timestamp range. Click View Details in the Actions column of an event to go to the Attack Analysis page for more details.
References
For more information about the report metrics for Anti-DDoS Pro and Anti-DDoS Premium, see Statistical reports (Anti-DDoS Pro and Anti-DDoS Premium).