In Dataphin, you can analyze runtime metrics for real-time instances of the open-source Flink real-time computing engine. This analysis includes operations such as refreshing real-time instance information and displays data on failures, backpressure conditions, Sink outputs, and Checkpoint failures.
Permission description
You must have project space permissions to view the runtime analysis of a project.
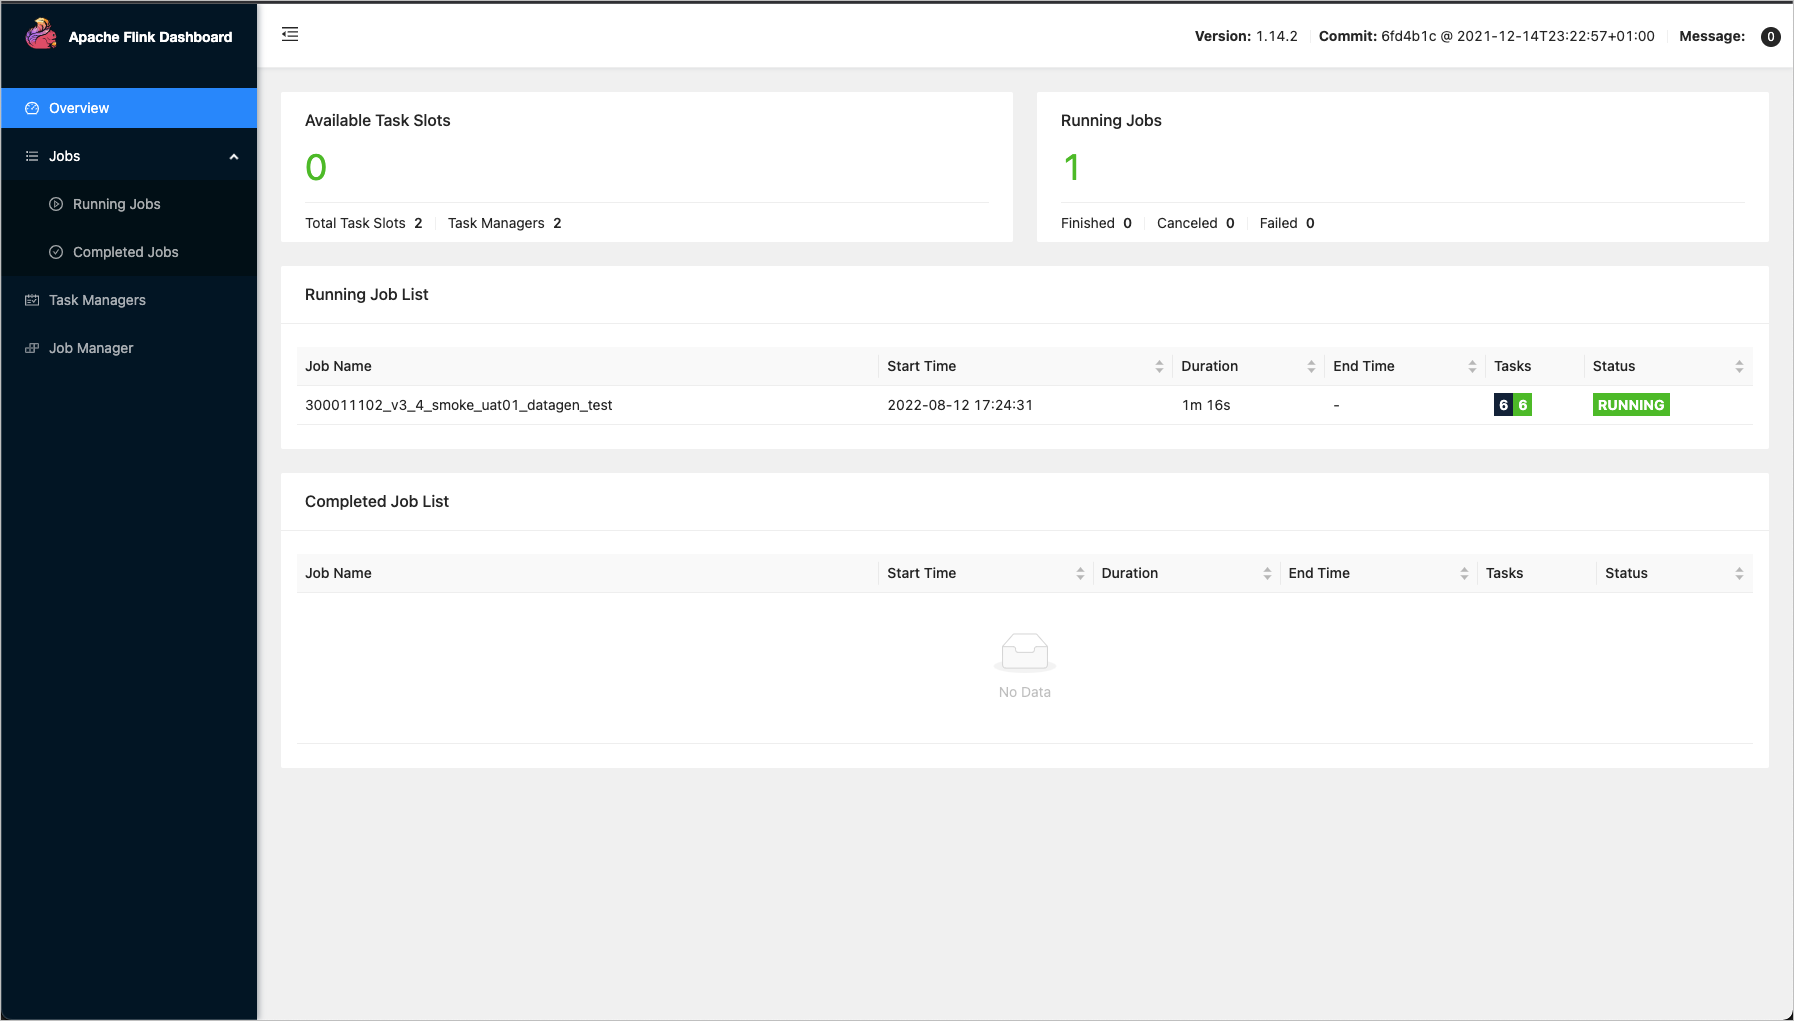
Access to the Apache Flink Dashboard requires a username and password. The dashboard provides prompt information for user roles including super administrators, system administrators, task owners, and project operation and maintenance owners.
Runtime analysis entry
From the Dataphin home page, click Development on the top menu bar to navigate to the data development page by default.
To view Runtime Analysis, follow these steps:
Click Operation and Maintenance -> select Project (Dev-Prod mode requires selecting the environment) -> click the Real-time Instance -> click the
 icon.
icon.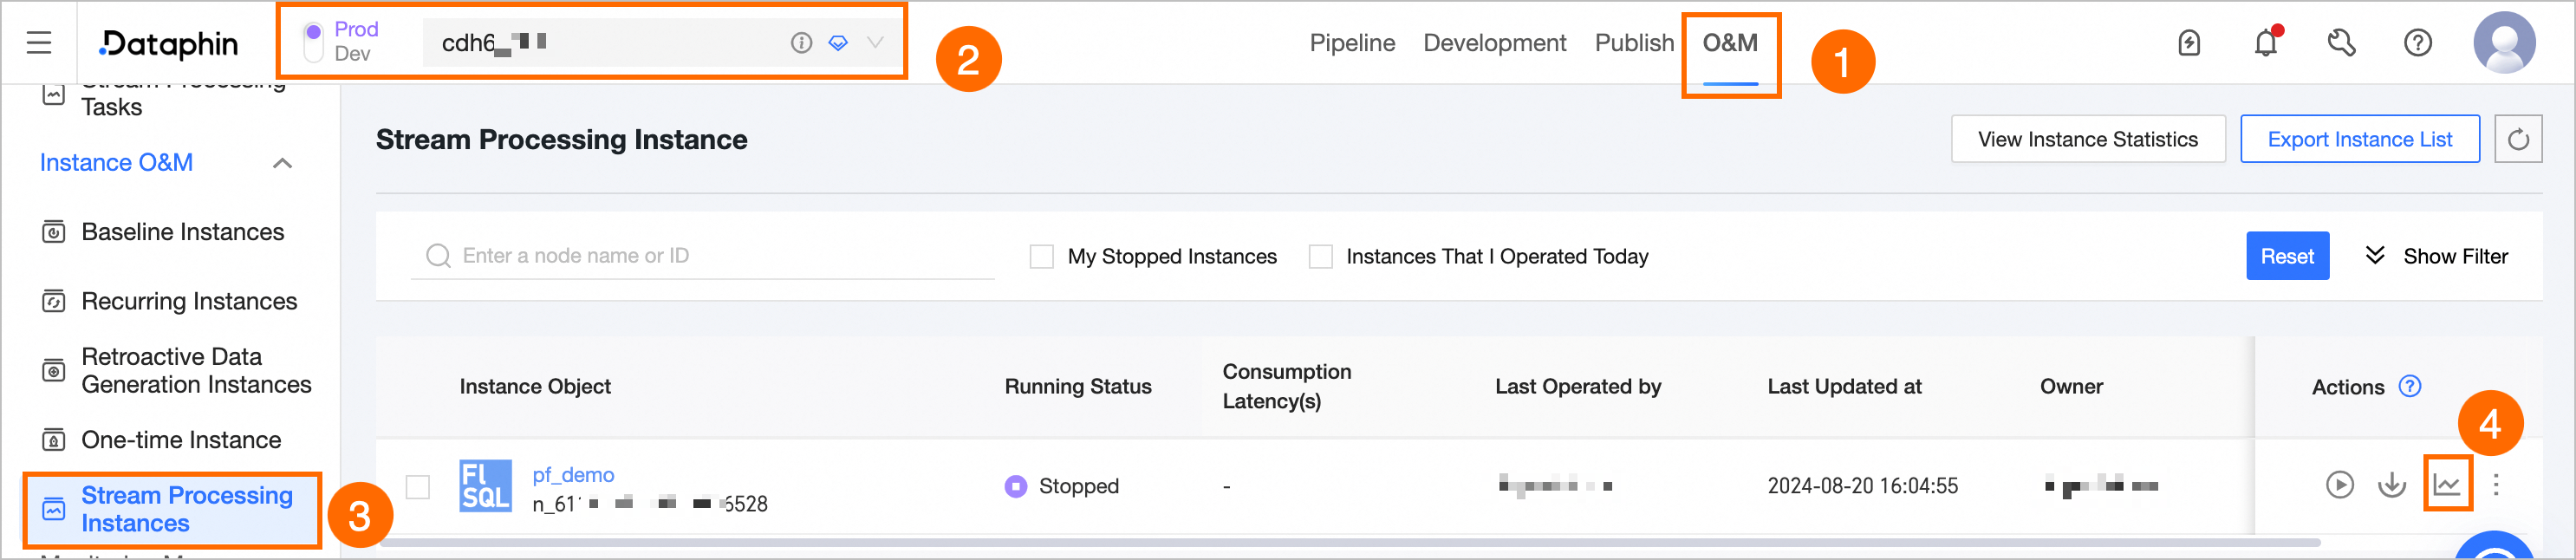
View runtime analysis
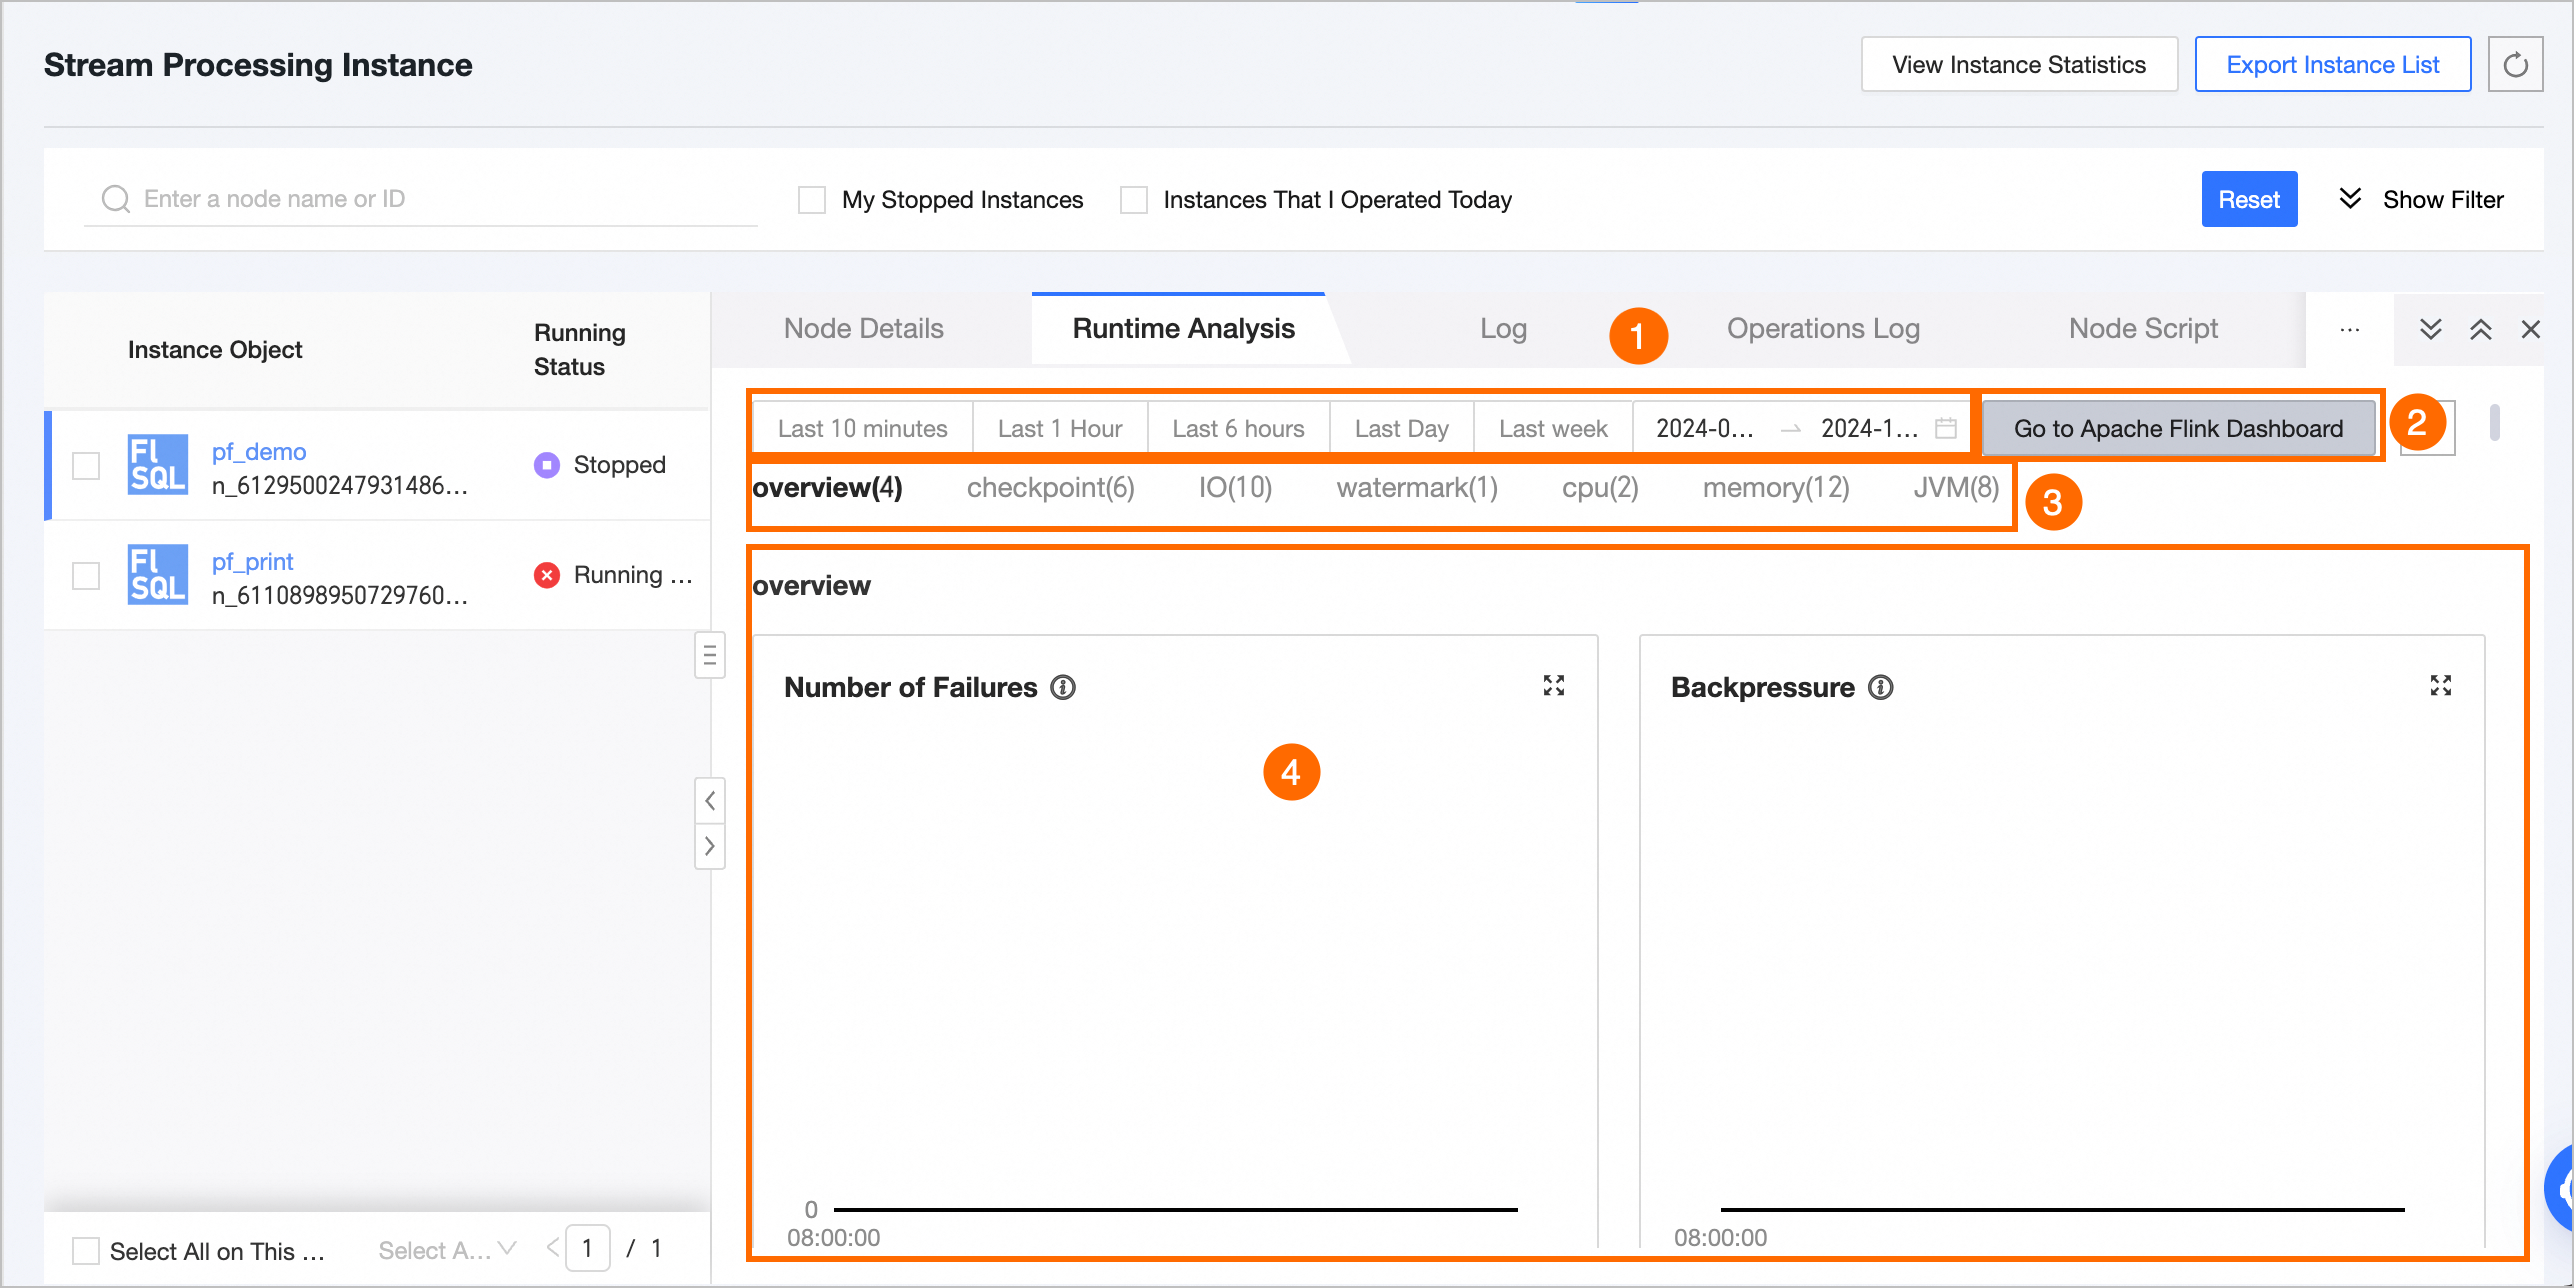
The runtime analysis page displays the running status of various metrics as illustrated below:
Feature | Description |
① Time Area Selection |
|
② Go To Apache Flink Dashboard and Refresh |
|
③ Real-time monitoring metrics | For Flink SQL or Flink Datastream tasks, you can view metrics such as overview, checkpoint, IO, watermark, CPU, memory, and JVM. For detailed descriptions of each metric, see Real-time monitoring metrics description. |
④ Metric data statistics | View the data status of each metric within the selected time period. |
Metric statistics description
If the selected time interval is less than or equal to 6 hours, you can view all data points collected every minute.
For time intervals greater than 6 hours and up to 24 hours, data points are collected every 5 minutes starting from the hour, with each point representing the count for the preceding 5 minutes.
For time intervals exceeding 24 hours, data points are collected every 10 minutes starting from the hour, with each point representing the count for the preceding 10 minutes.
Real-time monitoring metrics description
Overview
Monitoring metrics | Description | Unit |
Number of Failures | The count of task failures occurring within the specified time frame. | Times |
Backpressure Condition | Indicates if the task is experiencing backpressure during the current time frame, which occurs when it generates data at a faster rate than the downstream task can process. | Boolean |
Data Output of Each Sink | The throughput of each sink, measured in Transactions Per Second (TPS). | TPS |
Number of Checkpoint Failures | The count of checkpoint failures for tasks within the current time period. | Times |
Checkpoint
Monitoring metrics | Subtypes | Description | Unit |
Total number of Checkpoints (Num of Checkpoints) | Checkpoint Total Count (totalNumberOfCheckpoints) | Counts the total number of task Checkpoints for the specified time period. | Count |
Number of failed Checkpoints (numberOfFailedCheckpoints) | Indicates the number of task Checkpoints that failed during the current time period. | Count | |
Completed Checkpoints Count (numberOfCompletedCheckpoints) | Tallies the number of task Checkpoints completed within the current time period. | Count | |
Number of in-progress Checkpoints (numberOfInProgressCheckpoints) | Reflects the number of task Checkpoints that are currently in progress. | Count | |
Duration of the most recent checkpoint (lastCheckpointDuration) | Duration of the last Checkpoint (lastCheckpointDuration) | Measures the time taken to complete the most recent task Checkpoint. Extended Checkpoint duration or timeouts can result from factors like substantial state size, transient network problems, barrier misalignment, or data backpressure. | Milliseconds (ms) |
Last Checkpoint size (lastCheckpointSize) | Size of the last Checkpoint (lastCheckpointSize) | The size of the most recently uploaded Checkpoint, useful for analyzing performance issues during bottlenecks. | Bytes (Byte) |
IO
Monitoring metrics | Meaning | Monitoring metrics | Description | Unit |
Input rate: total bytes received per second. (numBytesIn PerSecond) | Provides insight into the upstream flow rate, aiding in the analysis of job traffic performance. | Local bytes read per second (numBytesInLocal PerSecond) | Measures the rate of bytes read locally each second. | Bytes |
Remote Bytes Read per Second (numBytesInRemote Per Second) | Measures the rate of bytes read remotely each second. | Bytes | ||
Local network buffer read rate (bytes per second) (numBuffersIn Local PerSecond) | Measures the rate of bytes read from the local network buffer each second. | Bytes | ||
Remote bytes read per second from network buffer (numBuffersIn Remote PerSecond) | Measures the rate of bytes read from the remote network buffer each second. | Bytes | ||
Output rate: total bytes sent per second. (numBytesOut PerSecond) | Provides insight into the output condition of upstream throughput, aiding in the analysis of job traffic performance. | Bytes Output per Second (numBytesOut per Second) | Measures the rate of bytes sent each second. | Bytes |
Network buffer bytes output per second (numBuffersOut PerSecond) | Measures the rate of bytes sent from the network buffer each second. | Bytes | ||
Subtask I/O: total records processed per second. (Task numRecords I/O PerSecond) | Enables identification of potential I/O bottlenecks in the job and assessment of their severity. | Records received per second (numRecordsIn PerSecond) | Measures the number of records received each second. | Count |
Records sent per second (numRecordsOut PerSecond) | Measures the number of records sent each second. | Count | ||
Subtask I/O: total records processed. (Task numRecords I/O) | Enables identification of potential I/O bottlenecks in the job. | Total records received (numRecordsIn) | Measures the total number of records received. | Count |
Total records transmitted (numRecordsOut) | Measures the total number of records sent. | Count |
Watermark
Monitoring metrics | Description | Unit |
Last Watermark Timestamp for Each Task (Task InputWatermark) | Indicates the time the last Watermark was received by each task, reflecting the data reception delay by the Task Manager (TM). | Milliseconds (ms) |
CPU
Monitoring metrics | Description | Unit |
Single JM CPU utilization (JM CPU Load) | Measures the CPU load for a single JobManager (JM). A value consistently over 100% suggests high CPU load, potentially leading to performance issues such as system lag and delayed response times. | Count |
Single TM CPU utilization (TM CPU Load) | Indicates the CPU time slice utilization by a single TaskManager (TM) within Flink. A reading of 100% signifies full utilization of one core, with 400% indicating full utilization of four cores. Persistent values above 100% denote high CPU load. Conversely, low CPU utilization coupled with high load may result from excessive read/write operations leading to numerous uninterruptible sleep states. | Count |
Memory
Monitoring metrics | Subtypes | Description | Unit |
JM heap memory (JM Heap Memory) | JM heap memory used (JM Heap Memory Used) | The amount of heap memory currently in use by the JobManager. | Bytes |
JM heap memory committed (JM Heap Memory Committed) | The amount of heap memory guaranteed to be available to the JobManager by the JVM. | Bytes | |
JM heap memory max (JM Heap Memory Max) | The maximum amount of heap memory that can be used by the JobManager. | Bytes | |
JM non-heap memory (JM NonHeap Memory) | JM non-heap memory used (JM NonHeap Memory Used) | The amount of non-heap memory currently in use by the JobManager. | Bytes |
JM non-heap memory committed (JM NonHeap Memory Committed) | The amount of non-heap memory guaranteed to be available to the JobManager by the JVM. | Bytes | |
JM non-heap memory max (JM NonHeap Memory Max) | The maximum amount of non-heap memory that can be used by the JobManager. | Bytes | |
TM heap memory (TM Heap Memory) | TM heap memory used (TM Heap Memory Used) | The amount of heap memory currently in use by the TaskManager. | Bytes |
TM heap memory committed (TM Heap Memory Committed) | The amount of heap memory guaranteed to be available to the TaskManager by the JVM. | Bytes | |
TM heap memory max (TM Heap Memory Max) | Maximum TM heap memory | Bytes | |
TM non-heap memory (TM NonHeap Memory) | TM non-heap memory used (TM NonHeap Memory Used) | The amount of non-heap memory currently in use by the TaskManager. | Bytes |
TM non-heap memory committed (TM NonHeap Memory Committed) | The amount of non-heap memory guaranteed to be available to the TaskManager by the JVM. | Bytes | |
TM non-heap memory max (TM NonHeap Memory Max) | The maximum amount of non-heap memory that can be used by the TaskManager. | Bytes |
JVM
Monitoring metrics | Description | Unit |
JM active threads (JM Threads) | The number of active threads in the JobManager (JM). Excessive JM threads can consume significant memory, compromising job stability. | Count |
TM active threads (TM Threads) | The number of active threads in the TaskManager (TM), aggregated by TM, with multiple TMs displayed on separate lines. | Count |
JM young generation garbage collector runtime (JM GC Time) | The runtime of the young generation garbage collector in the JobManager (JM). Prolonged garbage collection times can lead to excessive memory usage, impacting job performance. This metric is useful for diagnosing job-level issues. | Milliseconds (ms) |
TM young generation garbage collector runtime (TM GC Time) | The runtime of the young generation garbage collector in the TaskManager (TM). Extended garbage collection times can lead to excessive memory usage, impacting job performance. This metric is useful for diagnosing job-level issues. | Milliseconds (ms) |
JM young generation garbage collector count (JM GC Count) | The count of young generation garbage collections in the JobManager (JM). A high number of garbage collection events can consume significant memory, affecting job performance. This metric is useful for diagnosing job-level issues. | Count |
TM young generation garbage collector count (TM GC Count) | The count of young generation garbage collections in the TaskManager (TM). An excessive number of garbage collection events can consume significant memory, affecting job performance. This metric is useful for diagnosing task-level issues. | Count |
Total classes loaded by TM since JVM startup (TM ClassLoader) | The total number of classes loaded by the TaskManager (TM) since the Java Virtual Machine (JVM) startup. A large number of classes loaded or unloaded can consume significant memory, impacting job performance. | Count |
Total classes loaded by JM since JVM startup (JM ClassLoader) | The total number of classes loaded by the JobManager (JM) since the Java Virtual Machine (JVM) startup. A large number of classes loaded or unloaded can consume significant memory, impacting job performance. | Count |