This topic describes the results of performance tests detailed in the "Test plan overview" topic.
Background information
The test results in this topic were obtained from tests performed in a Hologres instance deployed on Alibaba Cloud public cloud.
Results of tests that use a TPC-H dataset of 100 GB
The following tables describe the number of rows in each table and instance specifications used for TPC-H performance tests.
Number of rows in each table
Table name
Number of rows
LINEITEM
600,037,902
ORDERS
150,000,000
PARTSUPP
80,000,000
PART
15,000,000
CUSTOMER
20,000,000
SUPPLIER
1,000,000
NATION
25
REGION
5
Instance specifications
Computing resource
Zone
Note
64 CUs (64 CPU cores and 256 GB of memory)
Hangzhou Zone J
Use the default configurations of the instance. The number of shards is 40.
128 CUs (128 CPU cores and 512 GB of memory)
Hangzhou Zone J
Use the default configurations of the instance. The number of shards is 80.
Test results
OLAP query performance
The time required to query data from Hologres internal tables is measured in seconds. The following table lists the execution duration of each query in Hologres. As the instance specifications increase, the execution duration decreases linearly.
TPC-H
Query ID
TPC-H 100 GB
TPC-H 100 GB
64 CUs (V3.1.3)
128 CUs (V3.1.3)
64 CUs (V2.2.19)
128 CUs (V2.2.19)
1
0.48
0.36
0.55
0.34
2
0.19
0.18
0.17
0.15
3
0.43
0.28
0.38
0.29
4
0.26
0.15
0.32
0.19
5
0.53
0.41
0.68
0.48
6
0.1
0.12
0.10
0.08
7
0.48
0.34
0.55
0.36
8
0.48
0.37
0.51
0.38
9
1.52
0.91
1.62
1.00
10
0.81
0.43
0.69
0.47
11
0.19
0.17
0.37
0.32
12
0.19
0.14
0.22
0.15
13
0.53
0.36
0.67
0.37
14
0.19
0.13
0.19
0.13
15
0.34
0.19
0.36
0.23
16
0.35
0.29
0.41
0.33
17
0.21
0.18
0.22
0.16
18
1.57
0.89
2.02
0.94
19
0.26
0.19
0.25
0.17
20
0.24
0.22
0.24
0.27
21
0.79
0.56
1.03
0.63
22
0.26
0.18
0.28
0.22
Total
10.4
7.05
11.83
7.66
Key/Value point query performance
The test results are based on queries in Hologres internal tables. The software version is r1.1.42. Each type of query runs continuously for 5 minutes. The following table shows the specific values in the test results. As the instance specifications increase, the QPS increases linearly.
Scenario
Sample SQL statement
Instance specifications
Number of concurrent clients
QPS (including connection time)
QPS (excluding connection time)
Average query latency
1
SELECT  O_ORDERKEY
        ,O_CUSTKEY
        ,O_ORDERSTATUS
        ,O_TOTALPRICE
        ,O_ORDERDATE
        ,O_ORDERPRIORITY
        ,O_CLERK
        ,O_SHIPPRIORITY
        ,O_COMMENT
FROM    public.orders_row
WHERE   o_orderkey = {parameter}
;
64 CUs
500
112,435
112,443
4.447 ms
128 CUs
1,000
242,755
242,772
4.119 ms
2
SELECT  O_ORDERKEY
        ,O_CUSTKEY
        ,O_ORDERSTATUS
        ,O_TOTALPRICE
        ,O_ORDERDATE
        ,O_ORDERPRIORITY
        ,O_CLERK
        ,O_SHIPPRIORITY
        ,O_COMMENT
FROM    public.orders_row
WHERE   o_orderkey in
(
    {parameter1},
    {parameter2},
    {parameter3},
    {parameter4},
    {parameter5},
    {parameter6},
    {parameter7},
    {parameter8},
    {parameter9}
);
64 CUs
500
27,632
27,634
18.094 ms
128 CUs
1,000
90,086
90,092
11.100 ms
Data write performance
The import time indicates the time required to import data to Hologres internal tables, measured in seconds. The following table lists the import time in different scenarios that provide 64 CUs of computing resources.
NoteIf you execute the COPY statement to import data, data is imported from one file to one table in Hologres at a time. Concurrent import is unavailable.
Table name
Number of rows
Data size
Time required to import data over the Internet by using COPY
Time required to import data in a VPC by using COPY
Time required to import data by using a MaxCompute foreign table
LINEITEM
600,037,902
73.6 GB
3,070.453
694.364
148.165
ORDERS
150,000,000
16.4 GB
691.060
172.529
37.741
PARTSUPP
80,000,000
2.3 GB
468.560
107.092
18.488
PART
20,000,000
11.3 GB
96.342
24.020
8.083
CUSTOMER
15,000,000
2.3 GB
95.190
22.937
10.363
SUPPLIER
1,000,000
132 MB
5.057
1.803
1.503
NATION
25
2 KB
0.580
0.584
0.747
REGION
5
0.375 KB
0.168
0.153
0.430
ORDERS_ROW
150,000,000
16.4 GB
717,653
143.800
25.676
Total
122.4 GB
722,080.410
1,167.282
251.196
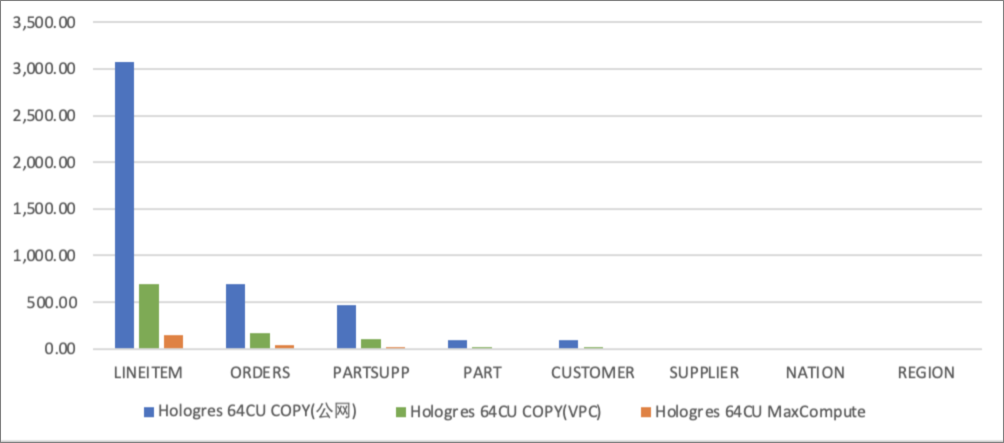
In the following bar chart, a blue bar indicates the time required to import data over the Internet by using the COPY statement. A green bar indicates the time required to import data in a virtual private cloud (VPC) by using the COPY statement. A gray bar indicates the time required to import data by using a MaxCompute foreign table. A smaller y-axis value indicates a faster import speed.
NoteThe x-axis represents the table name, and the y-axis represents the import time measured in seconds.
The following conclusions can be drawn based on the bar chart:
If you execute the COPY statement to import data, the import time is affected by the bandwidth. The time required to import data in a VPC is shorter than the time required to import data over the Internet.
The time required to import data by using a MaxCompute foreign table is shorter than the time required to import data by executing the COPY statement.
Data update performance
The test results are based on data updates in Hologres internal tables. The software version is r1.1.42. Each type of query runs continuously for 5 minutes. The following table shows the specific values in the test results. As the instance specifications increase, the QPS increases linearly.
Sample SQL statement
Instance specifications
Number of concurrent clients
QPS (including connection time)
QPS (excluding connection time)
Average query latency
INSERT INTO public.orders_row(
    o_orderkey
    ,o_custkey
    ,o_orderstatus
    ,o_totalprice
    ,o_orderdate
    ,o_orderpriority
    ,o_clerk
    ,o_shippriority
    ,o_comment
) VALUES (
  {parameter}
  ,1
  ,'demo'
  ,1.1
  ,'2021-01-01'
  ,'demo'
  ,'demo'
  ,1
  ,'demo')
on conflict(o_orderkey)
do update set (
  o_orderkey
  ,o_custkey
  ,o_orderstatus
  ,o_totalprice
  ,o_orderdate
  ,o_orderpriority
  ,o_clerk
  ,o_shippriority
  ,o_comment
)= ROW(excluded.*);
64 CUs
500
92,006
92,000
5.435 ms
128 CUs
1,000
191,761
191,771
5.215 ms
Results of tests that use a TPC-H dataset of 1 TB
The following tables describe the number of rows in each table and instance specifications used for TPC-H performance tests.
Number of rows in each table
Table name
Number of rows
Data size
LINEITEM
5,999,989,709
752.27 GB
ORDERS
1,500,000,000
167.11 GB
PARTSUPP
800,000,000
114.45 GB
PART
150,000,000
22.94 GB
CUSTOMER
200,000,000
22.85 GB
SUPPLIER
10,000,000
1.33 GB
NATION
25
2.15 KB
REGION
5
0.38 KB
Instance specifications
Computing resource
Storage capacity
Remarks
96 CUs
(96 CPU cores and 384 GB of memory)
1,000 GB
Use the default configurations of the instance. The number of shards is 60.
Test results: OLAP query performance
The amount of time required to query data in Hologres internal tables is measured in seconds. The following table lists the execution duration of each query in Hologres.
TPC-H query ID
Query time (V4.0.4)
Query time (V3.1.3)
Query time (V3.0.5)
1
3.07
3.00
8.47
2
0.34
0.39
0.36
3
3.98
3.60
5.77
4
1.53
1.78
1.71
5
4.55
4.68
7.65
6
0.27
0.32
0.34
7
3.48
3.25
3.56
8
1.97
2.34
5.61
9
13.28
13.94
16.83
10
4.33
5.89
5.61
11
1.79
2.42
2.23
12
0.69
0.93
0.84
13
4.56
4.58
5.78
14
0.78
0.83
0.79
15
1.87
1.96
2.27
16
2.02
1.85
1.64
17
0.93
1.05
4.64
18
11.51
13.08
13.74
19
0.86
1.45
3.00
20
0.76
1.22
0.95
21
4.73
5.15
7.20
22
2.72
2.57
2.17
Total
69.99
76.27
101.16
Test results of using Realtime Compute for Apache Flink to write data to Hologres in real time
Dataset information
Hologres instance
Computing resource
Software version
Remarks
64 CUs (64 CPU cores and 256 GB of memory)
r1.1.53
Use the default configurations of the instance. The number of shards is 40.
Fully managed Flink
Engine version
vvr-4.0.12-flink-1.13
Configuration mode
Basic mode
Parallelism
15
Job Manager CPU
1
Job Manager memory
1 GiB
Task Manager CPU
1
Task Manager memory
6 GiB
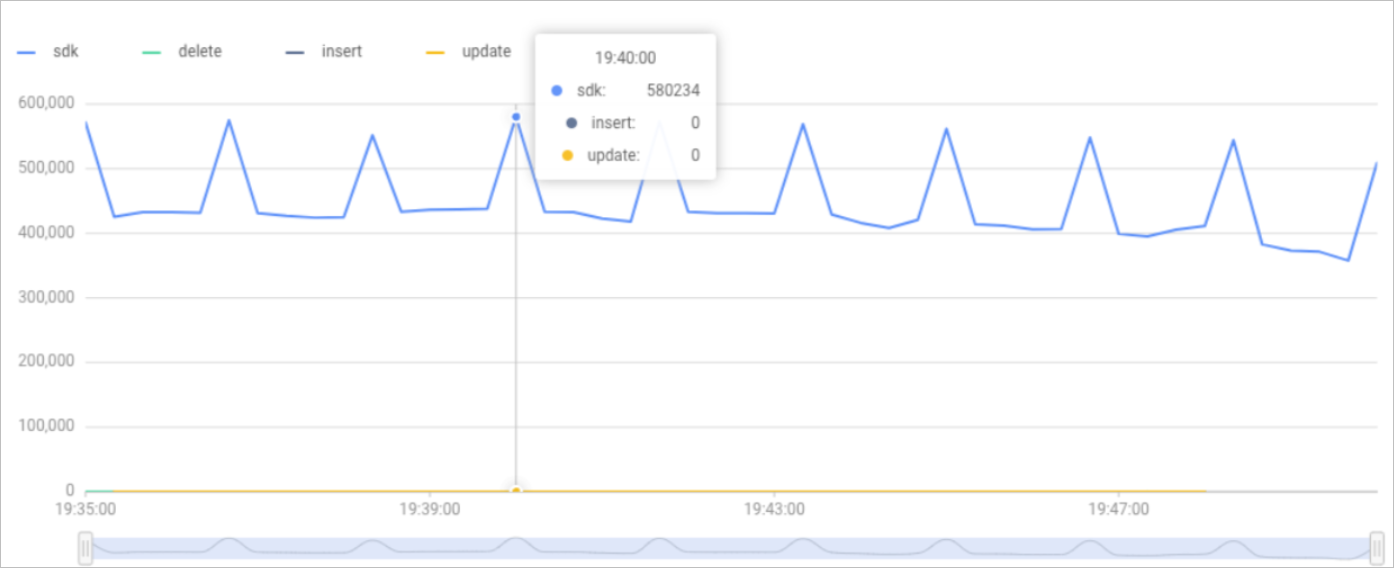
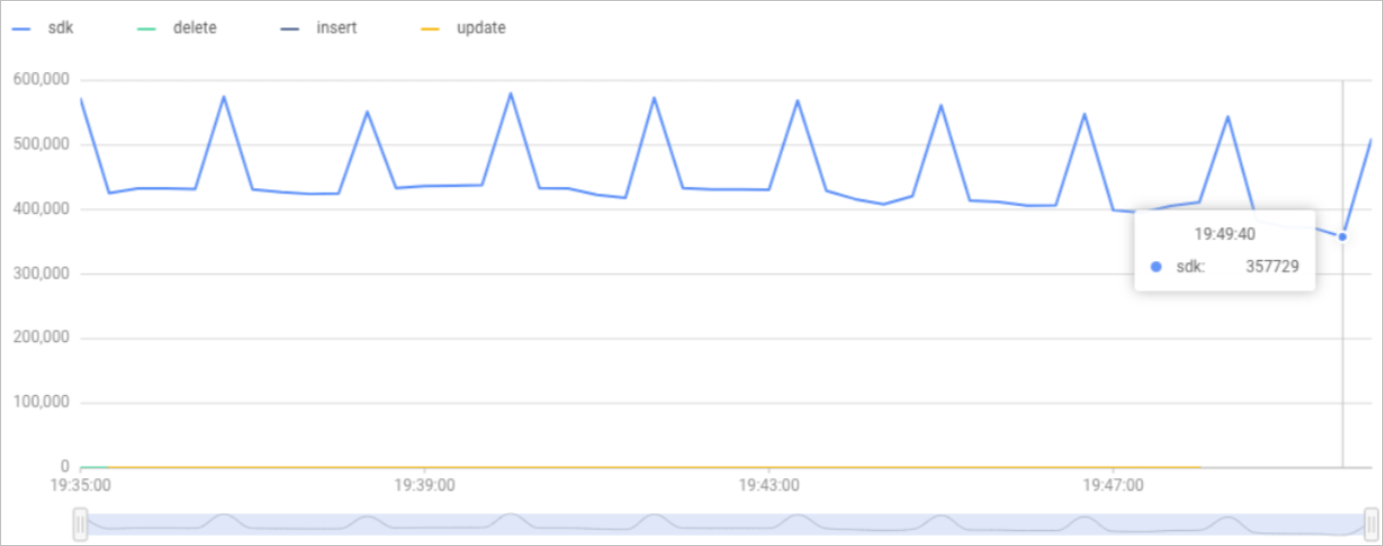
Test results
The following figure shows the test results. From 19:35 to 19:50 on April 8, 2022, the maximum records per second (RPS) is
580,234and the minimum RPS is357,729.