Issue 1
When you perform JMeter debugging, no results are generated in the sampling log for more than five minutes. When you switch to the engine log, the keyword CannotResolveClassException appears, as shown in the following figure. The example in the following figure indicates that the corresponding plug-in is missing for WebSocket stress testing.

Cause
Dependencies in the JMeter script are not uploaded.
Solution
In the Performance Testing Service (PTS) console, upload the JAR package of the JMeter plug-in that the script depends on. For more information, see Create a JMeter scenario.
Issue 2
When you perform JMeter debugging, no results are generated in the sampling log for more than five minutes, and no errors are recorded in the engine log.
Cause
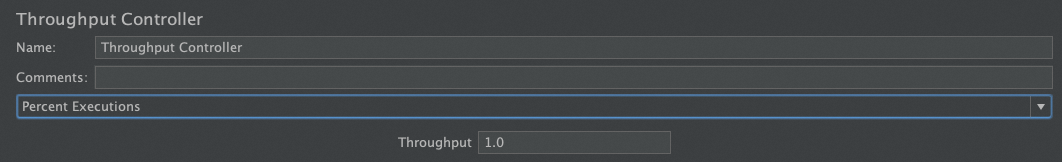
The Throughput Controller is configured in the JMeter script, and the throughput policy is set to Percent Executions. However, in the debugging scenario, only one concurrency thread is allocated. As a result of filtering by percentage, no concurrency thread is executed to the sampler, as shown in the following figure.
Solution
Change the throughput policy to Total Executions, or cancel the Throughput Controller.