When you configure service level objectives (SLOs) for an application in Service Mesh (ASM), a Prometheus rule is automatically generated. This rule defines recording rules for SLO metrics and alerting rules for error budget burn rates. To activate these SLOs, import the generated rule into your Prometheus system.
The following procedure covers importing the rule into a Prometheus Operator-managed instance and verifying that SLO metrics and alerts work correctly.
Prerequisites
Before you begin, make sure that you have:
Prometheus monitoring enabled for the Container Service for Kubernetes (ACK) cluster. For details, see Use open source Prometheus to monitor an ACK cluster and Monitor ASM instances by using a self-managed Prometheus instance
How Prometheus Operator selects rules
The Prometheus Operator uses custom resource definitions (CRDs) to manage Prometheus configurations. To add recording and alerting rules, create a PrometheusRule custom resource (CR). The Prometheus Operator determines which PrometheusRule objects to load based on the ruleSelector field in the Prometheus CR:
If
ruleSelectorspecifiesmatchLabels, thePrometheusRulemust carry the same labels.If
ruleSelectoris left empty, labels are optional.
If your Prometheus deployment does not use the Prometheus Operator, import the generated rule using a method appropriate for your setup. See the Prometheus documentation for guidance.
Step 1: Get the ruleSelector labels
Check the ruleSelector field in the Prometheus CR to determine which labels the Prometheus Operator requires on PrometheusRule objects.
Log on to the ACK console. In the left-side navigation pane, click Clusters.
On the Clusters page, click the name of the cluster that you want to manage and choose Workloads > Custom Resources in the left-side navigation pane.
On the CRDs tab, click PrometheusRule.
On the Resource Objects tab, select monitoring from the Namespace drop-down list. Find ack-prometheus-operator-prometheus and click Edit YAML in the Actions column.
Locate the
ruleSelectorfield. A typical configuration looks like this: In this example, anyPrometheusRulemust include both labels (app: ack-prometheus-operatorandrelease: ack-prometheus-operator) to be selected.ruleSelector: matchLabels: app: ack-prometheus-operator release: ack-prometheus-operator
Step 2: Deploy the PrometheusRule
Create a file named
prometheusrule.yamlwith the following content:Set the
labelsfield to match thematchLabelsvalues from Step 1.Replace the
speccontent with the generated Prometheus rule from the ASM console.
   apiVersion: monitoring.coreos.com/v1
   kind: PrometheusRule
   metadata:
     labels:
       app: ack-prometheus-operator
       release: ack-prometheus-operator
     name: asm-rules
     namespace: monitoring
   spec:
     # Replace with the generated Prometheus rule.
Apply the
PrometheusRuleto the ACK cluster:kubectl apply -f prometheusrule.yaml
Step 3: Verify that the rule is loaded
After the PrometheusRule is applied, the Prometheus Operator controller automatically writes the rule configurations into the Prometheus ConfigMap. Verify this through either the ACK console or the command line.
Option A: ACK console
Log on to the ACK console. In the left-side navigation pane, click Clusters.
On the Clusters page, click the name of the cluster that you want to manage and choose Configurations > ConfigMaps in the left-side navigation pane.
On the ConfigMap page, select monitoring from the Namespace drop-down list, find the Prometheus ConfigMap, and click Edit YAML in the Actions column.
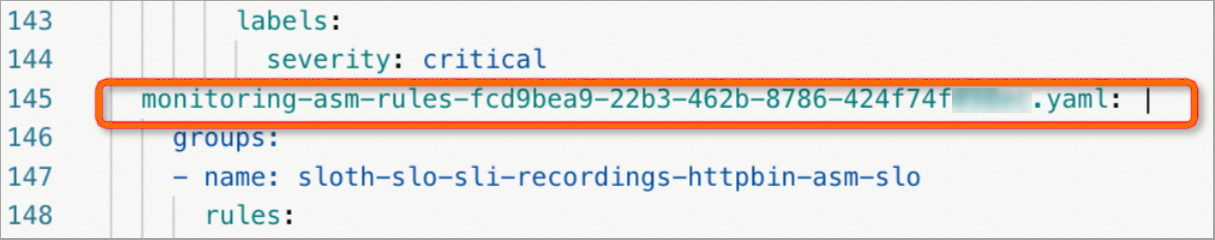
Confirm that the ASM SLO rules appear in the ConfigMap. The following figure shows a successful import.
Option B: Command line
Run the following command to list PrometheusRule resources:
kubectl get prometheusrules -n monitoringThe output should include the asm-rules PrometheusRule.
Step 4: Verify that SLOs are active
Check recording rules and alerting rules
Forward local port 9090 to the Prometheus service:
kubectl --namespace monitoring port-forward svc/ack-prometheus-operator-prometheus 9090Open http://localhost:9090 in a browser to access the Prometheus console.
On the Prometheus page, enter
asm_slo_infoin the query box and click Execute. If the query returns results, the recording rules are active.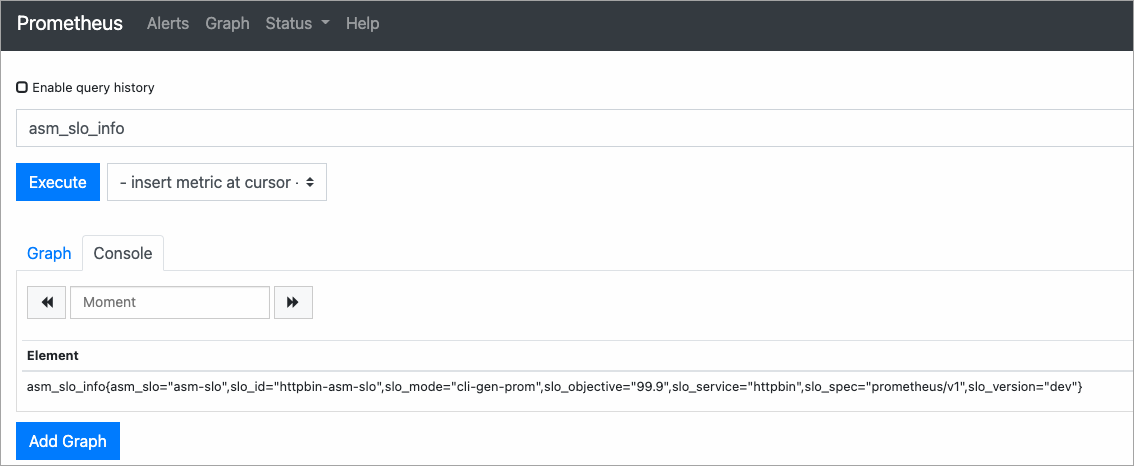
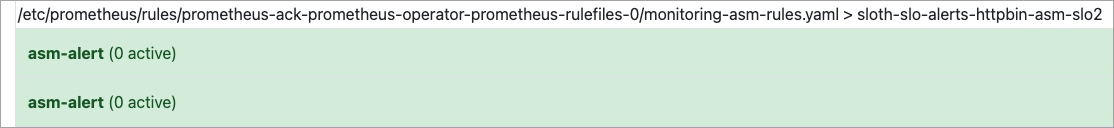
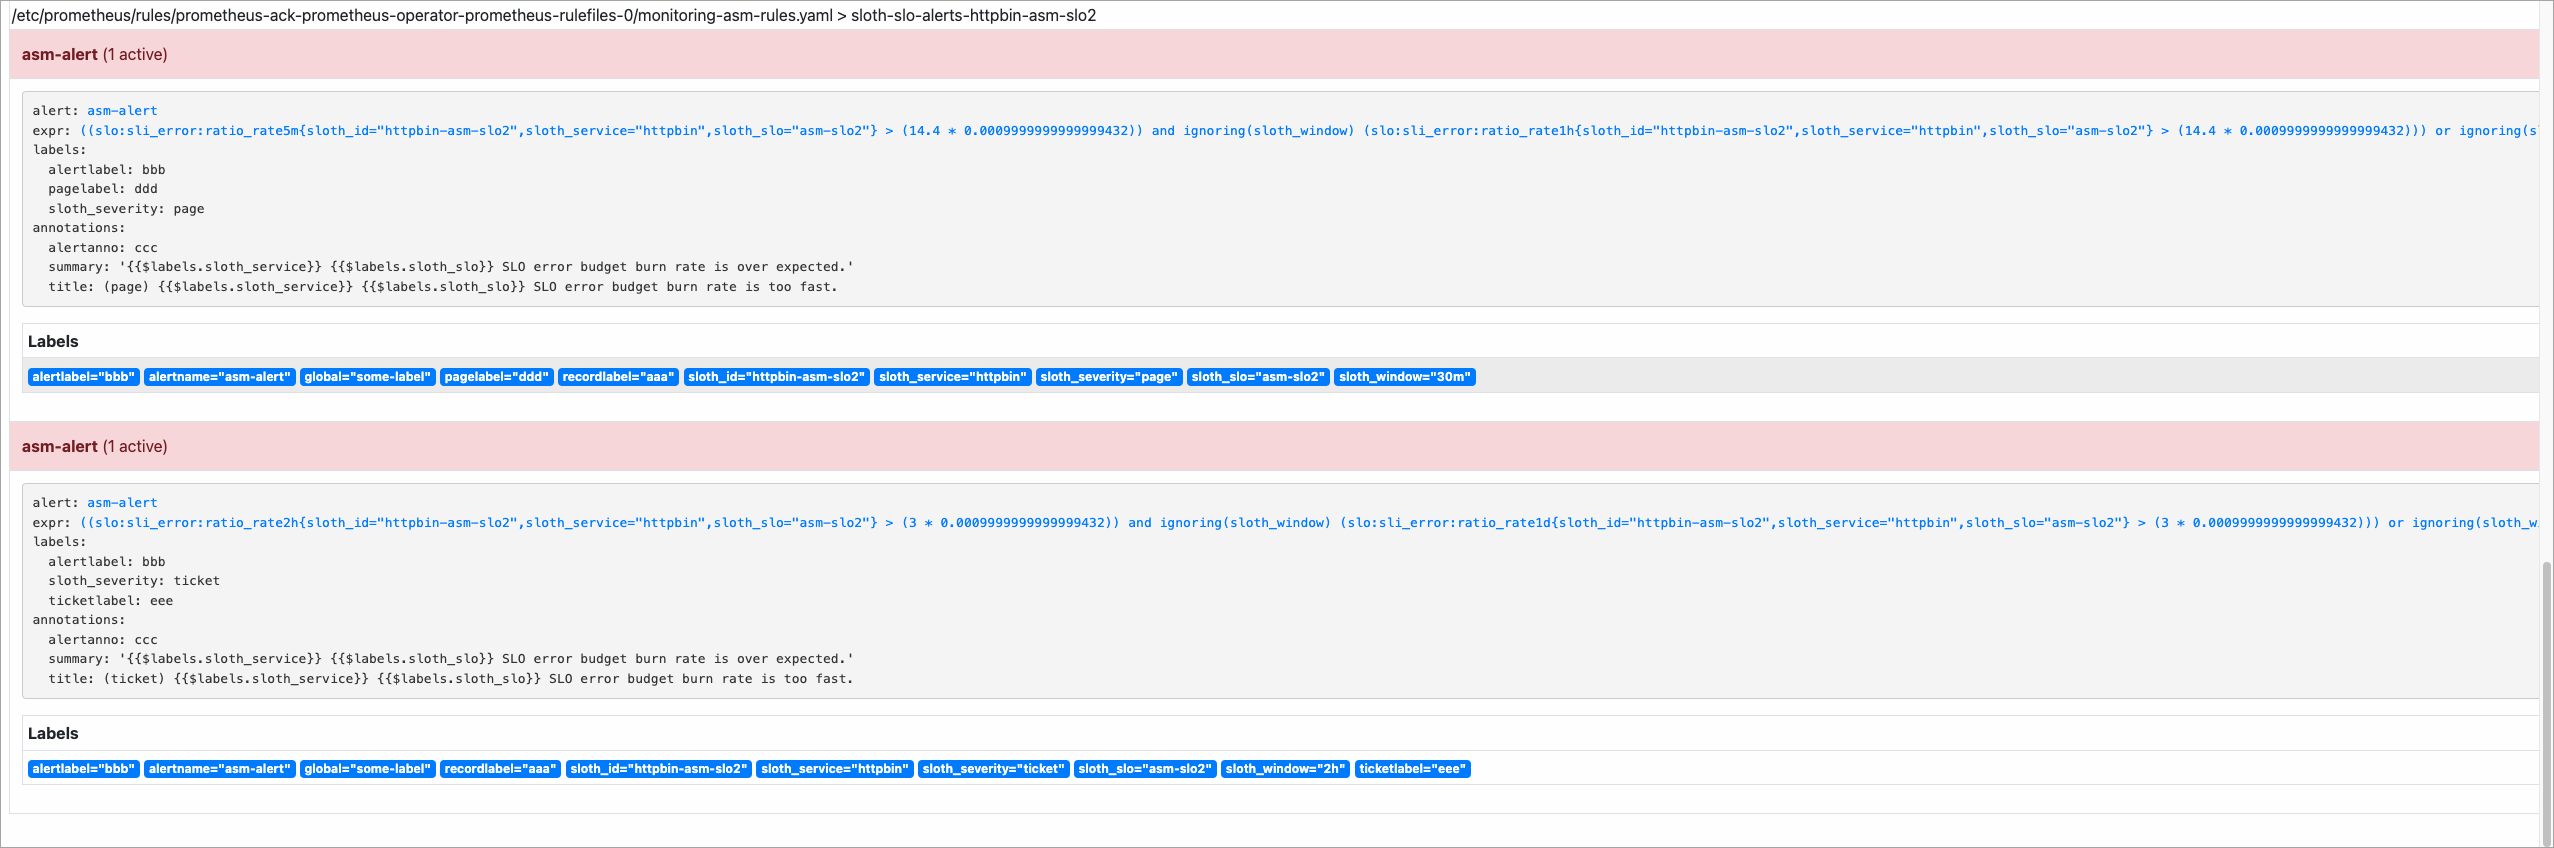
In the top navigation bar, click Alerts to verify that the alerting rules are loaded.
Simulate traffic to validate SLO metrics
Use the following scenarios to confirm that metrics and alerts respond correctly.
Scenario 1: Normal traffic (99.5% success rate)
This script sends 200 requests where only 1 returns a 500 error, simulating a 99.5% success rate:
#!/bin/bash
for i in $(seq 200)
do
  if (( $i == 100 ))
  then
    curl -I http://<ingress-gateway-ip>/status/500;
  else
    curl -I http://<ingress-gateway-ip>/;
  fi
  echo "OK"
  sleep 0.01;
done;
Replace <ingress-gateway-ip> with the IP address of the ingress gateway. For details, see Deploy an ingress gateway service.
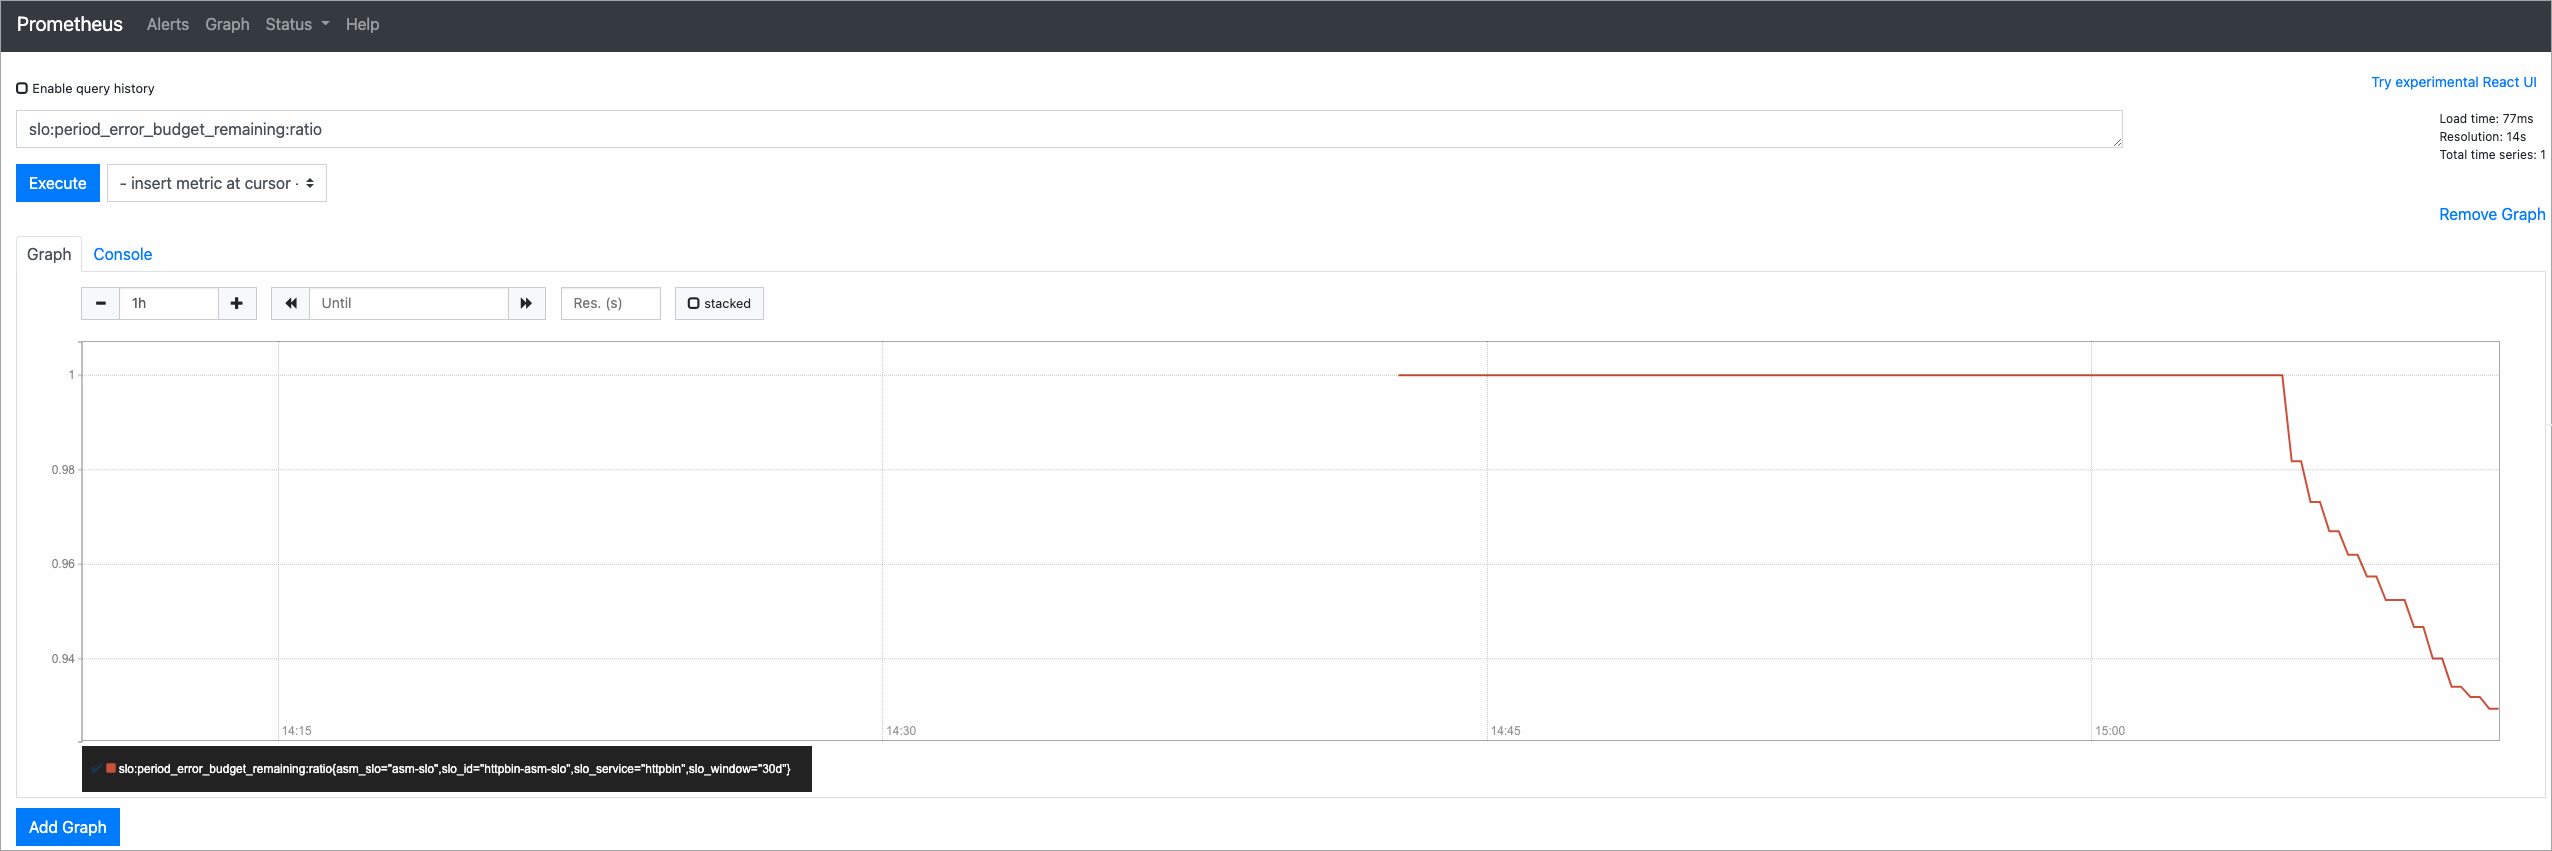
After the script completes, query slo:period_error_budget_remaining:ratio in the Prometheus console to check the remaining error budget. A value close to 1 indicates most of the budget remains intact.
Scenario 2: Error traffic (50% failure rate)
This script sends alternating successful and failing requests to simulate a 50% error rate and trigger burn rate alerts:
#!/bin/bash
for i in $(seq 200)
do
  curl -I http://<ingress-gateway-ip>/
  curl -I http://<ingress-gateway-ip>/status/500;
  echo "OK"
  sleep 0.01;
done;
After the script completes, open the Alerts page in the Prometheus console. If the burn rate exceeds the threshold, alerts fire.
SLO metric reference
The following table describes the SLO metrics used for monitoring. For a detailed explanation of SLO concepts such as error budgets and multi-window burn rate alerting, see SLO overview.
| Metric | Description | Interpretation |
|---|---|---|
slo:period_error_budget_remaining:ratio | Remaining error budget as a ratio during the 30-day compliance period. | 1 = full budget available. 0 = budget exhausted. Values between 0 and 1 indicate partial consumption. |
slo:sli_error:ratio_rate30d | Average error rate over the 30-day compliance period. | Lower values indicate better service reliability. |
slo:period_burn_rate:ratio | Rate at which the error budget is consumed over the 30-day compliance period. | 1 = budget consumed at exactly the expected rate. Values above 1 indicate faster-than-sustainable consumption. |
slo:current_burn_rate:ratio | Current burn rate based on a shorter time window. | Values above 1 indicate the budget is being consumed faster than sustainable and may trigger alerts. |
View alerts in Alertmanager
Alertmanager collects alerts from Prometheus and routes them to configured receivers such as email or webhook endpoints.
Forward local port 9093 to the Alertmanager service:
kubectl --namespace monitoring port-forward svc/ack-prometheus-operator-alertmanager 9093Open http://localhost:9093 in a browser to access the Alertmanager console.
On the Alertmanager page, click the
 icon to expand and view alert details.
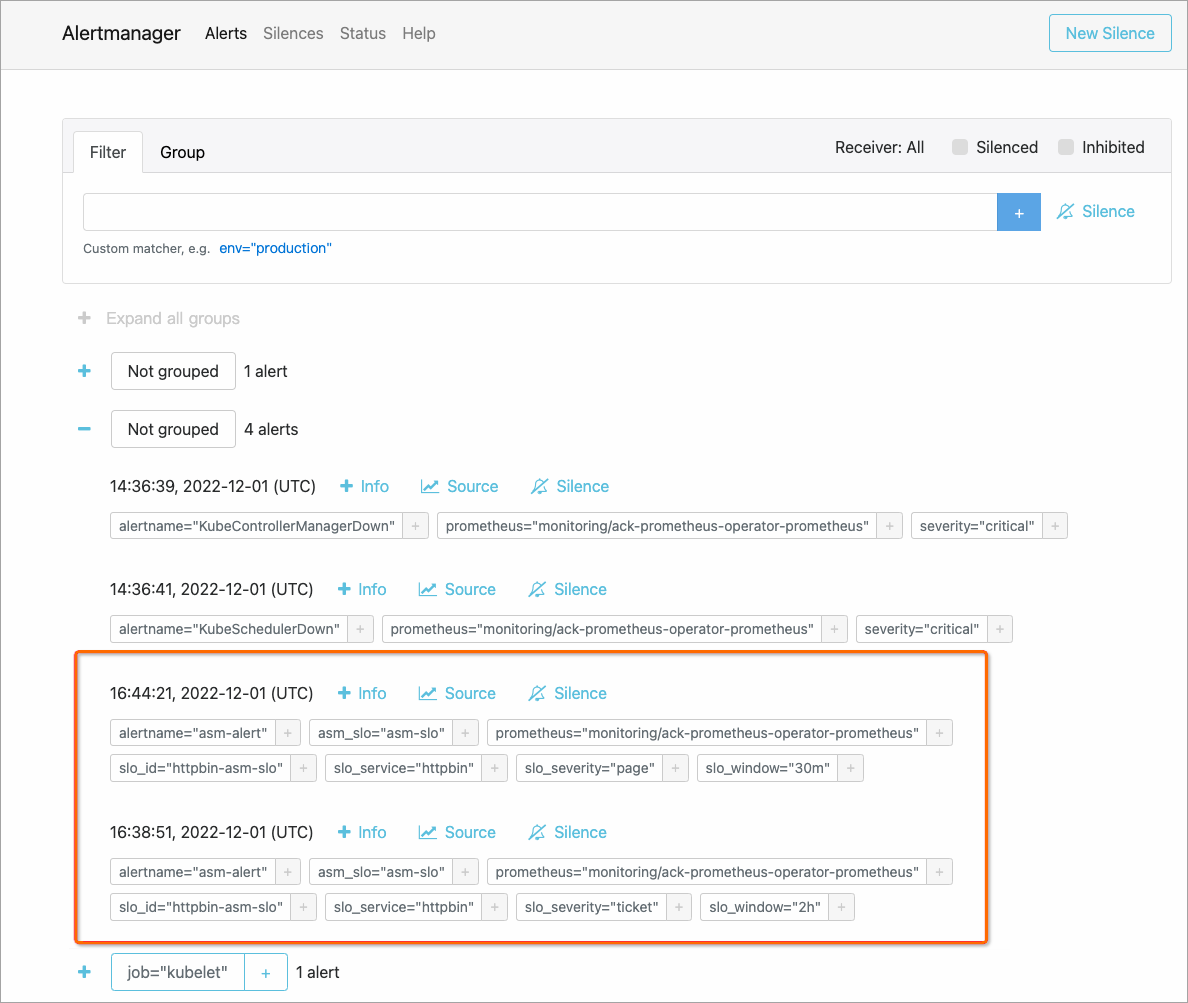
What to do next
Configure SLOs for applications in ASM to add or modify SLO targets
SLO overview for a detailed explanation of SLO concepts, metrics, and multi-window burn rate alerting