The Overview page in the Captcha 2.0 console shows real-time protection statistics for your CAPTCHA integration. Use it to monitor traffic volumes, understand how requests are distributed across regions and scenarios, and detect anomalies in verification patterns.
Prerequisites
Before you begin, make sure you have:
At least one verification scenario created
View the Captcha overview
Open the Captcha 2.0 console. The Overview page contains three sections: Today's Summary Metrics, Version Information, and Traffic Trend.Captcha 2.0 console
Today's summary metrics
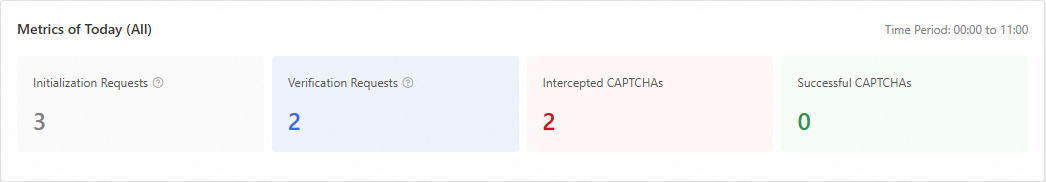
This section shows four counters for the current day. Filter by region — Chinese Mainland, Outside Chinese Mainland, or All — to scope the data.
Client-side metric
| Metric | What it measures |
|---|---|
| Initialization Requests | Number of times the Captcha is loaded on the client |
Server-side metrics
| Metric | What it measures |
|---|---|
| Verification Requests | Number of verification requests sent to the Alibaba Cloud server |
| Intercepted CAPTCHAs | Number of verification requests blocked by the Alibaba Cloud server |
| Successful CAPTCHAs | Number of verification requests allowed by the Alibaba Cloud server |
Version information

This section displays instance-level details:
Total activation time
Identity tag
Number of scenarios
Average daily verification requests for the last 7 days
Supported verification types
From this section, you can also perform the following actions:
Purchase Resource Plan — buy a resource plan to offset Captcha call fees and reduce costs
Custom Policy — enable or disable custom policies for your instance
Verification Type — review the verification types supported by your Captcha instance
Version information
In the version information section, you can view the total activation time, identity tag, number of scenarios, average daily verification requests for the last 7 days, and supported verification types. You can also perform the following operations:
Purchase Resource Plan: Resource plans are used to offset Captcha call fees and reduce costs.
Custom Policy: You can enable or disable custom policies.
Verification Type: You can view the verification types supported by your Captcha instance.
Traffic trend
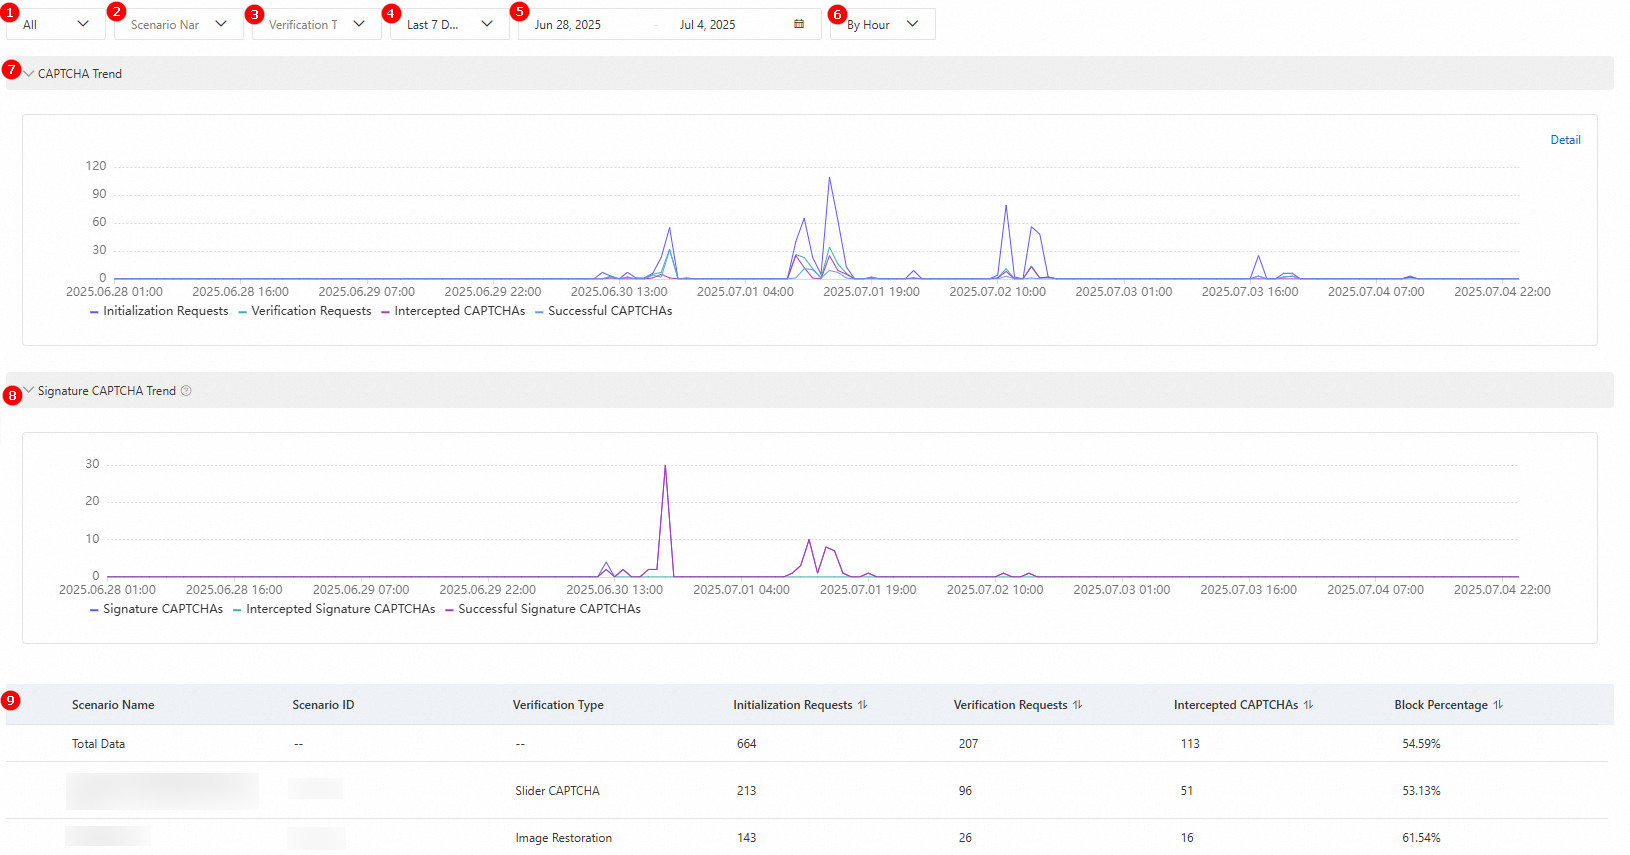
The Traffic Trend section lets you filter and analyze verification data across multiple dimensions.
Filters
| Filter | Default | Options |
|---|---|---|
| Region | All | Chinese Mainland, Outside Chinese Mainland, All |
| Scenario name | All scenarios | Any single scenario |
| Verification type | All types | Any single CAPTCHA type |
| Date range | Last 7 Days | Yesterday, Today, Last 30 Days |
| Custom date range | — | Any specific time period |
| Time granularity | — | By Hour, By Day |
Chart views
The verification trend chart (viewable By Hour or By Day) plots Initialization Requests, Verification Requests, Intercepted CAPTCHAs, and Successful CAPTCHAs over the selected time range. Hover over any point on the chart to see exact counts for that moment. Click Detail in the upper-right corner to open the Traffic Details panel, which lists daily traffic figures for the selected date range.
The signature verification trend chart tracks a separate flow specific to the client V3 integration architecture. In this architecture, a successful client-side verification returns a CaptchaVerifyParam to the business client. Requests from the business server to the Captcha server that carry this parameter are counted as signature verification requests.
Scenario list
Below the charts, the scenario list shows each scenario's Scenario Name, Scenario ID, and Block Percentage for the selected time range.