By default, the Performance Trends tab displays the basic performance metrics of an ApsaraDB for MongoDB instance. On the Custom Chart tab, you can present multiple specified performance metrics in a customized trend chart to monitor and analyze the performance metrics and the corresponding performance trends. This topic describes how to add a custom performance trend chart for an ApsaraDB for MongoDB instance in a dashboard.
Prerequisites
The instance is a standalone instance, a replica set instance, or a sharded cluster instance that adopts the MongoDB protocol type.
Procedure
Go to the Replica Set Instances or Sharded Cluster Instances page. In the top navigation bar, select the region in which the instance resides. Then, find the instance and click the ID of the instance.
In the left-side navigation pane, click Performance.
Click the Custom Charts tab.
On the Custom Charts tab, manage a dashboard.
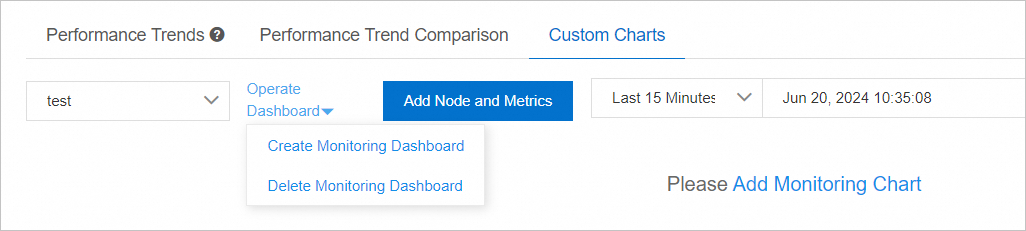
Create a dashboard
From the Operate Dashboard drop-down list, select Create Monitoring Dashboard.
In the Create Monitoring Dashboard dialog box, enter a dashboard name and then click OK.
Click Add Node and Metrics or Add Monitoring Chart.
In the Select Metrics of Monitoring Chart panel, select nodes and metrics and then click the
 icon. Note
Then, you can view the performance trends of the selected metrics in the Chart section.
Click OK.
Delete a dashboard
Select a dashboard name from the Operate Dashboard drop-down list. Then, select Delete Monitoring Dashboard from the Operate Dashboard drop-down list.
In the Delete Monitoring Dashboard message, read the prompt and then click OK.
View a dashboard
Select a dashboard name from the Operate Dashboard drop-down list.
Select a time range and then click Search.